Nasdaq 100 2026 YTD Highs & Lows Radar: Crowdstrike (CRWD), Honeywell (HON) and more
MarketsFN Team

Nasdaq 100 2026 YTD Highs & Lows Radar: Crowdstrike (CRWD), Honeywell (HON) and more
Screening all 101 Nasdaq 100 constituents for stocks nearest to their 2026 year-to-date high and their 2026 YTD low. Data as of September 15, 2026. % Realized = total return since Jan 1 2026.
Legend: RSI > 70 = overbought · RSI < 30 = oversold · Green % Realized = positive YTD return · Red = negative.
📈 Nearest to 2026 High
Sectors represented: Technology (4), Communication Services (1)
| Ticker | Company | Sector | Price Last | % Realized | 2026 YTD High Date | RSI | % above MA200 | Trend |
|---|---|---|---|---|---|---|---|---|
| CRWD | Crowdstrike Holdings Inc | Technology | $235.38 | +107.58% | 2026-09-14 | 62.7 | +62.1% | Above MA20, MA50, MA200 |
| EA | Electronic Arts, Inc | Communication Services | $209.70 | +0.38% | 2026-08-04 | — | — | — |
| TEAM | Atlassian Corporation | Technology | $192.77 | +24.56% | 2026-09-03 | 65.0 | +74.7% | Above MA20, MA50, MA200 |
| CDW | CDW Corp | Technology | $151.70 | +13.92% | 2026-08-04 | 59.3 | +14.9% | Above MA20, MA50, MA200 |
| FTNT | Fortinet Inc | Technology | $170.18 | +118.52% | 2026-08-27 | 59.6 | +51.2% | Above MA20, MA50, MA200 |
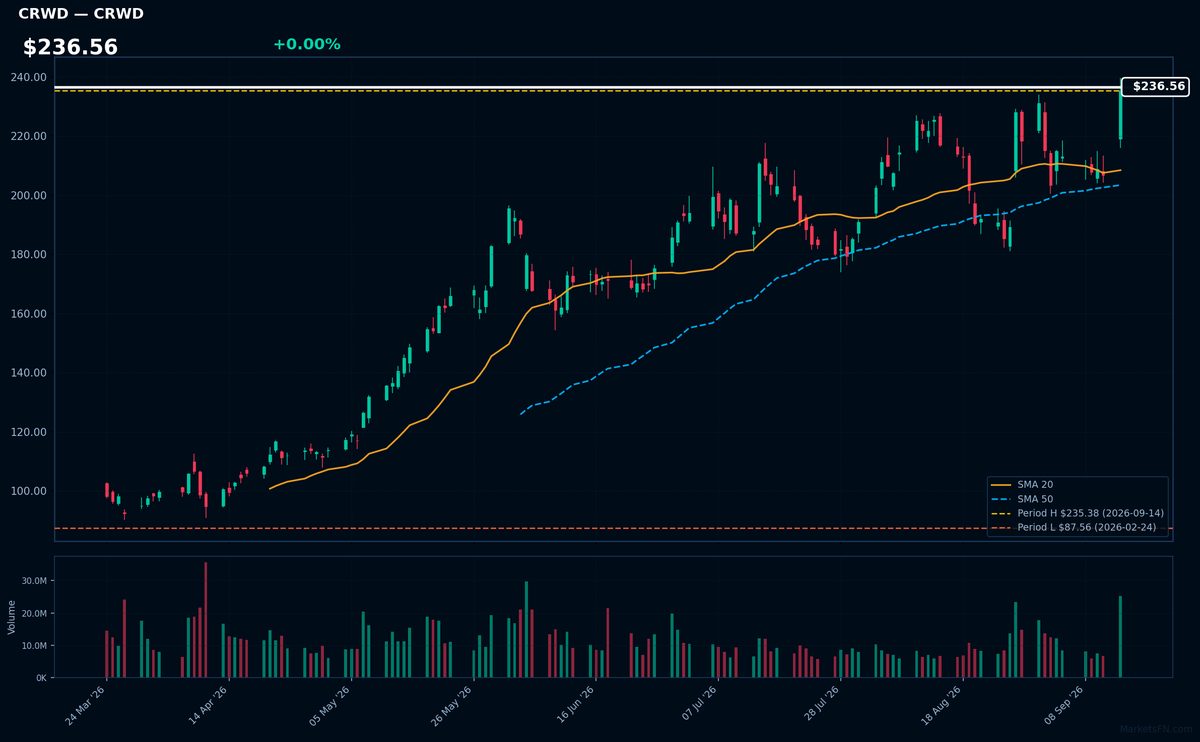
CRWD | Crowdstrike Holdings Inc | Technology | Price Last: $235.38 | % Realized: +107.58% | RSI: 62.7 | % above MA200: +62.1% | Trend: Above MA20, MA50, MA200
Crowdstrike Holdings Inc is a cybersecurity company providing cloud-delivered endpoint protection. Investors should care because its innovative Falcon platform has driven significant growth, making it a key player in the rapidly expanding cybersecurity market.
Crowdstrike's technicals indicate sustained uptrend with price at $236.56, RSI(14) at 62.7, and bullish MA alignment (price > MA20 > MA50 > MA200). It's near its 2026 YTD high, 0.0% below, suggesting potential breakout momentum.
Related headlines
- AI Safety Fears Drive Investors to J&J, Costco, and CrowdStrike for Cybersecurity
- Why Did CRWD, ELMT, OKTA Stocks Surge To 52-Week Highs Today?
- S&P 500, Nasdaq, Dow Drop On Chipmaker Weakness, Treasury Yield Pressure MSFT, NFLX, ORCL, CRWD, RBLX In Focus
- CrowdStrike and Palo Alto Networks are leading software stocks toward a never-before-seen feat
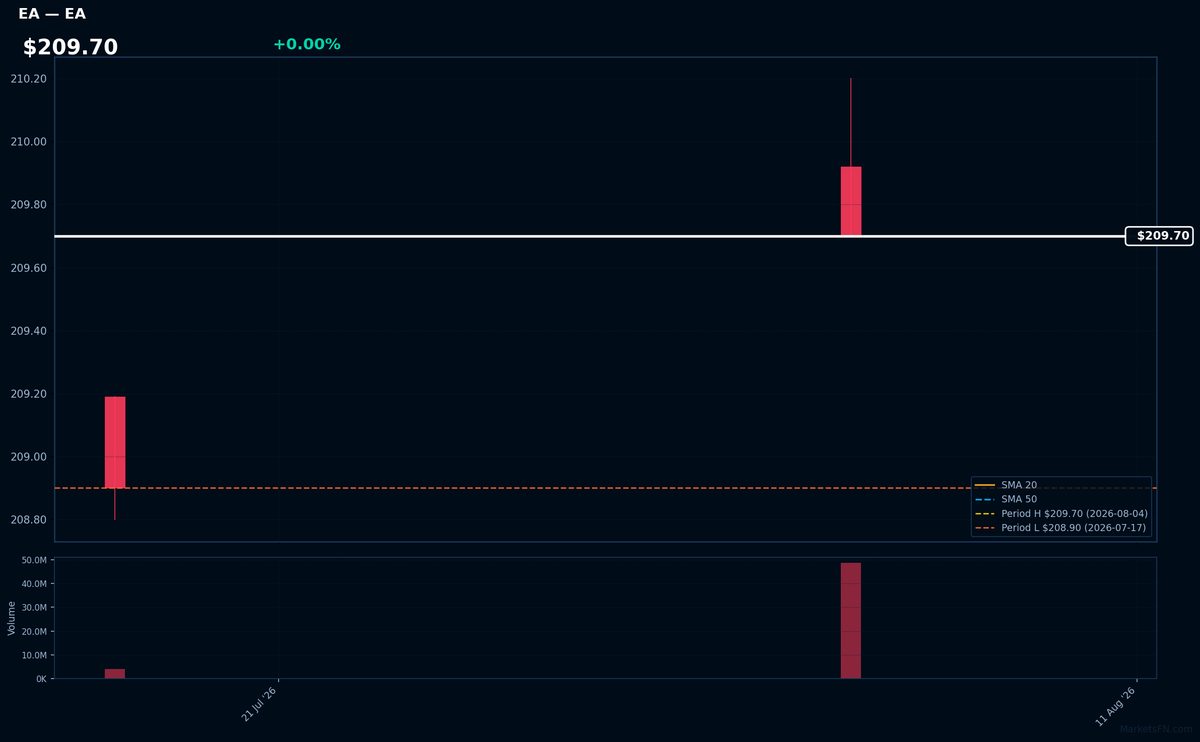
EA | Electronic Arts, Inc | Communication Services | Price Last: $209.70 | % Realized: +0.38% | RSI: — | % above MA200: — | Trend: —
Electronic Arts, Inc (EA) is a video game company that develops and publishes games such as FIFA and Madden NFL. Investors should care because its games generate significant revenue, and the company's performance can indicate trends in the gaming industry.
The stock is near its 2026 YTD high, up 0.4% YTD. With RSI(14) being N/A and MA data incomplete, a technical assessment cannot be made based on these indicators. The proximity to its YTD high may indicate a potential breakout.
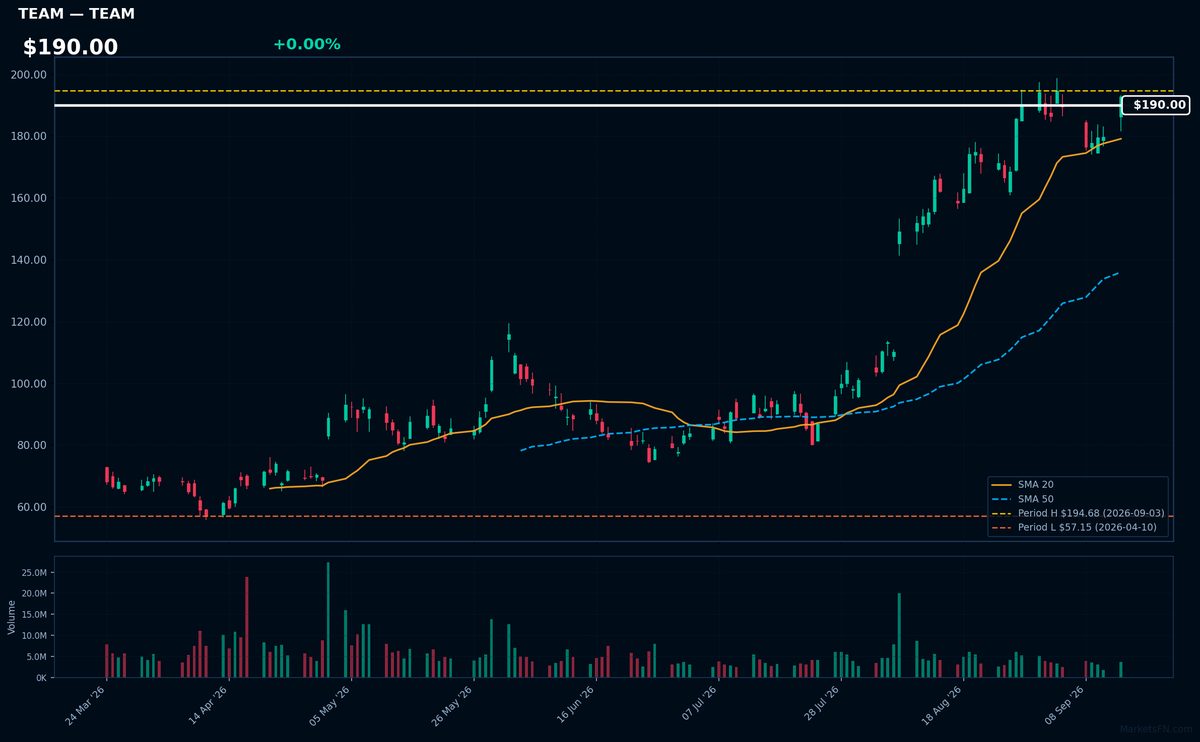
TEAM | Atlassian Corporation | Technology | Price Last: $192.77 | % Realized: +24.56% | RSI: 65.0 | % above MA200: +74.7% | Trend: Above MA20, MA50, MA200
Atlassian Corporation is a software company providing collaboration and productivity tools like Jira and Confluence. Investors should care because its products are integral to software development and IT teams, driving recurring revenue growth.
Atlassian's technicals indicate momentum: RSI(14) is 65.0, and MA alignment is bullish with price > MA20 > MA50 > MA200. The stock is 1.0% below its 2026 YTD high, suggesting a potential breakout.
Related headlines
- Atlassian Shares Rise 3% as Software Stocks Outperform Chipmakers
- Atlassian Launches System to Coordinate and Accelerate Agentic Engineering
- Why Did SNOW, DELL, TEAM Stocks Surge To 52-Week Highs Today?
- TEAM Stock Heads For Best Month Ever As Software Stocks Swing From SaaSpocalypse To Full Revival In One Month
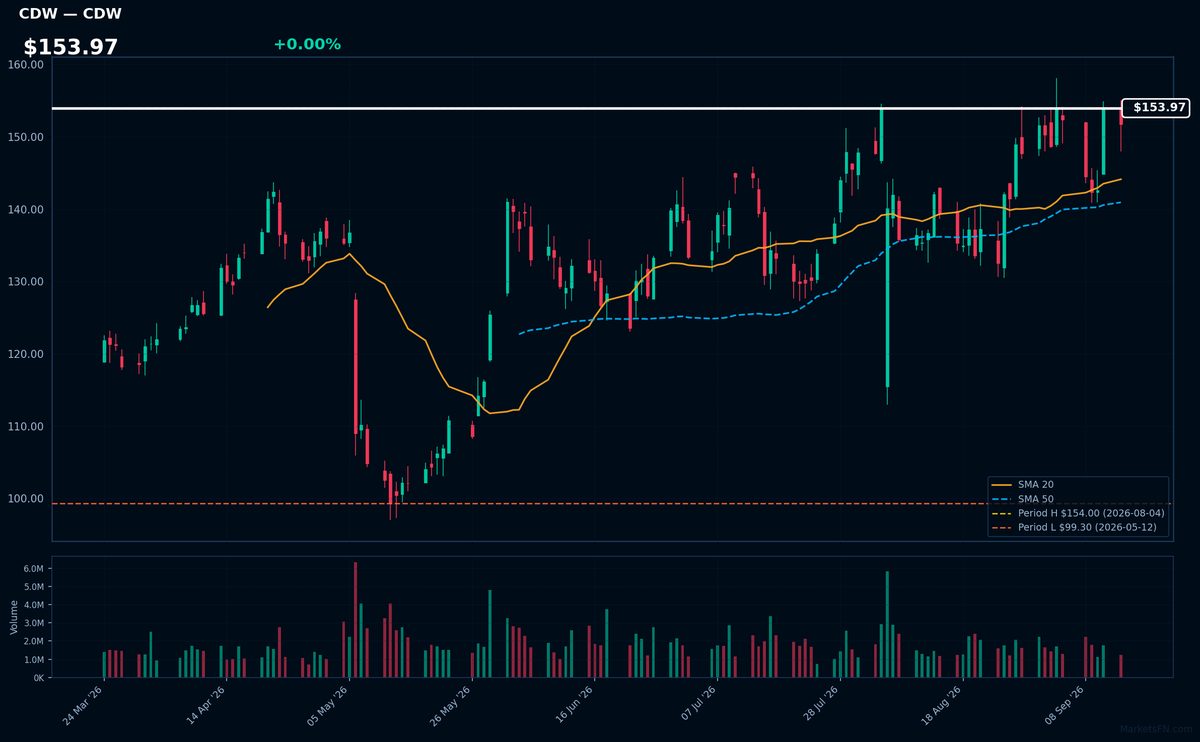
CDW | CDW Corp | Technology | Price Last: $151.70 | % Realized: +13.92% | RSI: 59.3 | % above MA200: +14.9% | Trend: Above MA20, MA50, MA200
CDW Corp is a technology solutions provider offering a range of products and services to businesses, governments, and educational institutions. Investors should care because its diversified portfolio and strong customer relationships drive revenue growth.
CDW Corp's technical situation indicates momentum, with an RSI(14) of 59.3 and a bullish MA alignment (price > MA20 > MA50 > MA200), suggesting a sustained uptrend. The stock is 1.5% below its 2026 YTD high, nearing a potential breakout.
Related headlines
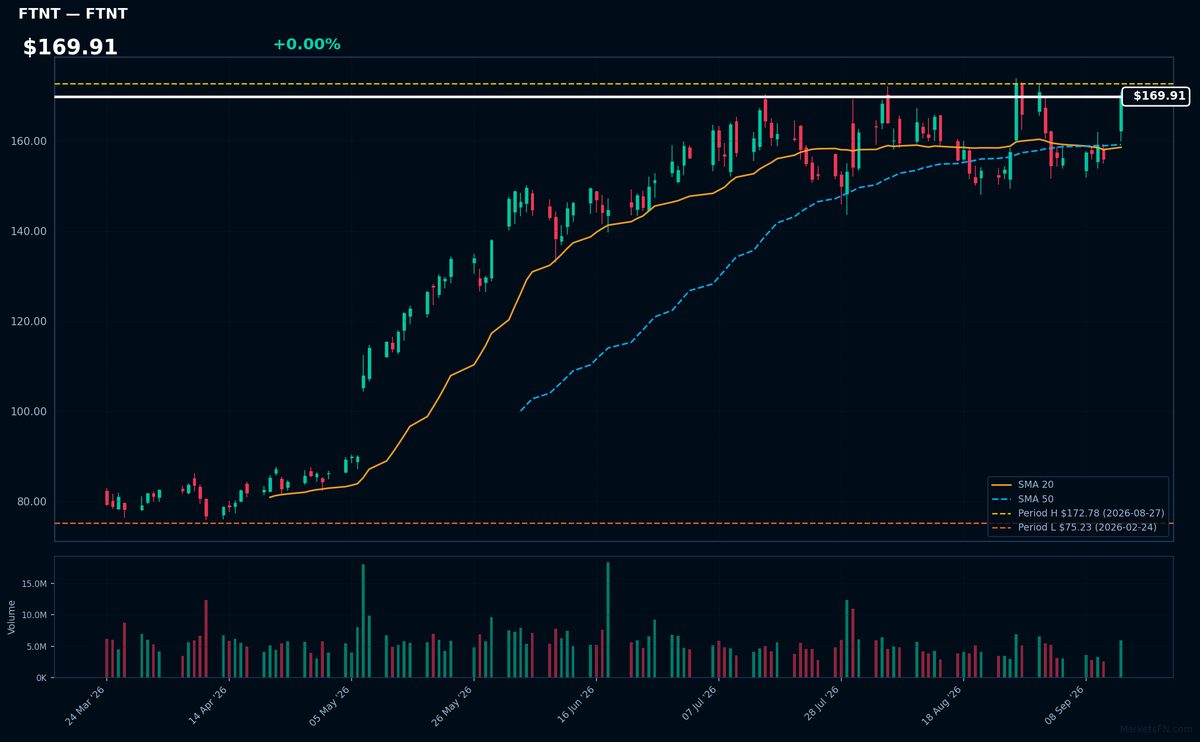
FTNT | Fortinet Inc | Technology | Price Last: $170.18 | % Realized: +118.52% | RSI: 59.6 | % above MA200: +51.2% | Trend: Above MA20, MA50, MA200
Fortinet Inc is a cybersecurity company providing security solutions such as firewalls and intrusion detection/prevention systems. Investors should care because its products protect networks from cyber threats, a growing concern for businesses and organizations.
Fortinet Inc's RSI(14) is 59.6, indicating neutral momentum. The stock is above MA20, MA50, and MA200, showing a strong uptrend. It's 1.5% below its 2026 YTD high, suggesting a potential breakout.
Related headlines
- Fortinet Expands U.S. Presence with New Company-Owned Innovation Hub in New York City
- 2 Top Cybersecurity Stocks to Buy Amid AI Safety Fears: FTNT, QLYS
- Cybersecurity Stocks Jump As Anthropic CEOs AI Slowdown Call Sharpens Focus On Cyber Risks CRWD, PANW, FTNT Buck Market Selloff
- CRWD Stock Leads Wedbushs Cybersecurity Bets: Check Point, Fortinet, Varonis, Telos Downgraded
📉 Nearest to 2026 Low
Sectors represented: Industrials (1), Utilities (1), Communication Services (1), Healthcare (1), Consumer Defensive (1)
| Ticker | Company | Sector | Price Last | % Realized | 2026 YTD Low Date | RSI | % above MA200 | Trend |
|---|---|---|---|---|---|---|---|---|
| HON | Honeywell International Inc | Industrials | $201.38 | -1.97% | 2026-09-14 | 27.7 | -12.4% | Below MA20, MA50, MA200 |
| EXC | Exelon Corp | Utilities | $42.72 | -2.73% | 2026-09-14 | 30.8 | -6.8% | Below MA20, MA50, MA200 |
| EA | Electronic Arts, Inc | Communication Services | $209.70 | +0.38% | 2026-07-17 | — | — | — |
| IDXX | Idexx Laboratories, Inc | Healthcare | $509.56 | -23.95% | 2026-09-11 | 32.7 | -15.2% | Below MA20, MA50, MA200 |
| PEP | PepsiCo Inc | Consumer Defensive | $136.34 | -4.14% | 2026-07-23 | 36.6 | -8.2% | Below MA20, MA50, MA200 |
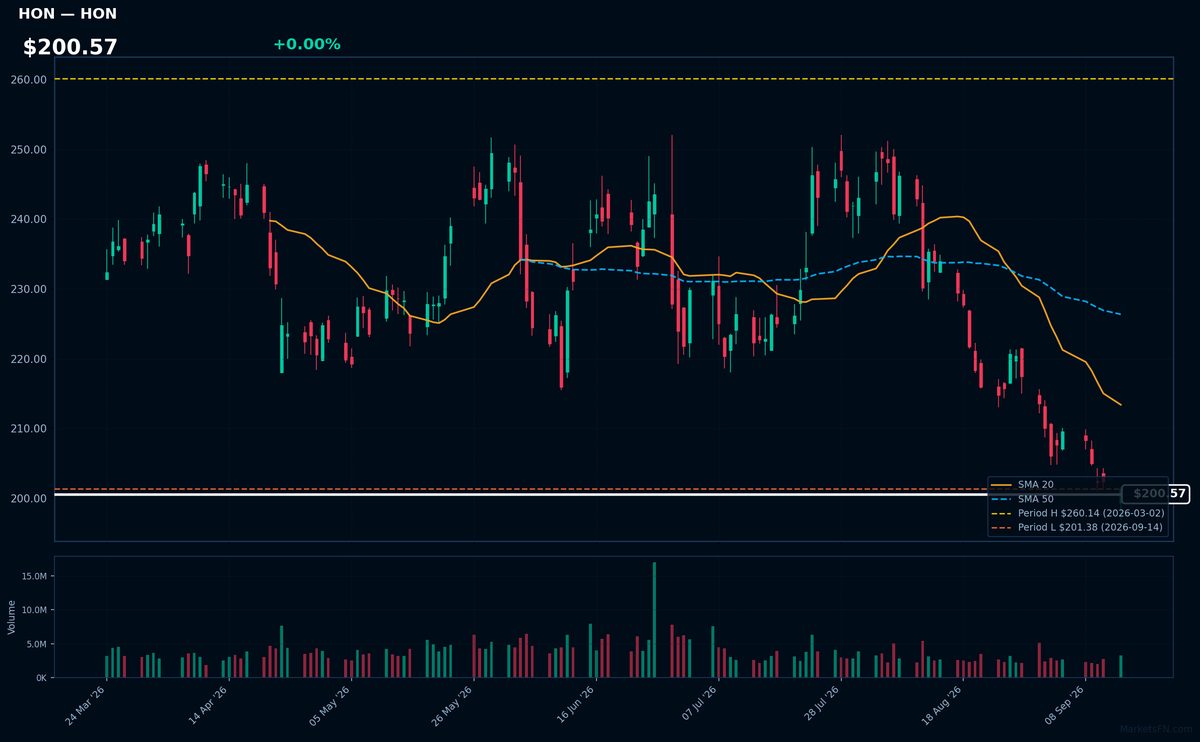
HON | Honeywell International Inc | Industrials | Price Last: $201.38 | % Realized: -1.97% | RSI: 27.7 | % above MA200: -12.4% | Trend: Below MA20, MA50, MA200
Honeywell International Inc is a diversified technology conglomerate that produces aerospace products, building technologies, and performance materials. Investors should care about its exposure to industrial and commercial sectors, as well as its innovation in areas like energy efficiency and safety solutions.
Honeywell's current technical situation indicates a sustained downtrend with price ($200.57) below MA20, MA50, and MA200. The RSI(14) at 27.7 suggests oversold conditions, and the stock is testing major support at its 2026 YTD low.
Related headlines
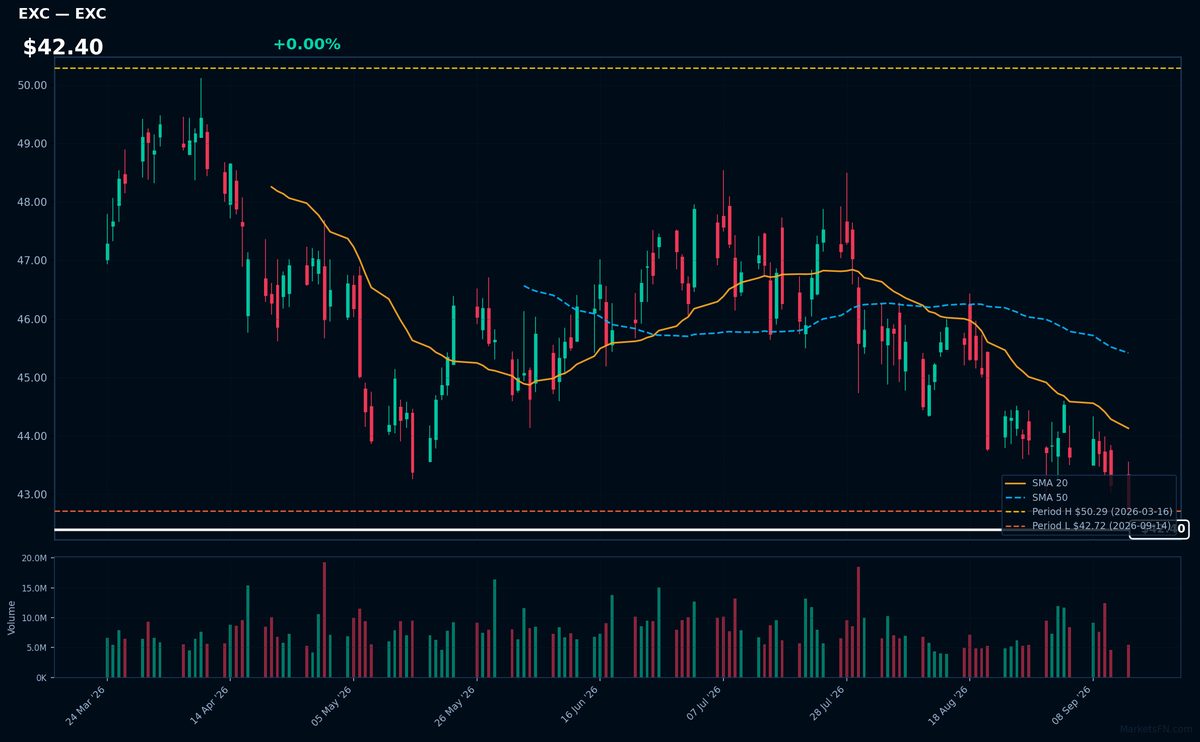
EXC | Exelon Corp | Utilities | Price Last: $42.72 | % Realized: -2.73% | RSI: 30.8 | % above MA200: -6.8% | Trend: Below MA20, MA50, MA200
Exelon Corp (EXC) is a utility company that operates in the energy sector, generating and distributing electricity. Investors should care about its stable dividend yield and potential for long-term growth driven by increasing demand for clean energy.
Exelon Corp's current technical situation is bearish, with an RSI(14) of 30.8 indicating oversold conditions, and a sustained downtrend as price ($42.40) remains below MA20, MA50, and MA200, with the stock testing major support at its 2026 YTD low.
Related headlines
- Exelon Announces Key Leadership Position Changes
- Exelon Secures More Than $1 Billion in Customer Protections Through Pioneering Transmission Security Agreements
- Exelon high probability data center load falls 40%
- Exelon Corp (EXC) (Q2 2026) Earnings Call Highlights: Navigating Regulatory Hurdles and Data ...
EA | Electronic Arts, Inc | Communication Services | Price Last: $209.70 | % Realized: +0.38% | RSI: — | % above MA200: — | Trend: —
Electronic Arts, Inc (EA) is a video game company that develops and publishes games such as FIFA and Madden NFL. Investors should care because its games generate significant revenue, and the company's performance can indicate trends in the gaming industry.
The stock is near its 2026 YTD high, up 0.4% YTD. With RSI(14) being N/A and MA data incomplete, a technical assessment cannot be made based on these indicators. The proximity to its YTD high may indicate a potential breakout.
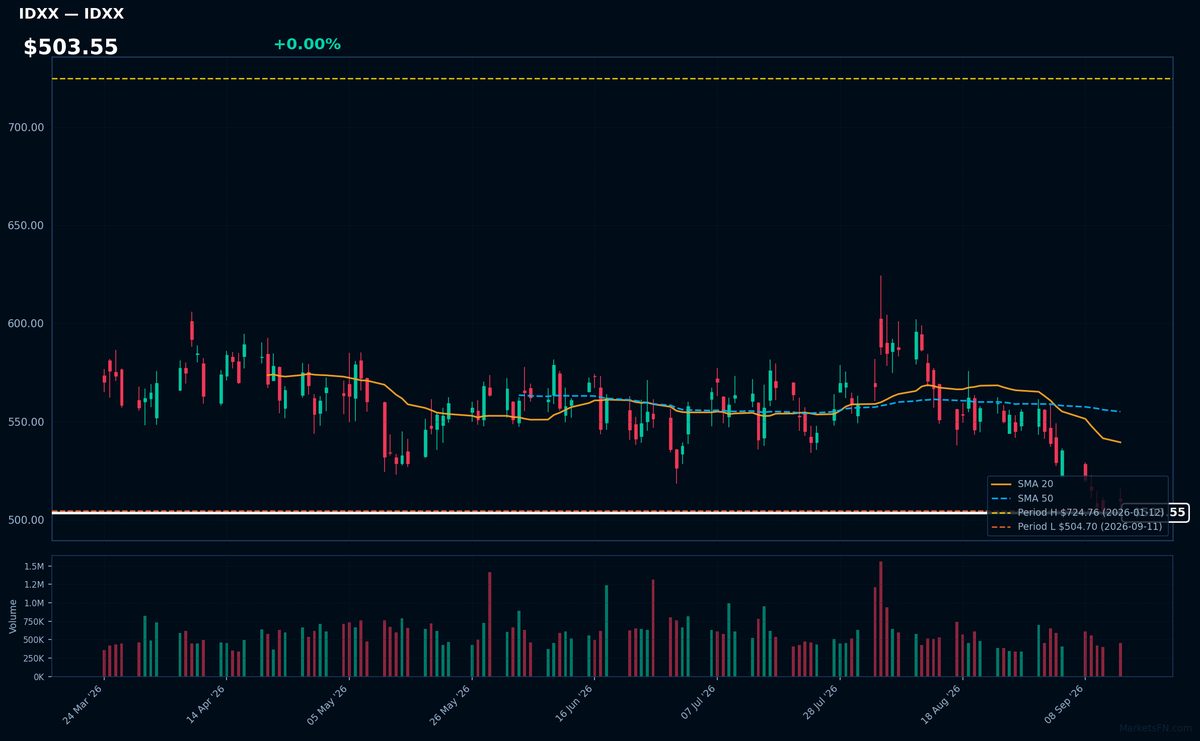
IDXX | Idexx Laboratories, Inc | Healthcare | Price Last: $509.56 | % Realized: -23.95% | RSI: 32.7 | % above MA200: -15.2% | Trend: Below MA20, MA50, MA200
Idexx Laboratories, Inc is a veterinary diagnostics company providing testing solutions and companion animal care products. Investors should care due to its significant presence in the $7.5 billion global veterinary diagnostics market, driven by pet humanization trends and increasing animal healthcare spending.
IDXX is in a sustained downtrend with price < MA20 < MA50 < MA200, RSI(14) at 32.7, and is 1.0% above its 2026 YTD low, indicating a potential support test; this technical alignment is a warning sign, not indicative of momentum or fundamental strength.
Related headlines
- IDEXX Laboratories to Participate in Morgan Stanley 24th Annual Global Healthcare Conference
- IDEXX Expands Catalyst Platform into Cardiac Disease with First and Only Dual-Species Point-of-Care NT-proBNP Test
- IDEXX Laboratories, Inc. Q2 2026 Earnings Call Summary
- IDEXX Laboratories Inc (IDXX) (Q2 2026) Earnings Call Highlights: Strong Revenue Growth and ...
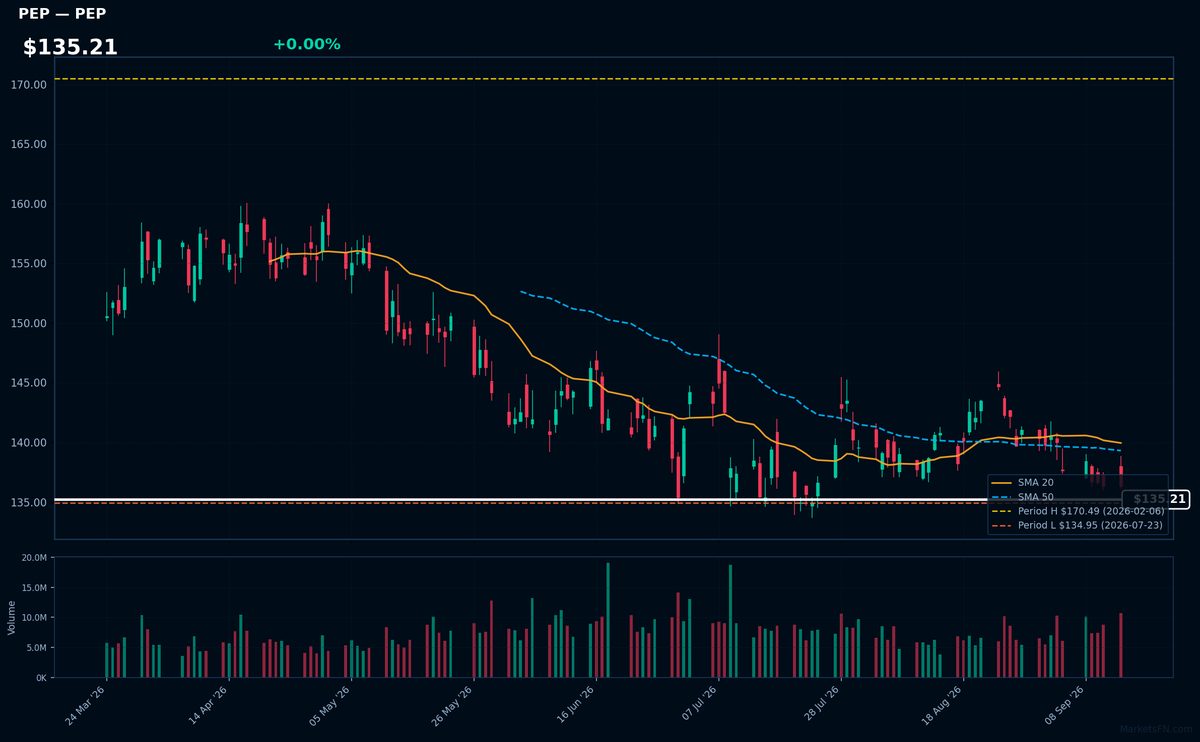
PEP | PepsiCo Inc | Consumer Defensive | Price Last: $136.34 | % Realized: -4.14% | RSI: 36.6 | % above MA200: -8.2% | Trend: Below MA20, MA50, MA200
PepsiCo Inc is a multinational food and beverage corporation that generates revenue through the sale of popular brands like Pepsi, Lay's, and Gatorade, making it a significant player in the consumer staples sector, with investors drawn to its stable cash flows and dividend payouts.
PepsiCo's current technical situation is bearish, with an RSI(14) of 36.6 indicating oversold conditions, and the stock price below MA20, MA50, and MA200, signaling potential further downside; it's currently testing major support, having fallen to just 1.0% above its 2026 YTD low.
Related headlines
Market Commentary
The Nasdaq 100 stocks listed are near their 2026 year-to-date (YTD) extremes, with some at their highs and others at their lows. Stocks like CRWD and EA are at their 2026 highs, indicating strong performance, while HON and EXC are at their 2026 lows, suggesting weaker performance.
The technology sector themes driving these moves include the ongoing demand for cybersecurity solutions, as seen in CRWD's strong performance, and the resilience of gaming companies like EA. Macro conditions, such as economic stability and interest rates, may also be influencing the performance of these stocks. The presence of non-tech stocks like HON, EXC, and PEP near their lows suggests that broader market conditions are also at play.
Investors and traders should watch the next market drivers, including earnings reports and economic indicators, to gauge the direction of these stocks. Monitoring the percentage changes from their YTD extremes, such as TEAM's -1.0% from its high and IDXX's +1.0% above its low, will provide insight into the momentum of these stocks and the overall technology sector.
Methodology: All 101 Nasdaq 100 constituents screened. Close prices downloaded from 2026-01-01. Period high = highest close since Jan 1 2026; period low = lowest close since Jan 1 2026. Distance = (current price / period extreme − 1) × 100. Technical indicators computed on up to 1 year of daily OHLCV data.
Disclaimer: For informational purposes only. Not investment advice. Past performance is not indicative of future results.

