Nasdaq 100 2026 YTD Highs & Lows Radar: Cintasoration (CTAS), T-Mobile US (TMUS) and more
MarketsFN Team

Screening all 101 Nasdaq 100 constituents for stocks nearest to their 2026 year-to-date high and their 2026 YTD low. Data as of October 26, 2026. % Realized = total return since Jan 1 2026.
Legend: RSI > 70 = overbought · RSI < 30 = oversold · Green % Realized = positive YTD return · Red = negative.
📈 Nearest to 2026 High
Sectors represented: Technology (4), Industrials (1)
| Ticker | Company | Sector | Price Last | % Realized | 2026 YTD High Date | RSI | % above MA200 | Trend |
|---|---|---|---|---|---|---|---|---|
| CTAS | Cintas Corporation | Industrials | $224.10 | +21.21% | 2026-10-23 | 79.1 | +18.1% | Above MA20, MA50, MA200 |
| ROP | Roper Technologies Inc | Technology | $438.14 | +0.83% | 2026-10-23 | 82.3 | +20.2% | Above MA20, MA50, MA200 |
| TEAM | Atlassian Corporation | Technology | $227.61 | +47.07% | 2026-10-23 | 65.6 | +95.5% | Above MA20, MA50, MA200 |
| ZS | Zscaler Inc | Technology | $255.15 | +15.68% | 2026-10-23 | 73.1 | +53.5% | Above MA20, MA50, MA200 |
| CDW | CDW Corp | Technology | $165.11 | +23.99% | 2026-10-23 | 68.7 | +24.5% | Above MA20, MA50, MA200 |
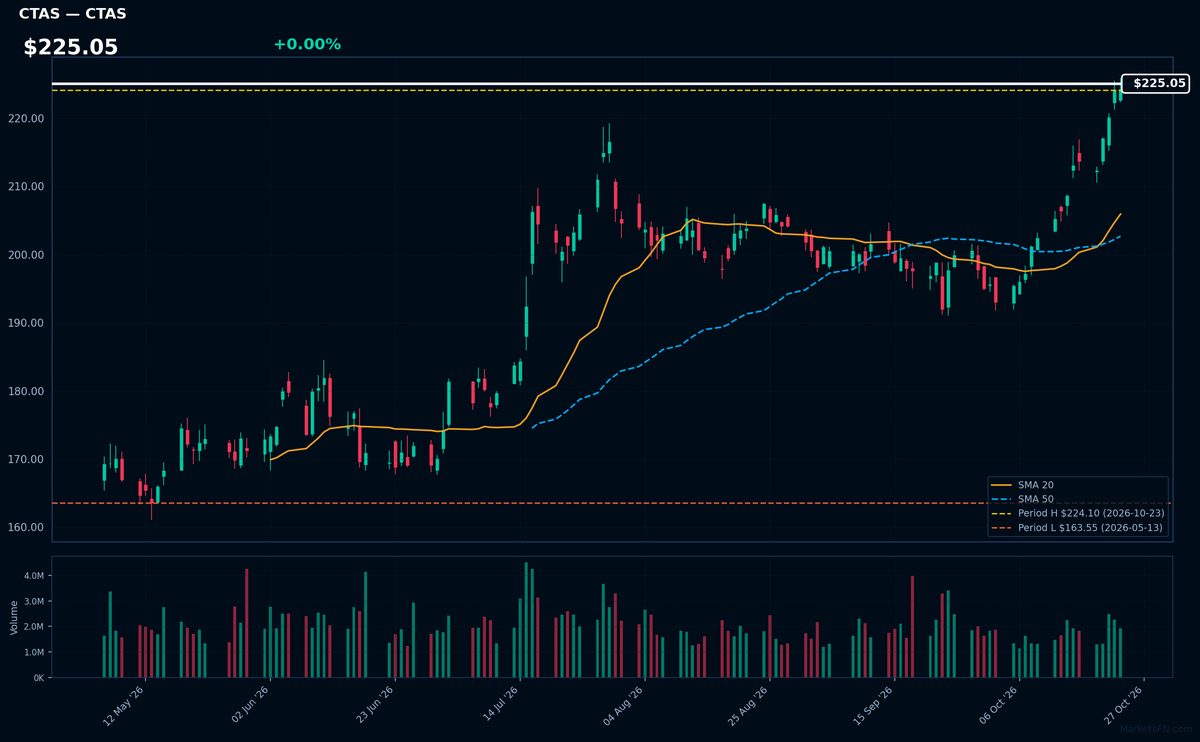
CTAS | Cintas Corporation | Industrials | Price Last: $224.10 | % Realized: +21.21% | RSI: 79.1 | % above MA200: +18.1% | Trend: Above MA20, MA50, MA200
Cintas provides corporate identity uniforms and business services (restroom supplies, first aid, safety products) to over 1 million businesses. Investors care because its recurring revenue model demonstrates resilience across economic cycles, with consistent growth in essential workplace services.
CTAS shows extreme bullish momentum (RSI 79.1, price > MA20 > MA50 > MA200) after a 21.2% YTD surge, now testing all-time highs. The overbought RSI suggests caution despite the clear uptrend.
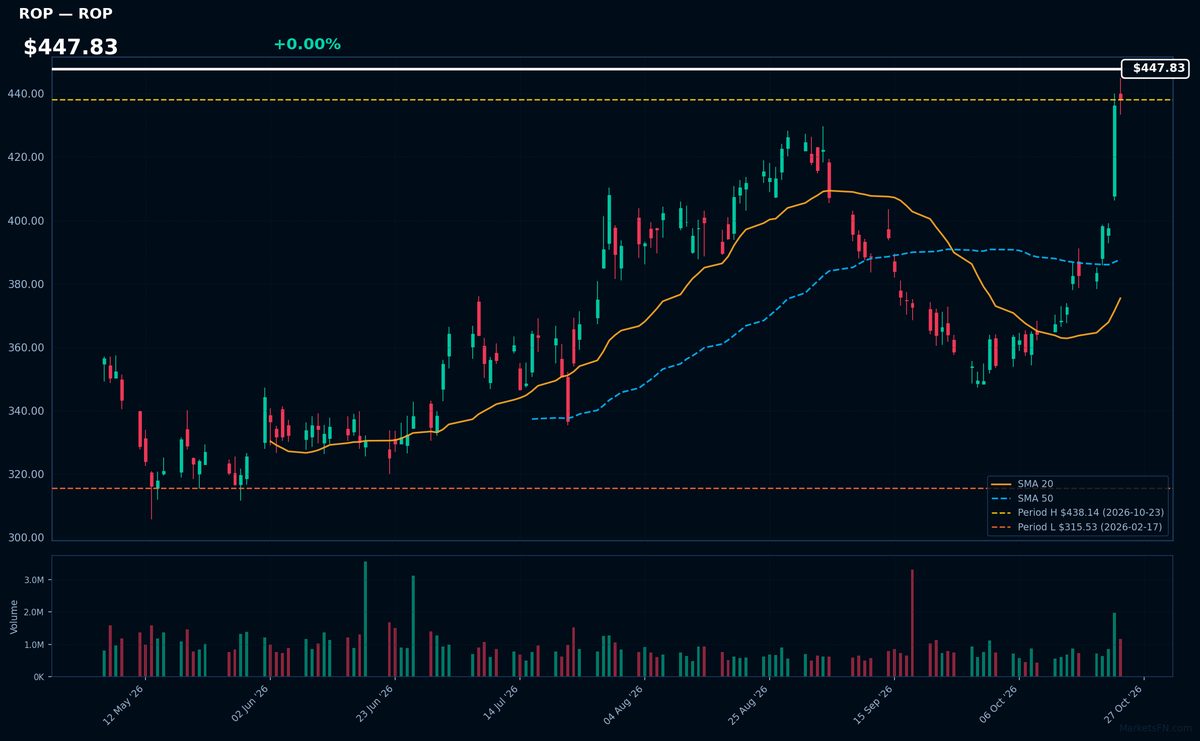
ROP | Roper Technologies Inc | Technology | Price Last: $438.14 | % Realized: +0.83% | RSI: 82.3 | % above MA200: +20.2% | Trend: Above MA20, MA50, MA200
Roper Technologies Inc specializes in niche software, medical, and industrial technology solutions through acquisitions. Investors care for its high-margin, recurring revenue model and disciplined capital allocation in fragmented markets with low customer churn.
ROP trades at $447.83 with extreme RSI(14) of 82.3 (overbought) and mixed MA alignment (above MA20/50/200). Near 2026 YTD highs (+0.8%), this signals stretched momentum—not fundamental strength—with breakout risk.
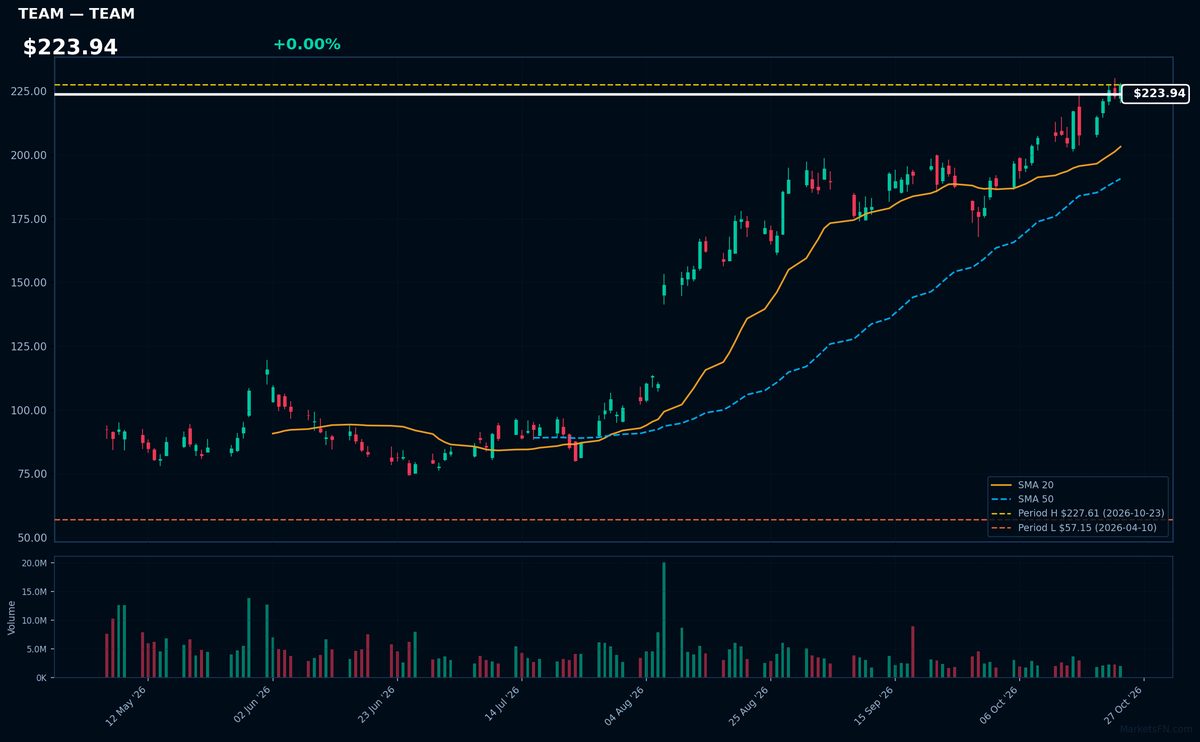
TEAM | Atlassian Corporation | Technology | Price Last: $227.61 | % Realized: +47.07% | RSI: 65.6 | % above MA200: +95.5% | Trend: Above MA20, MA50, MA200
Atlassian provides collaboration software (Jira, Confluence) for agile development teams. Investors care because its tools are mission-critical for software developers, creating sticky enterprise subscriptions with high renewal rates and pricing power in a growing DevOps market.
TEAM shows strong momentum with bullish MA alignment (price>MA20>MA50>MA200) and RSI(14) at 65.6. The stock sits at YTD highs after a 47.1% 2026 gain, suggesting continuation potential but nearing overbought territory.
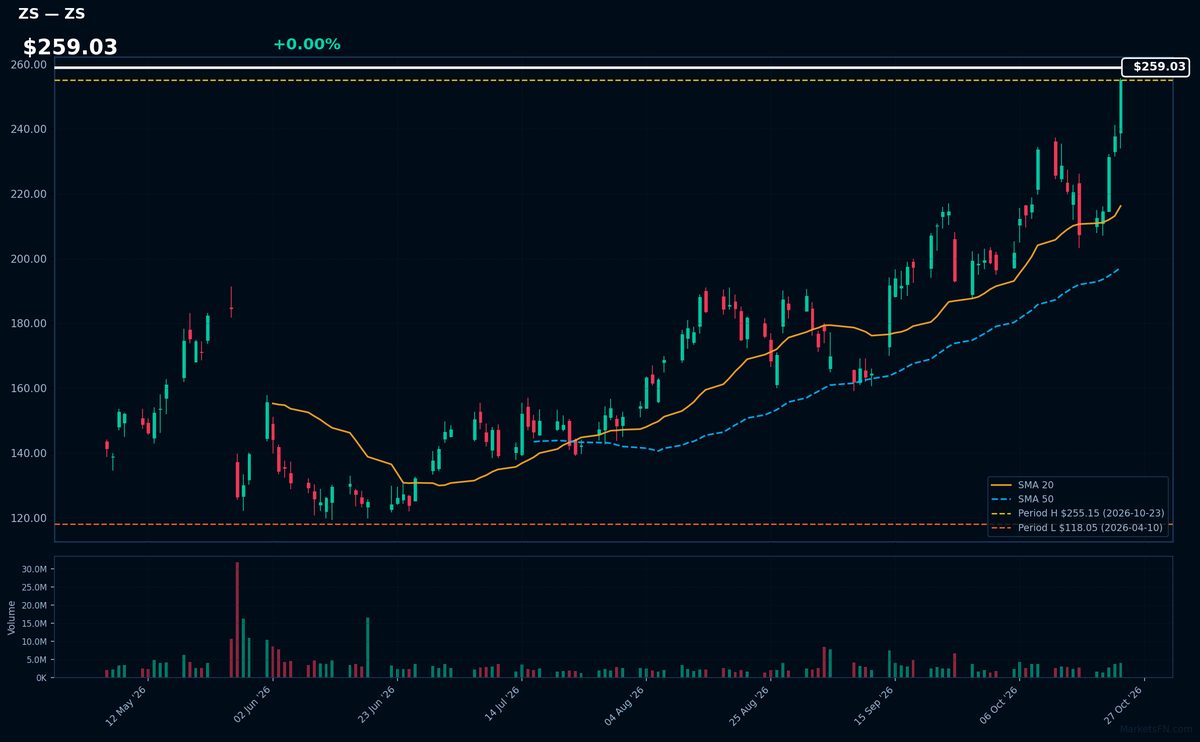
ZS | Zscaler Inc | Technology | Price Last: $255.15 | % Realized: +15.68% | RSI: 73.1 | % above MA200: +53.5% | Trend: Above MA20, MA50, MA200
Zscaler provides cloud-based cybersecurity solutions, replacing legacy firewall hardware with zero-trust network access. Investors care because enterprises are prioritizing cloud security amid rising threats, driving Zscaler's recurring revenue model with 30%+ growth.
Technically overbought (RSI 73.1) but in strong uptrend (price > MA20 > MA50 > MA200). YTD +15.7% and testing YTD highs suggests momentum continuation, though RSI warrants caution.
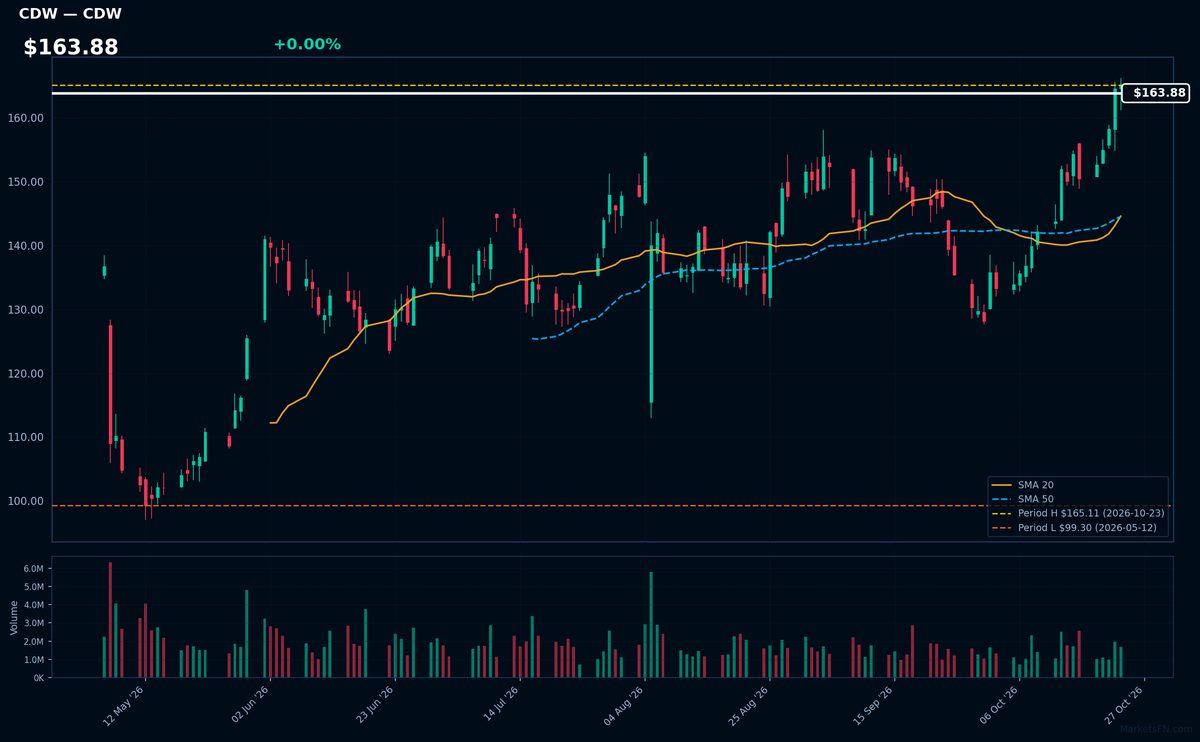
CDW | CDW Corp | Technology | Price Last: $165.11 | % Realized: +23.99% | RSI: 68.7 | % above MA200: +24.5% | Trend: Above MA20, MA50, MA200
CDW Corp is a leading provider of IT solutions to businesses, government, and education, offering hardware, software, and services. Investors care because it's a proxy for corporate tech spending with consistent execution in a fragmented market.
CDW shows strong momentum with bullish MA alignment (price > MA20 > MA50 > MA200) and elevated RSI(14) at 68.7. The stock is testing YTD highs after a 24.0% 2026 gain, suggesting continuation potential but warranting caution near overbought levels.
📉 Nearest to 2026 Low
Sectors represented: Communication Services (3), Industrials (1), Consumer Cyclical (1)
| Ticker | Company | Sector | Price Last | % Realized | 2026 YTD Low Date | RSI | % above MA200 | Trend |
|---|---|---|---|---|---|---|---|---|
| TMUS | T-Mobile US Inc | Communication Services | $146.54 | -26.58% | 2026-10-23 | 35.3 | -22.0% | Below MA20, MA50, MA200 |
| APP | Applovin Corp | Communication Services | $260.25 | -57.91% | 2026-10-23 | 36.0 | -38.6% | Below MA20, MA50, MA200 |
| PCAR | Paccar Inc | Industrials | $106.96 | -4.12% | 2026-10-07 | 33.8 | -11.2% | Below MA20, MA50, MA200 |
| BKNG | Booking Holdings Inc | Consumer Cyclical | $155.83 | -26.82% | 2026-05-15 | 36.0 | -12.5% | Below MA20, MA50, MA200 |
| NFLX | Netflix Inc | Communication Services | $65.85 | -27.63% | 2026-10-21 | 35.6 | -19.8% | Below MA20, MA50, MA200 |
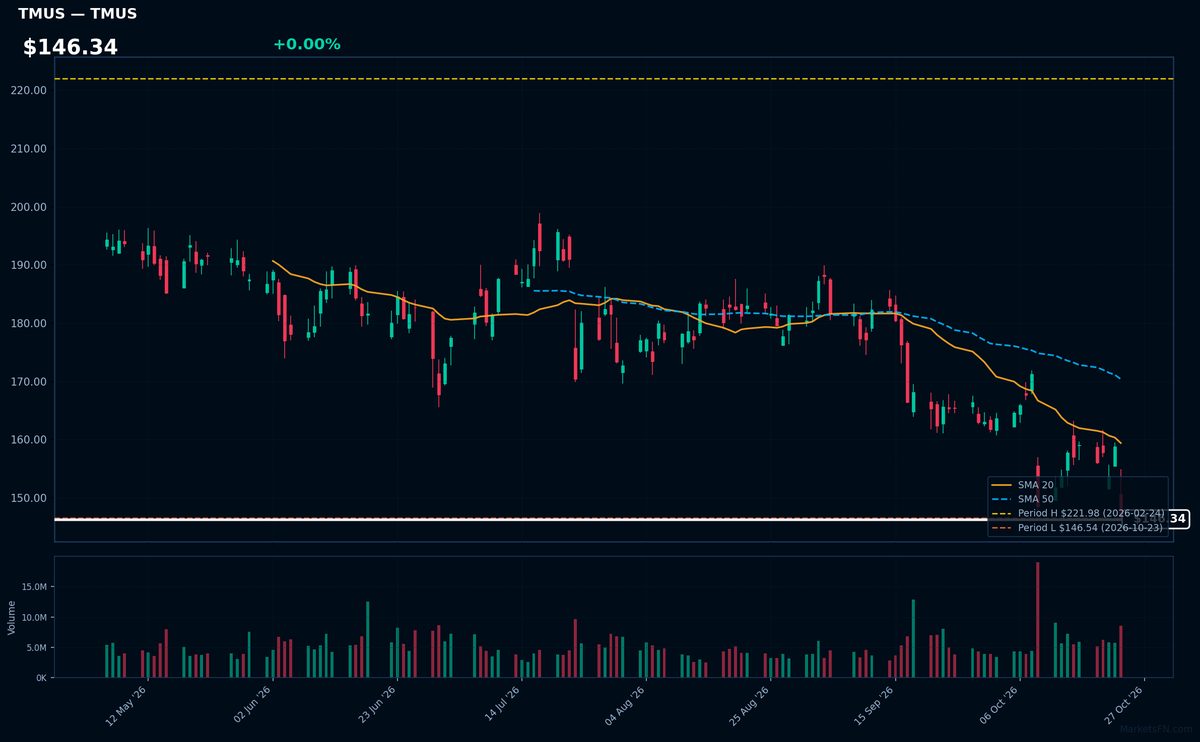
TMUS | T-Mobile US Inc | Communication Services | Price Last: $146.54 | % Realized: -26.58% | RSI: 35.3 | % above MA200: -22.0% | Trend: Below MA20, MA50, MA200
T-Mobile US Inc operates as a major wireless carrier in the U.S., known for aggressive pricing and network expansion. Investors watch TMUS for its competitive positioning in 5G rollout and potential market share gains against Verizon and AT&T.
TMUS shows severe technical weakness: RSI(14) at 35.3 (approaching oversold) with a bearish MA alignment (price < MA20 < MA50 < MA200). The stock tests critical support, down 26.6% YTD — a clear warning sign.
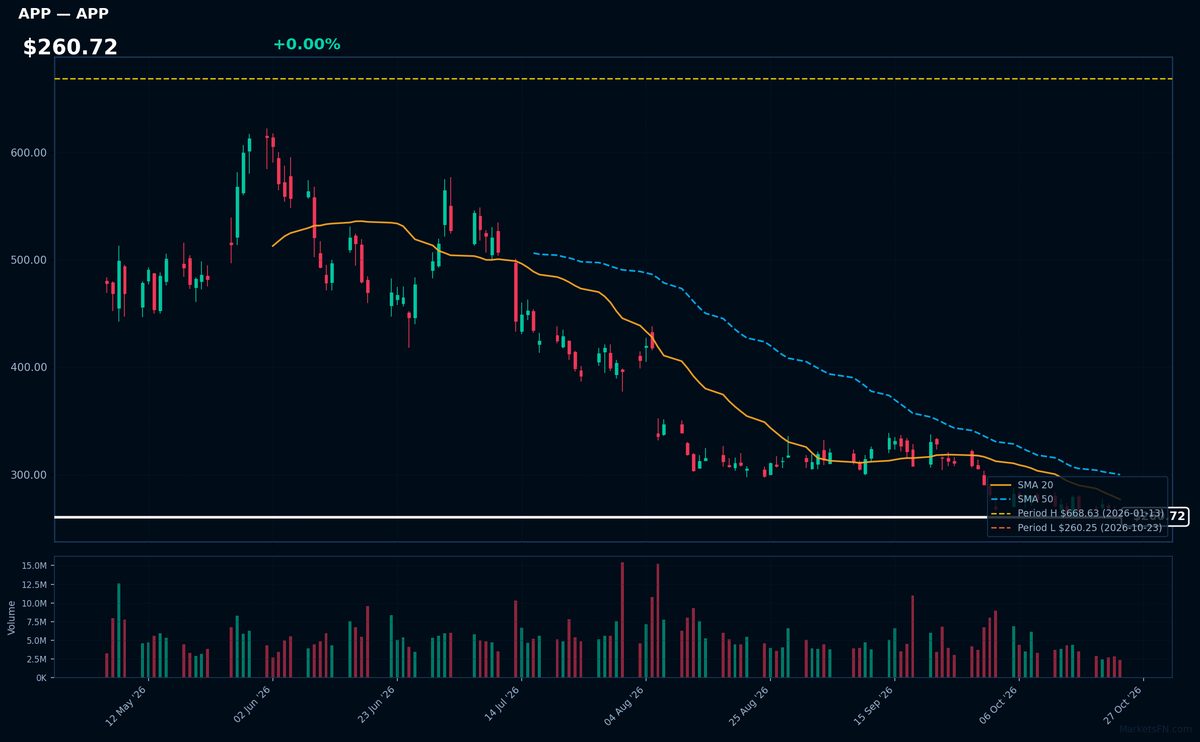
APP | Applovin Corp | Communication Services | Price Last: $260.25 | % Realized: -57.91% | RSI: 36.0 | % above MA200: -38.6% | Trend: Below MA20, MA50, MA200
Applovin Corp operates a mobile app discovery platform and monetization software for developers. Investors should note its role in app ecosystem growth, particularly in gaming and performance advertising, where its AI-driven solutions aim to optimize user acquisition and revenue.
Technically concerning: RSI(14) at 36.0 shows near-oversold conditions, but bearish MA alignment (price < MA20 < MA50 < MA200) confirms sustained downtrend. Stock tests critical support, down 57.9% YTD—clear warning sign.
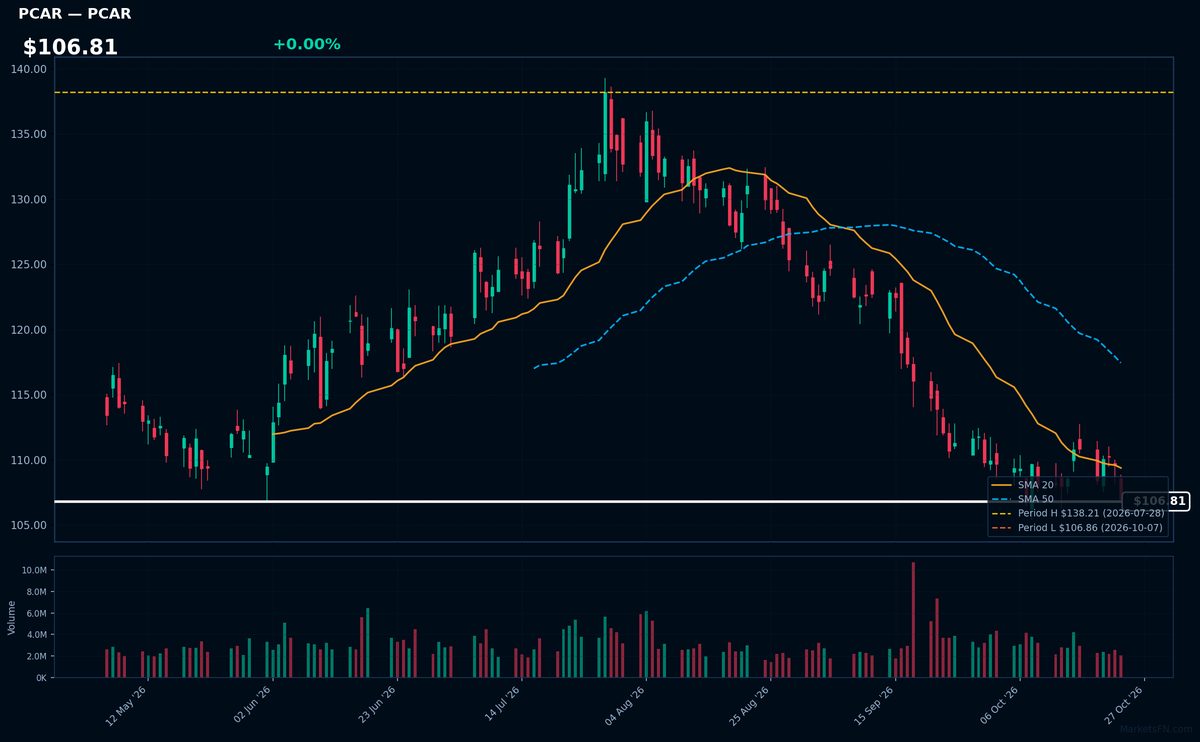
PCAR | Paccar Inc | Industrials | Price Last: $106.96 | % Realized: -4.12% | RSI: 33.8 | % above MA200: -11.2% | Trend: Below MA20, MA50, MA200
Paccar Inc designs/manufactures premium trucks (Kenworth, Peterbilt, DAF) and provides financial services. Investors care due to its cyclical exposure to freight demand, strong brand pricing power in Class 8 trucks, and consistent dividend payouts despite industry volatility.
Technically distressed: RSI(14) at 33.8 shows oversold conditions amid bearish MA alignment (price < MA20 < MA50 < MA200). Trading just 0.1% above YTD lows after -4.1% decline suggests breakdown risk.
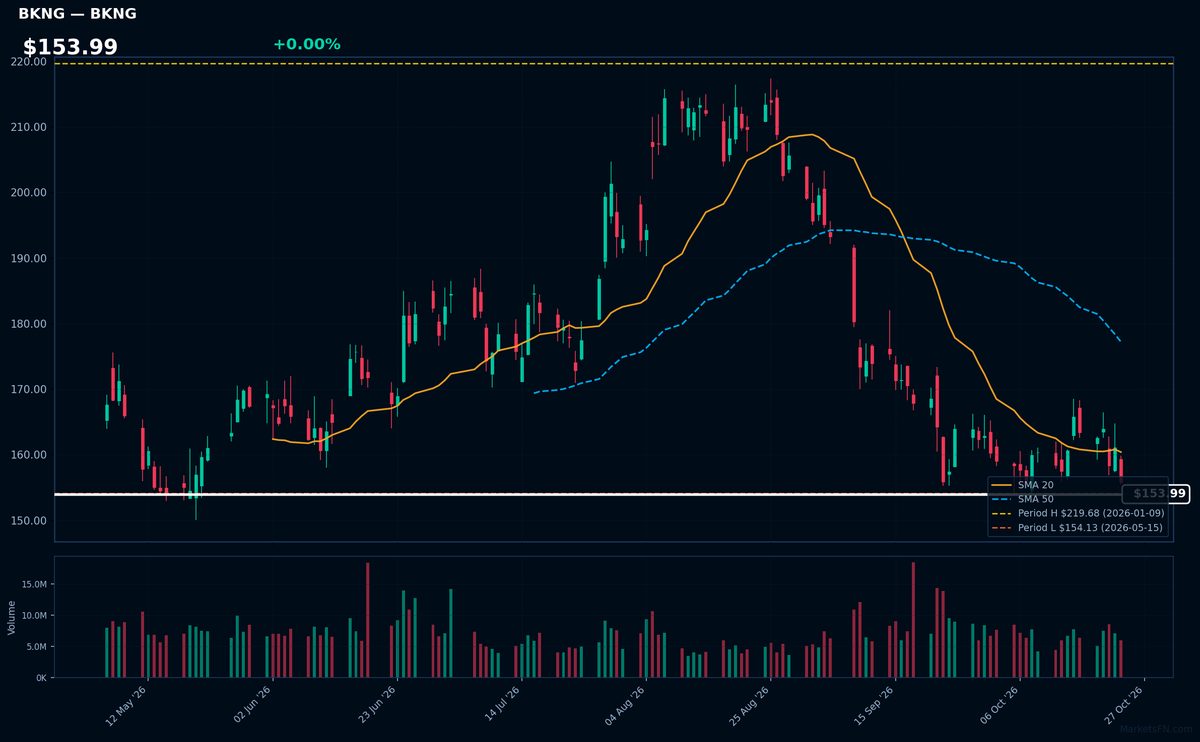
BKNG | Booking Holdings Inc | Consumer Cyclical | Price Last: $155.83 | % Realized: -26.82% | RSI: 36.0 | % above MA200: -12.5% | Trend: Below MA20, MA50, MA200
Booking Holdings operates leading online travel platforms (Booking.com, Priceline, Kayak) connecting travelers with lodging, flights, and rental cars. Investors care because it dominates global online travel with 28% market share and benefits from secular growth in digital travel bookings.
Technically concerning: RSI(14) at 36.0 shows near-oversold conditions amid bearish MA alignment (price < MA20 < MA50 < MA200). Stock tests critical support just 1.1% above YTD lows after -26.8% YTD decline, signaling sustained downtrend.
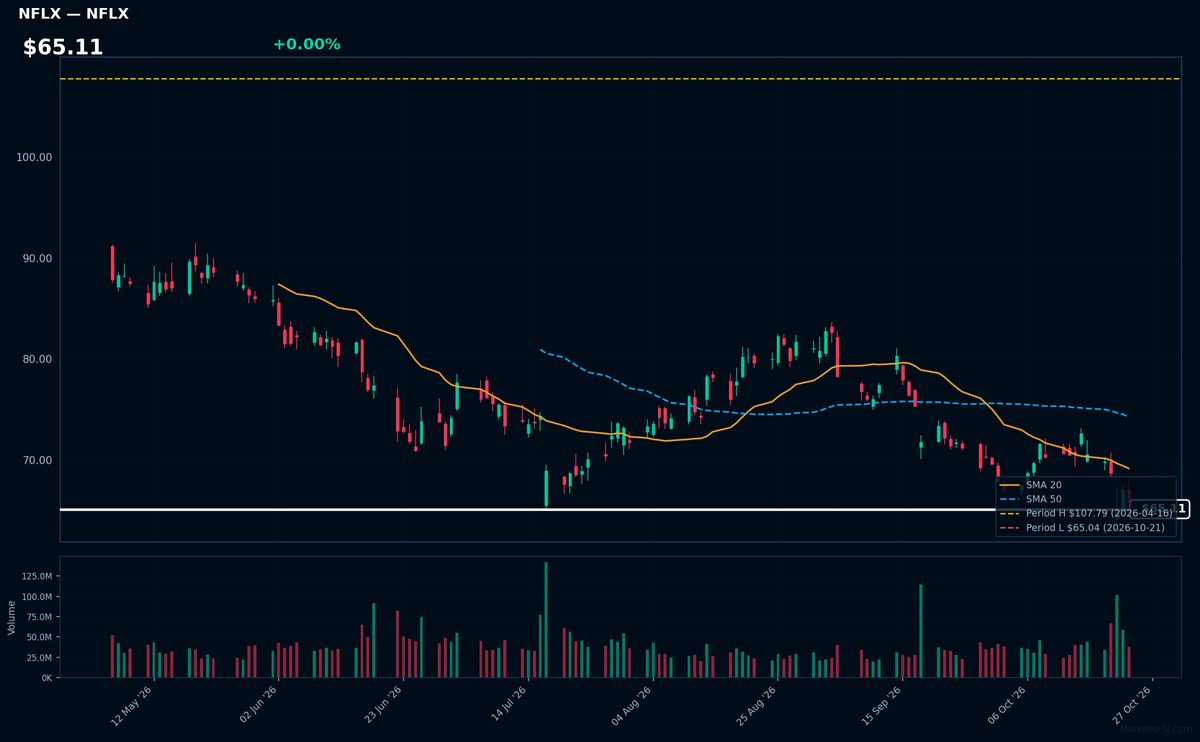
NFLX | Netflix Inc | Communication Services | Price Last: $65.85 | % Realized: -27.63% | RSI: 35.6 | % above MA200: -19.8% | Trend: Below MA20, MA50, MA200
Netflix Inc operates a global streaming platform with 247M subscribers, producing original content while licensing third-party shows. Investors care due to its market leadership in streaming, recurring revenue model, and ability to raise prices (standard plan now $15.49/month).
Netflix shows severe technical weakness: RSI(14) at 35.6 (nearing oversold) with bearish MA alignment (price < MA20 < MA50 < MA200). The stock trades just 1.2% above its 2026 low after a 27.6% YTD decline — testing critical support levels.
Market Commentary
The Nasdaq 100 stocks trading near their 2026 highs—CTAS, ROP, TEAM, ZS, and CDW—reflect sustained investor confidence in enterprise-focused technology and software solutions. These firms benefit from resilient corporate spending on productivity tools (TEAM, ZS), industrial technology (ROP), and IT infrastructure (CDW, CTAS). Conversely, stocks near lows—TMUS, APP, PCAR, BKNG, and NFLX—face sector-specific pressures: TMUS contends with wireless saturation, APP with mobile ad volatility, while cyclical exposure weighs on PCAR and BKNG. NFLX's proximity to lows suggests streaming growth concerns persist.
Macro conditions favor recurring-revenue tech models amid elevated rates, as seen in the outperformance of SaaS (TEAM, ZS) and mission-critical services (CTAS). Weakness in consumer-facing names (NFLX, APP) signals discretionary spending caution, while BKNG’s struggles may reflect travel demand normalization. Industrial tech (ROP) and cybersecurity (ZS) remain insulated due to structural demand, whereas TMUS and PCAR face cyclical or competitive headwinds.
Investors should monitor corporate IT budgets for high-flyers’ sustainability and consumer trends for potential rebounds in laggards. Key catalysts include earnings revisions for CDW/CTAS, mobile ad recovery for APP, and TMUS’s 5G monetization. Technical breaks beyond current extremes—either side—could signal next directional moves.
Methodology: All 101 Nasdaq 100 constituents screened. Close prices downloaded from 2026-01-01. Period high = highest close since Jan 1 2026; period low = lowest close since Jan 1 2026. Distance = (current price / period extreme − 1) × 100. Technical indicators computed on up to 1 year of daily OHLCV data.
Disclaimer: For informational purposes only. Not investment advice. Past performance is not indicative of future results.