Nasdaq 100 2026 YTD Highs & Lows Radar: Apple (AAPL), Paccar (PCAR) and more
MarketsFN Team

Screening all 101 Nasdaq 100 constituents for stocks nearest to their 2026 year-to-date high and their 2026 YTD low. Data as of October 20, 2026. % Realized = total return since Jan 1 2026.
Legend: RSI > 70 = overbought · RSI < 30 = oversold · Green % Realized = positive YTD return · Red = negative.
📈 Nearest to 2026 High
Sectors represented: Technology (2), Consumer Defensive (2), Healthcare (1)
| Ticker | Company | Sector | Price Last | % Realized | 2026 YTD High Date | RSI | % above MA200 | Trend |
|---|---|---|---|---|---|---|---|---|
| AAPL | Apple Inc | Technology | $342.94 | +26.54% | 2026-10-16 | 56.9 | +17.0% | Above MA20, MA50, MA200 |
| KDP | Keurig Dr Pepper Inc | Consumer Defensive | $34.46 | +24.27% | 2026-10-16 | 69.4 | +16.0% | Above MA20, MA50, MA200 |
| CCEP | Coca-Cola Europacific Partners Plc | Consumer Defensive | $111.87 | +26.82% | 2026-10-16 | 73.2 | +12.2% | Above MA20, MA50, MA200 |
| ADP | Automatic Data Processing Inc | Technology | $287.03 | +13.50% | 2026-10-16 | 72.5 | +20.1% | Above MA20, MA50, MA200 |
| BIIB | Biogen Inc | Healthcare | $233.48 | +31.30% | 2026-10-15 | 69.1 | +17.7% | Above MA20, MA50, MA200 |
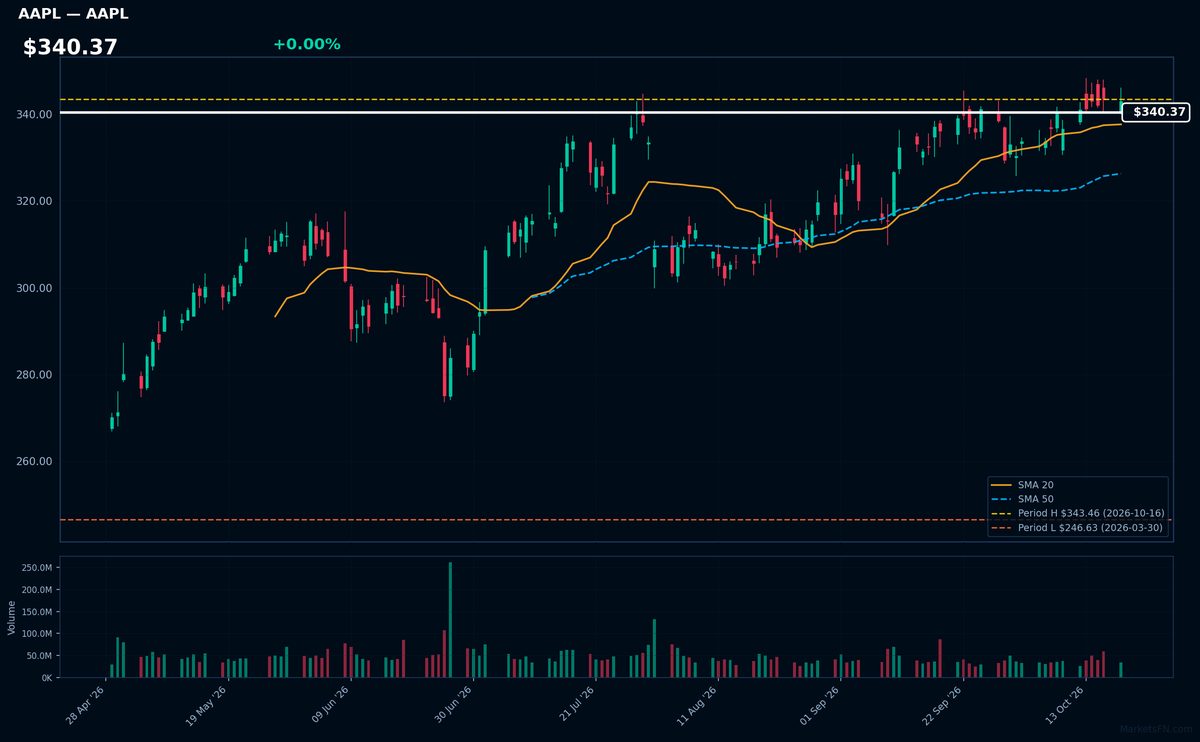
AAPL | Apple Inc | Technology | Price Last: $342.94 | % Realized: +26.54% | RSI: 56.9 | % above MA200: +17.0% | Trend: Above MA20, MA50, MA200
Apple designs premium consumer electronics (iPhone, Mac, wearables) and operates high-margin services (App Store, subscriptions). Investors care about its $340B+ annual revenue, ecosystem loyalty, and cash generation — though growth relies on hardware upgrade cycles and services expansion.
Technically bullish: $340.37 price shows sustained uptrend (MA20>MA50>MA200), RSI 56.9 suggests room before overbought. Stock sits 0.2% below YTD high after 26.5% YTD gain — watching for breakout confirmation.
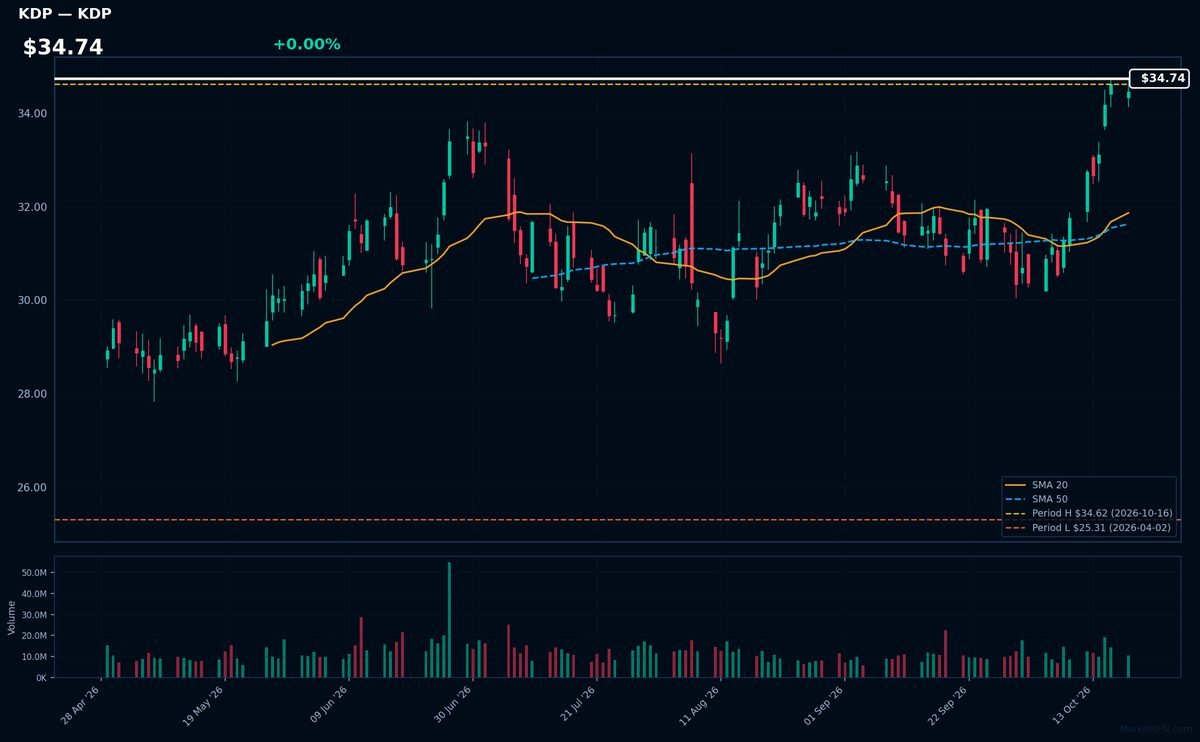
KDP | Keurig Dr Pepper Inc | Consumer Defensive | Price Last: $34.46 | % Realized: +24.27% | RSI: 69.4 | % above MA200: +16.0% | Trend: Above MA20, MA50, MA200
Keurig Dr Pepper Inc operates in beverages, manufacturing single-serve coffee systems (Keurig) and soft drinks (Dr Pepper). Investors care because it combines steady coffee demand with high-margin branded sodas, creating a diversified revenue stream in defensive consumer staples.
Technically bullish: RSI(14) at 69.4 shows strong momentum, with price ($34.74) above MA20>MA50>MA200 in sustained uptrend. Stock is just 0.5% below YTD high after gaining 24.3% in 2026, suggesting breakout potential but nearing overbought territory.
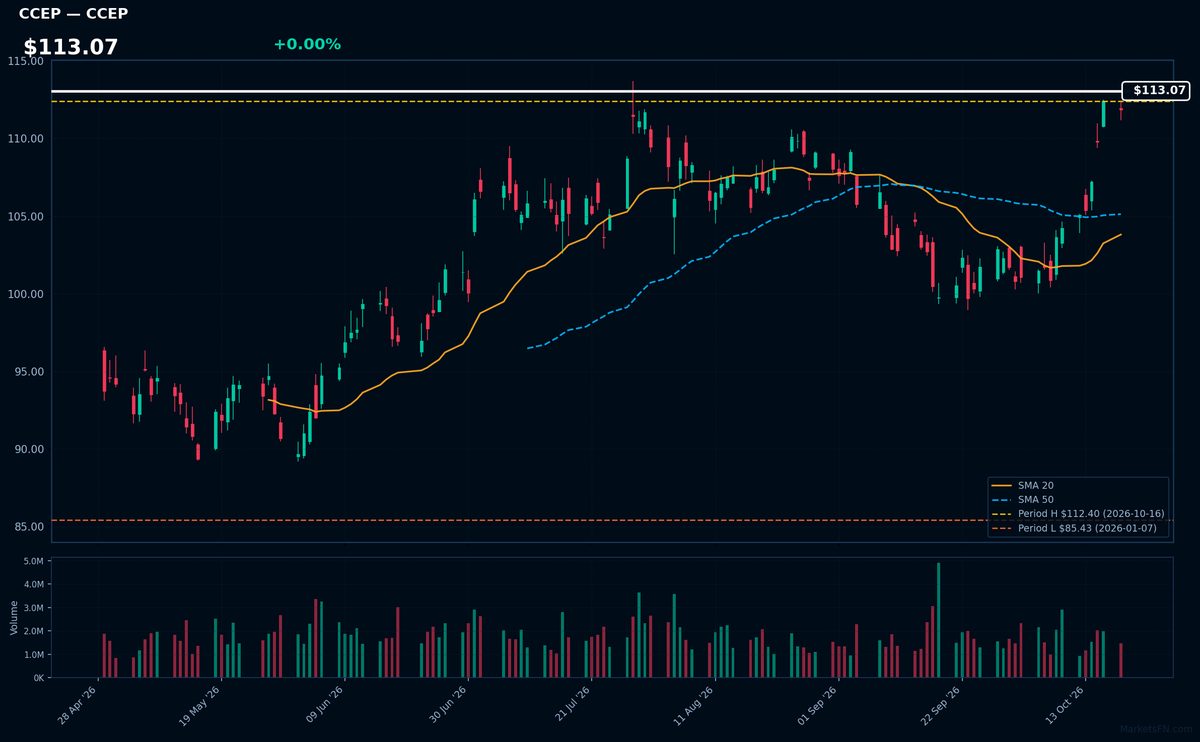
CCEP | Coca-Cola Europacific Partners Plc | Consumer Defensive | Price Last: $111.87 | % Realized: +26.82% | RSI: 73.2 | % above MA200: +12.2% | Trend: Above MA20, MA50, MA200
Coca-Cola Europacific Partners Plc bottles and distributes Coca-Cola products across Europe and Asia-Pacific, operating as a critical link between the brand and regional markets. Investors care because its asset-light model captures steady beverage demand while avoiding capital-intensive syrup production.
At $113.07, CCEP shows momentum (RSI 73.2, above MA20/MA50/MA200) but nears overbought territory, sitting just 0.5% below its 2026 YTD high after a 26.8% YTD gain. Watch for breakout confirmation or pullback.
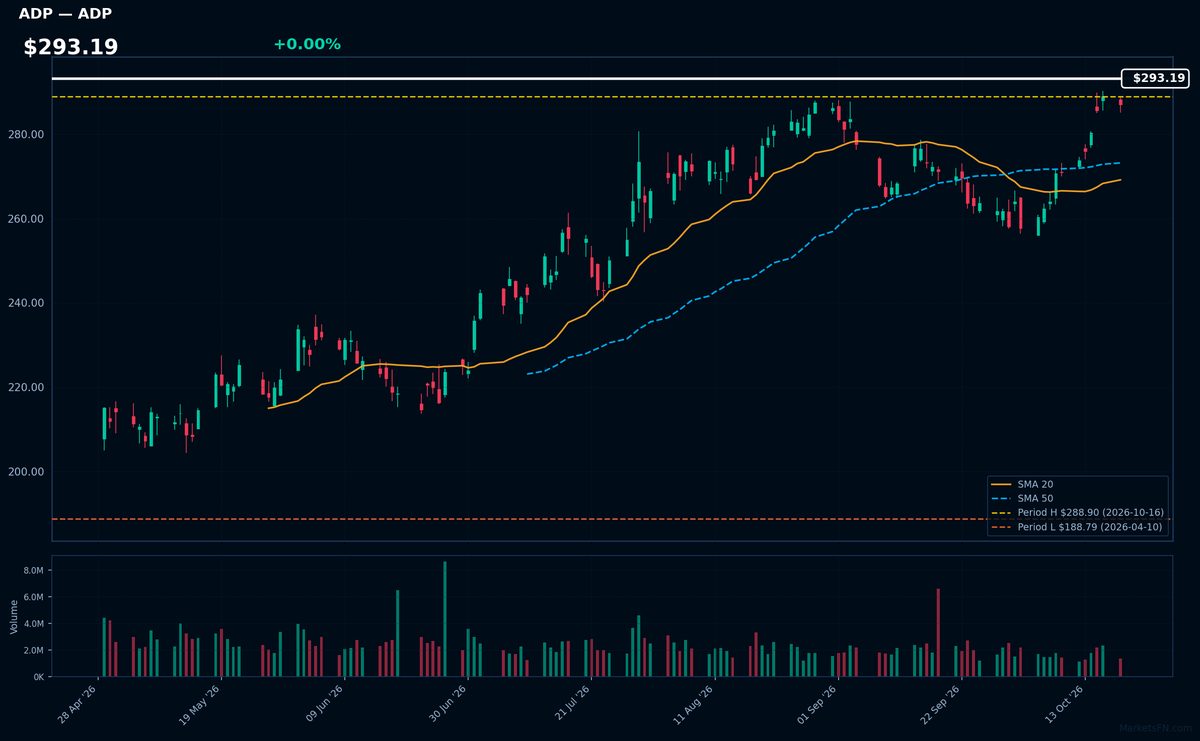
ADP | Automatic Data Processing Inc | Technology | Price Last: $287.03 | % Realized: +13.50% | RSI: 72.5 | % above MA200: +20.1% | Trend: Above MA20, MA50, MA200
Automatic Data Processing Inc (ADP) provides cloud-based HR and payroll solutions for businesses globally. Investors should care because its recurring revenue model and mission-critical services drive stable cash flows, with 13.5% YTD returns in 2026 showing operational resilience in workforce management tech.
ADP trades at $293.19 with an overbought RSI(14) of 72.5, hovering just 0.6% below its YTD high. While the price sits above MA20/MA50/MA200, the mixed signals and extreme proximity suggest caution — this could be either momentum continuation or a near-term reversal point.
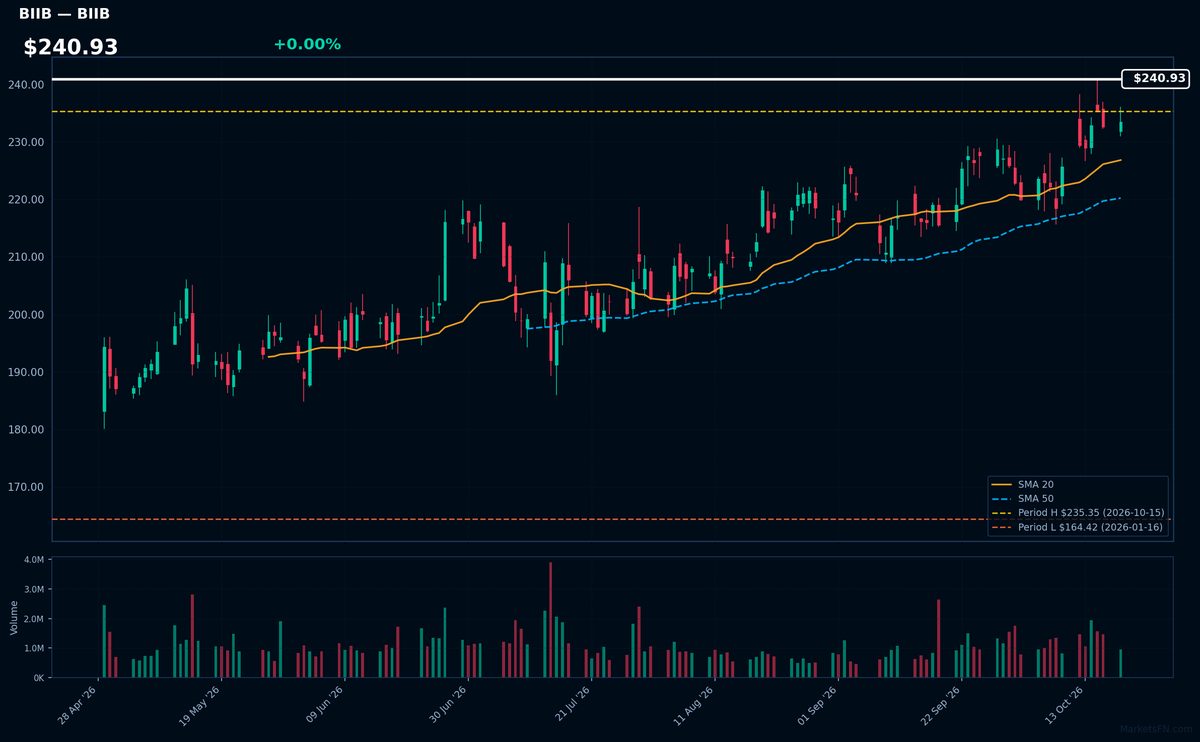
BIIB | Biogen Inc | Healthcare | Price Last: $233.48 | % Realized: +31.30% | RSI: 69.1 | % above MA200: +17.7% | Trend: Above MA20, MA50, MA200
Biogen develops therapies for neurological diseases, including multiple sclerosis drugs like Tecfidera and Alzheimer's treatment Leqembi. Investors care because its neuroscience focus taps into aging populations, though pipeline risks remain high given clinical trial volatility in brain disorders.
Technically bullish with RSI(14) at 69.1 and price > MA20 > MA50 > MA200, testing 2026 highs after 31.3% YTD gains. The sustained uptrend suggests momentum, but RSI nears overbought territory.
📉 Nearest to 2026 Low
Sectors represented: Communication Services (3), Industrials (2)
| Ticker | Company | Sector | Price Last | % Realized | 2026 YTD Low Date | RSI | % above MA200 | Trend |
|---|---|---|---|---|---|---|---|---|
| PCAR | Paccar Inc | Industrials | $108.42 | -2.81% | 2026-10-07 | 36.3 | -10.1% | Below MA20, MA50, MA200 |
| APP | Applovin Corp | Communication Services | $269.12 | -56.48% | 2026-10-14 | 38.7 | -37.6% | Below MA20, MA50, MA200 |
| TTD | Trade Desk Inc | Communication Services | $12.26 | -67.46% | 2026-10-06 | 45.1 | -41.8% | Above MA20 · Below MA50, MA200 |
| NFLX | Netflix Inc | Communication Services | $69.85 | -23.23% | 2026-10-02 | 43.5 | -15.5% | Below MA20, MA50, MA200 |
| HON | Honeywell International Inc | Industrials | $209.98 | +2.21% | 2026-09-14 | 48.8 | -8.9% | Below MA20, MA50, MA200 |
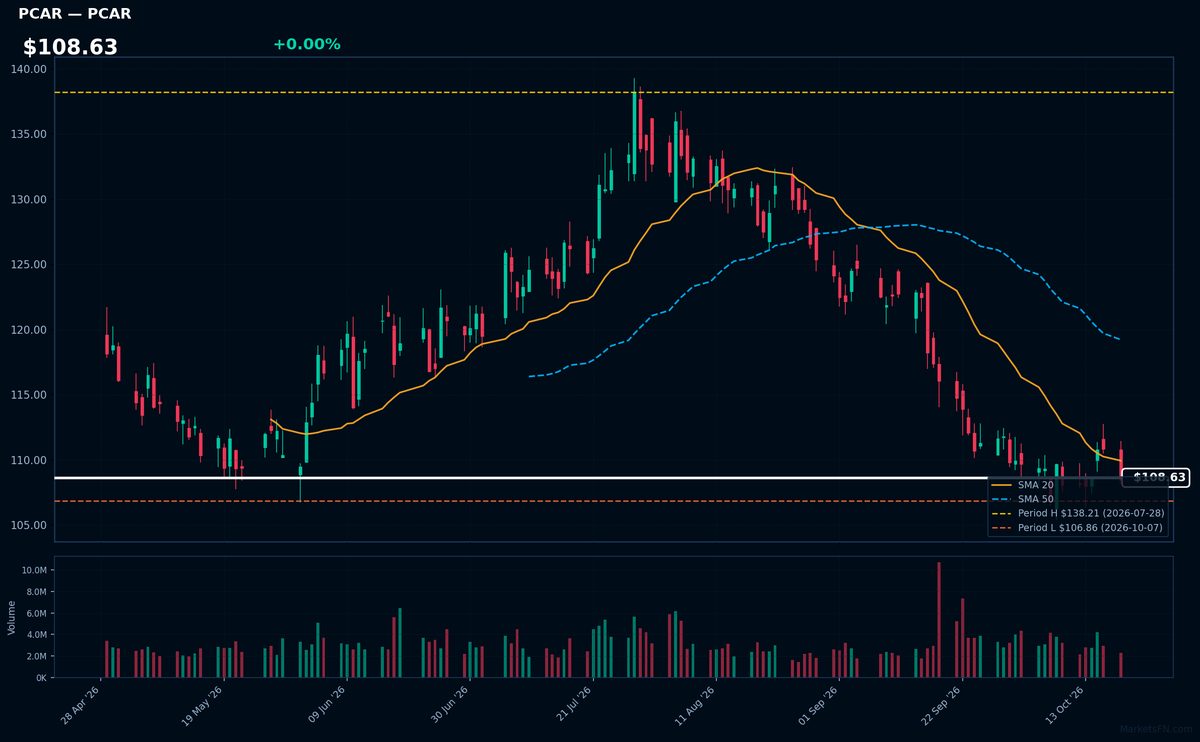
PCAR | Paccar Inc | Industrials | Price Last: $108.42 | % Realized: -2.81% | RSI: 36.3 | % above MA200: -10.1% | Trend: Below MA20, MA50, MA200
Paccar manufactures premium Kenworth, Peterbilt, and DAF trucks, dominating North American Class 8 sales. Investors watch its cyclical exposure to freight demand and pricing power in commercial vehicles, with consistent 15%+ operating margins in strong markets.
Technically concerning: RSI(14) at 36.3 shows weakening momentum amid bearish MA alignment (price < MA20 < MA50 < MA200). Trading just 1.5% above YTD lows signals breakdown risk.
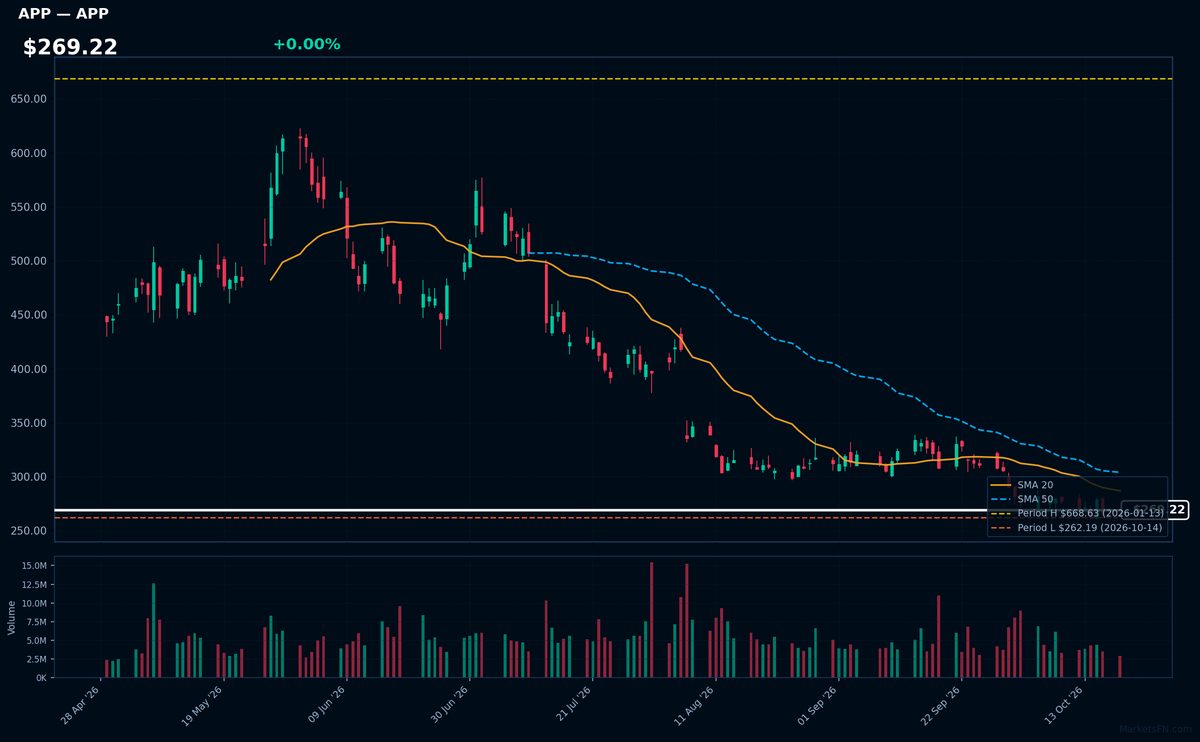
APP | Applovin Corp | Communication Services | Price Last: $269.12 | % Realized: -56.48% | RSI: 38.7 | % above MA200: -37.6% | Trend: Below MA20, MA50, MA200
Applovin operates a mobile advertising platform connecting app developers with advertisers, leveraging AI for ad targeting. Investors should note its exposure to the $400B+ mobile ad market and proprietary machine learning tech that drives higher ad yields for publishers.
Technically distressed with RSI(14) at 38.7 and bearish MA alignment (price < MA20 < MA50 < MA200), testing key support just 2.6% above YTD lows after a 56.5% decline — clear warning sign of sustained downtrend.
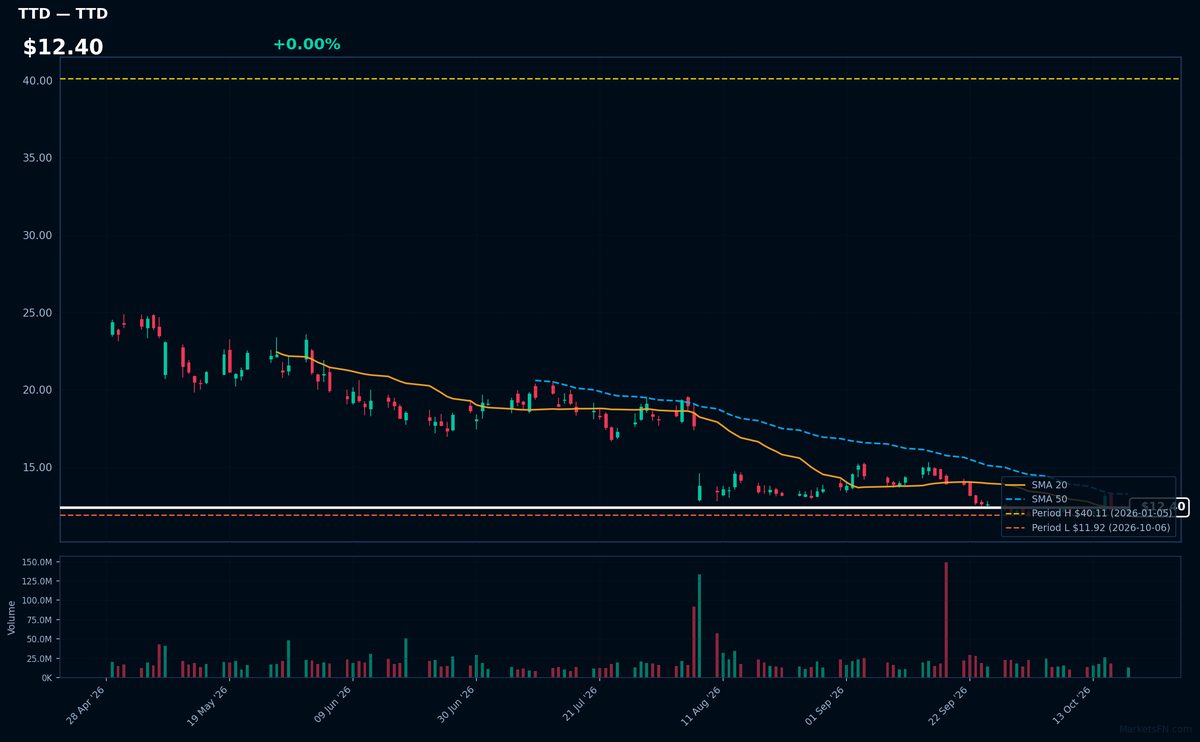
TTD | Trade Desk Inc | Communication Services | Price Last: $12.26 | % Realized: -67.46% | RSI: 45.1 | % above MA200: -41.8% | Trend: Above MA20 · Below MA50, MA200
Trade Desk operates a cloud-based platform for programmatic digital ad buying, enabling precise audience targeting across channels. Investors care because its tech stack dominates the shift from traditional TV ads to data-driven digital campaigns, though recent sector headwinds pressure margins.
At $12.40, TTD tests critical support (2.9% above 2026 lows) with bearish momentum: RSI 45.1 shows neutral sentiment, while mixed MA alignment (above MA20 but below MA50/200) and -67.5% YTD decline signal persistent weakness. Current levels demand caution.
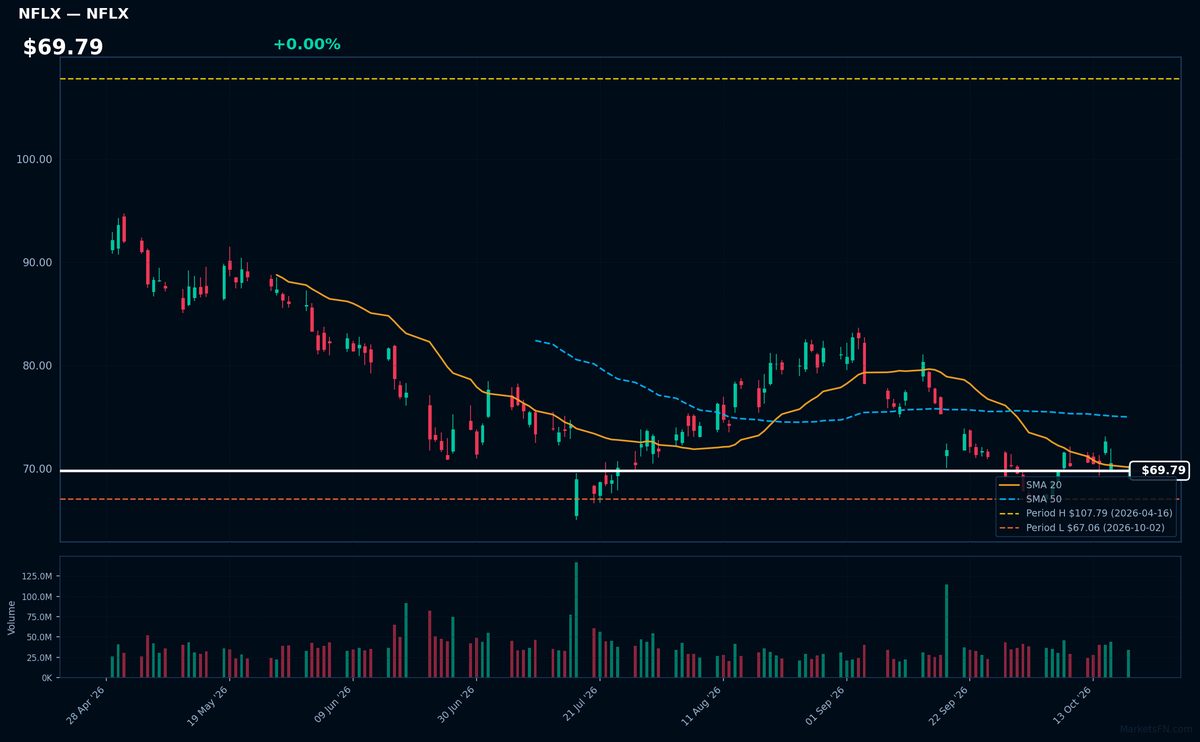
NFLX | Netflix Inc | Communication Services | Price Last: $69.85 | % Realized: -23.23% | RSI: 43.5 | % above MA200: -15.5% | Trend: Below MA20, MA50, MA200
Netflix Inc operates the world's dominant subscription streaming platform, producing original content and licensing third-party shows. Investors care because its global subscriber base and pricing power make it a bellwether for digital entertainment's profitability amid rising competition.
Netflix shows bearish momentum with RSI(14) at 43.5 and sustained downtrend (price < MA20 < MA50 < MA200). Trading just 4.2% above YTD lows after -23.2% decline, this tests critical support — a clear warning sign for technicians.
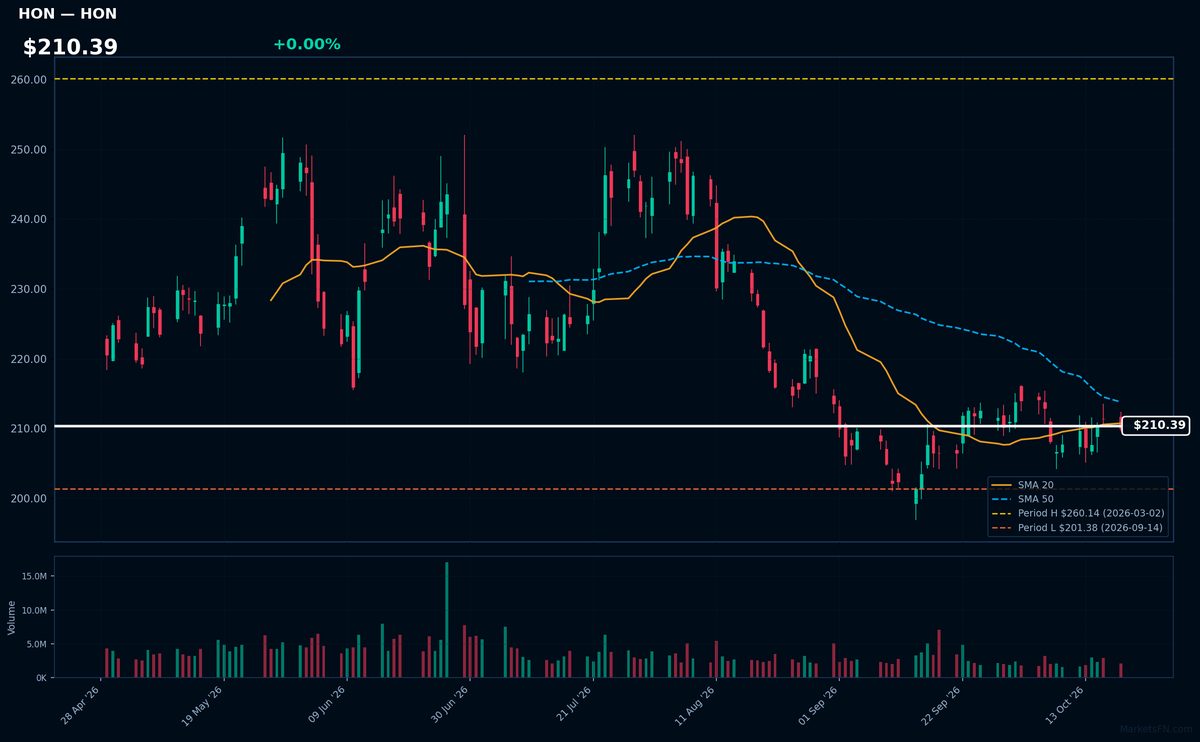
HON | Honeywell International Inc | Industrials | Price Last: $209.98 | % Realized: +2.21% | RSI: 48.8 | % above MA200: -8.9% | Trend: Below MA20, MA50, MA200
Honeywell International Inc operates in aerospace, building technologies, performance materials, and safety solutions, with key products like aircraft engines, automation controls, and industrial chemicals. Investors care for its diversified industrial exposure and consistent cash flows from long-cycle businesses.
Technically concerning — RSI(14) at 48.8 shows neutral momentum, but bearish MA alignment (price < MA20 < MA50 < MA200) and just 4.3% above YTD lows signal sustained downtrend testing support. The 2.2% YTD return underperforms broader markets.
Market Commentary
The Nasdaq 100's 2026 extremes reveal a divergence in tech and consumer-related performance. Apple (-0.2% from high), Keurig Dr Pepper (-0.5%), and Coca-Cola Europacific (-0.5%) hover near highs, signaling defensive demand for stable cash flows, while Paccar (+1.5% above low) and Netflix (+4.2%) languish near lows amid cyclical pressures. This split suggests investors favor predictable earnings over growth-dependent names in uncertain macro conditions.
Persistent inflation and higher-for-longer rates have amplified sector rotation, rewarding resilient cash generators like ADP (-0.6% from high) and Biogen (-0.8%). Meanwhile, ad-tech firms like Trade Desk (+2.9% above low) and AppLovin (+2.6%) face headwinds from soft digital ad spending, while industrial-tech hybrid Honeywell (+4.3%) reflects manufacturing sluggishness. The market is penalizing cyclical exposure and rewarding quality.
Traders should monitor Fed policy signals and earnings revisions for these extremes to hold. A dovish pivot could lift depressed growth stocks (Netflix, Trade Desk), while sticky inflation may extend defensive outperformance (KDP, CCEP). Watch AAPL’s iPhone cycle and BIIB’s Alzheimer’s drug traction for confirmation of their resilience.
Methodology: All 101 Nasdaq 100 constituents screened. Close prices downloaded from 2026-01-01. Period high = highest close since Jan 1 2026; period low = lowest close since Jan 1 2026. Distance = (current price / period extreme − 1) × 100. Technical indicators computed on up to 1 year of daily OHLCV data.
Disclaimer: For informational purposes only. Not investment advice. Past performance is not indicative of future results.