S&P 5005,963+0.54%
NASDAQ21,443+0.87%
DOW43,892+0.31%
DAX23,888+0.44%
FTSE 1008,721-0.12%
EUR/USD1.1465+0.07%
GBP/USD1.3220+0.14%
USD/JPY161.31-0.03%
Gold3,241+0.22%
WTI Oil76.40+0.81%
Bitcoin103,241+1.43%
10Y UST4.47%-9bp
S&P 5005,963+0.54%
NASDAQ21,443+0.87%
DOW43,892+0.31%
DAX23,888+0.44%
FTSE 1008,721-0.12%
EUR/USD1.1465+0.07%
GBP/USD1.3220+0.14%
USD/JPY161.31-0.03%
Gold3,241+0.22%
WTI Oil76.40+0.81%
Bitcoin103,241+1.43%
10Y UST4.47%-9bp
MarketsFN
Forex

Kiwi dollar weakness confirmed by pullback: Technical Analysis

MarketsFN Team

β€’1 min read
Kiwi dollar weakness confirmed by pullback: Technical Analysis

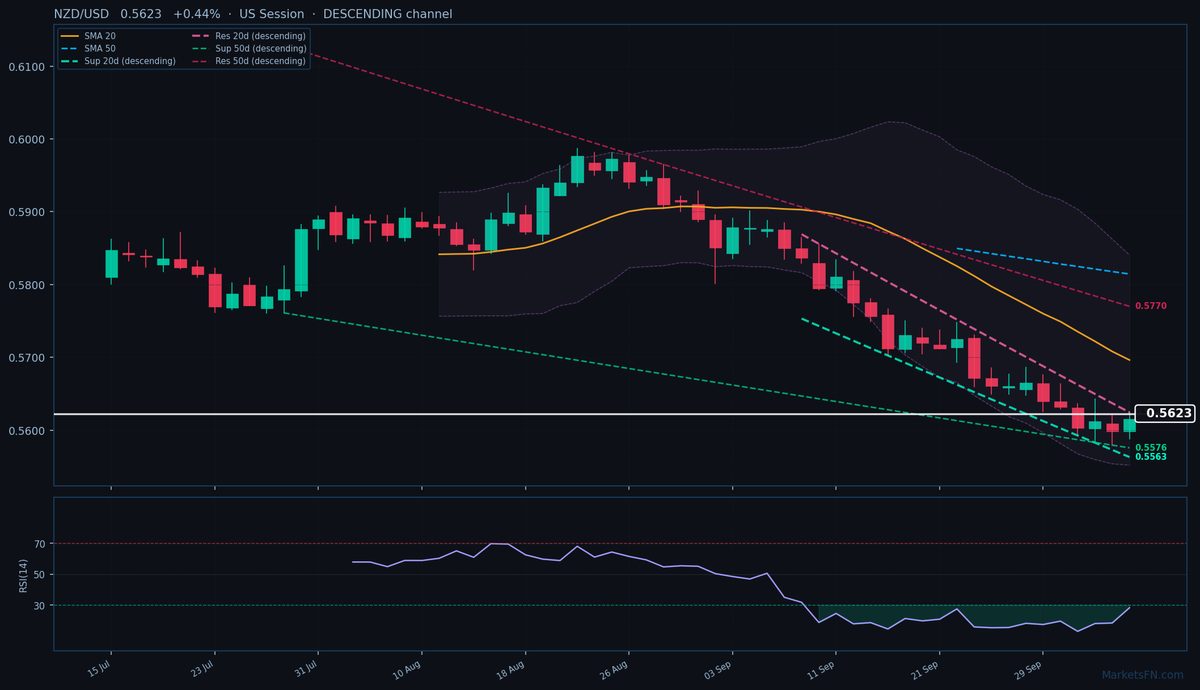
USD/NZD last week broke below the bullish trendline generated last year on October. The pullback then tested the trendline and bearish activity continued this week.

The 50% Fibonacci retracement of the above mentioned bullish trend was almost tested, as NZD/USD is quoting at 0.6046 (- 0.32%) , while the 50% level is at 0.6026.

The true relevant area to assess the direction for the pair is the 61.8% level, at 0.5905. Beneath this area likely to see more severe bearish activity. In case there will be a rebound, a neutral approach would be kept as long that NZD/USD would continue to trade below the most relevant moving averages.

The rate is not oversold yet, with the RSI(14) at 36.79 and tracking volatility (20) is increasing towards its 2023 top.

Related Articles

GBP/USD: Up 0.16% to 1.3650 β€” RSI Signals Overbought
Trending
Forex

GBP/USD: Up 0.16% to 1.3650 β€” RSI Signals Overbought

MarketsFN Team
1 minAug 21, 2026
AUD/USD: Up 0.52% to 0.7148 β€” Bullish β€” Price Above Key MAs
Trending
Forex

AUD/USD: Up 0.52% to 0.7148 β€” Bullish β€” Price Above Key MAs

MarketsFN Team
1 minAug 21, 2026
Fibonacci Retracement Analysis: EUR/USD and USD/CAD Near Key Levels
Trending
Forex

Fibonacci Retracement Analysis: EUR/USD and USD/CAD Near Key Levels

MarketsFN Team
3 minAug 21, 2026