GBP/USD: Up 0.07% to 1.3229 — RSI Signals Oversold
MarketsFN Team
GBP/USD: Up 0.07% to 1.3229 — RSI Signals Oversold
Published: October 06, 2026 · MarketsFN Team
| Pair | Rate | Change | RSI(14) | SMA-20 | SMA-50 | 52W High | 52W Low | Pivot | R1 | S1 |
|---|---|---|---|---|---|---|---|---|---|---|
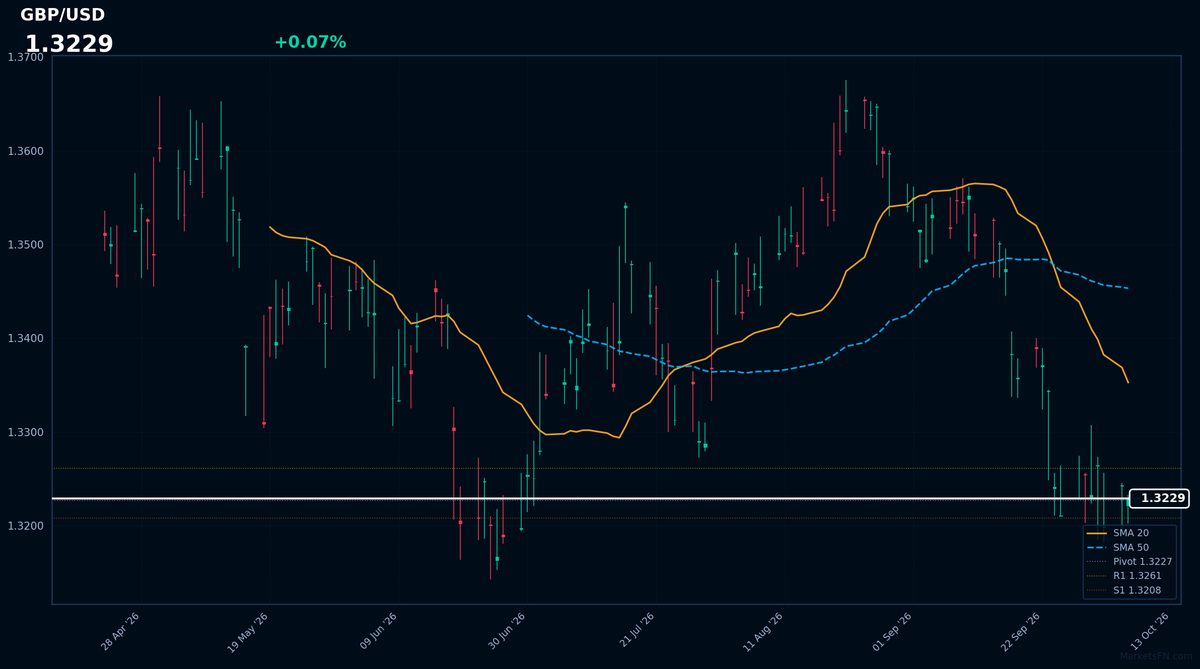
| GBP/USD | 1.3229 | +0.07% | 27.5 | 1.3353 | 1.3453 | 1.3654 | 1.3167 | 1.3227 | 1.3261 | 1.3208 |
GBP/USD is trading at 1.3229 (+0.07%), but this marginal daily gain is a deceptive distraction from a severe bearish regime. The pair is trapped in a clear downtrend, trading significantly below both its SMA-20 of 1.3353 and SMA-50 of 1.3453. While the current rate of 1.3229 sits just above the pivot of 1.3227, the broader technical picture is grim. The RSI(14) has plummeted to 27.5, placing the pair firmly in oversold territory. Market participants are likely underpricing the risk of a technical bounce, as the RSI suggests the selling pressure is becoming overextended despite the prevailing trend.
Volatility remains tight with an ATR(14) of 0.0076, meaning the pair is grinding lower rather than crashing. The immediate battleground is defined by the S1 support at 1.3208 and the R1 resistance at 1.3261. Given that the current price is hovering near the 52-week low of 1.3167, the path of least resistance remains down unless a catalyst triggers a reversal. The market is ignoring the proximity to the 52-week floor in favor of the momentum signaled by the moving averages. A decisive break and close above the R1 level of 1.3261 would invalidate the current bearish conviction and signal the start of a corrective relief rally.
Disclaimer
The content on MarketsFN.com is provided for educational and informational purposes only. It does not constitute financial advice or investment recommendations. All investments involve risks and past performance does not guarantee future results. You are solely responsible for your investment decisions.