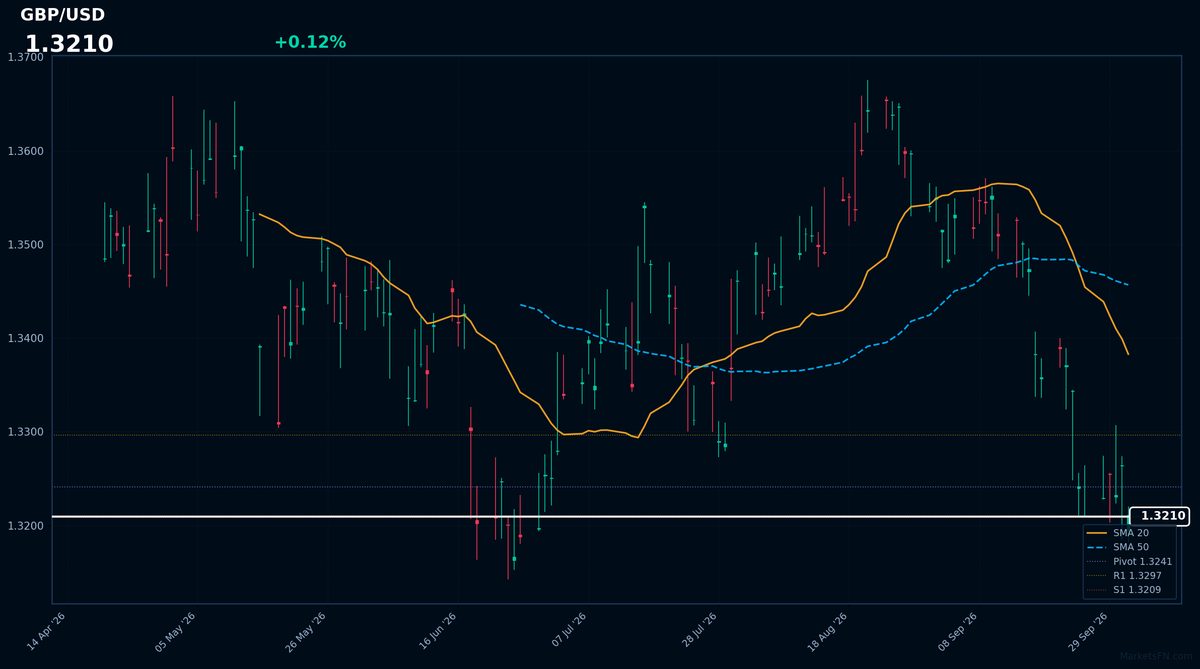
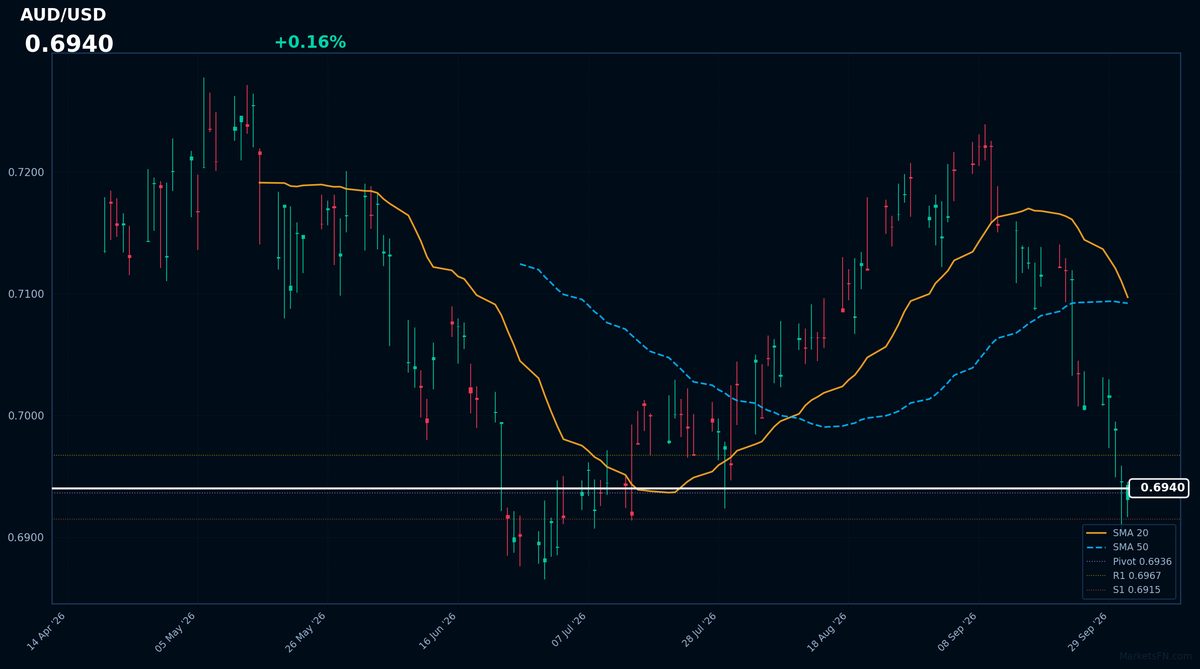
Fibonacci Retracement Analysis: AUD/USD and USD/JPY Near Key Levels
MarketsFN Team
Fibonacci Retracement Analysis: AUD/USD and USD/JPY Near Key Levels
Published: October 02, 2026
Market Overview
The Japanese Yen's safe-haven status is being challenged, as highlighted by Commerzbank, while the dollar's rally has paused ahead of critical payroll data, with the yen strengthening due to robust inflation figures in Tokyo. Meanwhile, WTI oil prices have dipped below $91.00 amid increased supply from the Gulf, and gold is seeing modest gains in a risk-off environment, according to Deutsche Bank, as G20 trade discussions focus on food trade coercion.
AUD/USD - Australian Dollar / U.S. Dollar
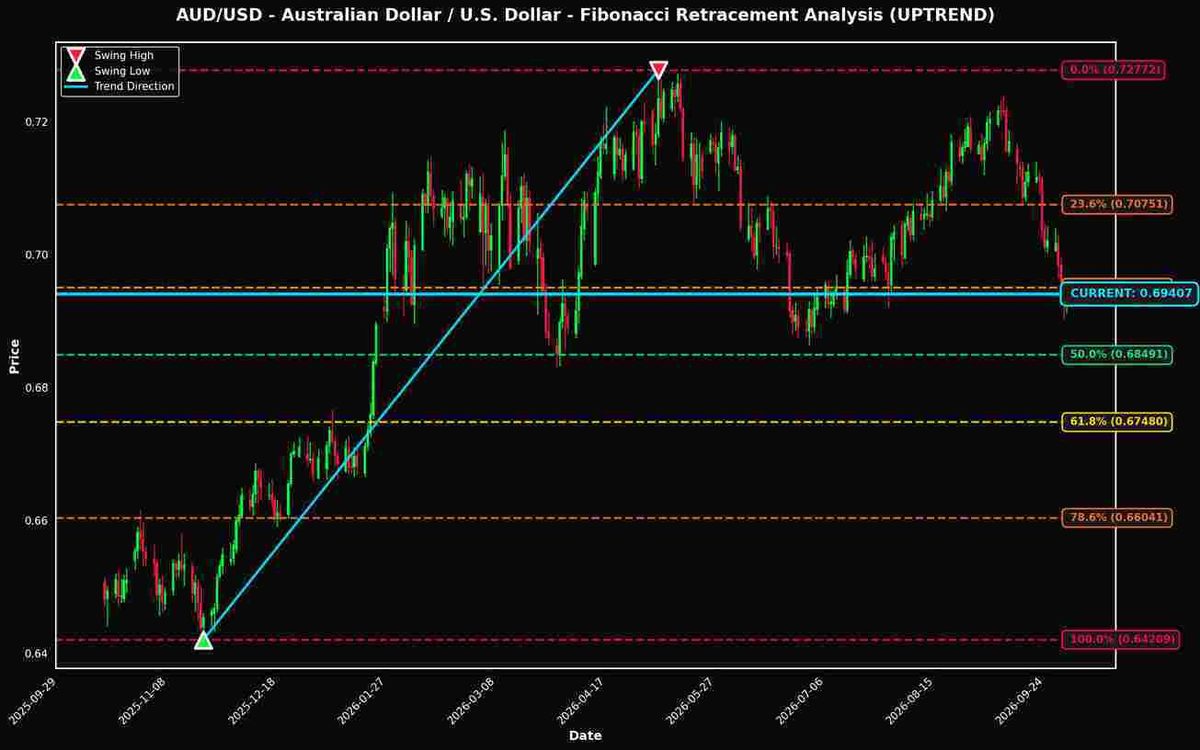
Currently trading at 0.69407 (+0.17% today), AUD/USD is positioned just 0.14% away from the critical 38.2% Fibonacci retracement level, making it a pair to watch closely.

Technical Analysis
### AUD/USD Technical Analysis As of the latest market data, the AUD/USD is trading at 0.69407, indicating a strong uptrend from the recent swing low of 0.64209 to the swing high of 0.72772. The proximity of the current price to the 38.2% Fibonacci retracement level, positioned at 0.69501, is particularly significant as it suggests a potential reversal point or a consolidation phase. Being only 0.14% away from the 38.2% level implies that the market is testing this key Fibonacci zone, which often acts as a robust support level in an uptrend. A successful bounce off this level could reinforce bullish sentiment and attract buyers, leading to a potential rally towards the 23.6% level at 0.70751 and the swing high of 0.72772. Conversely, if the price fails to hold above the 38.2% level, it may signal a bearish retracement towards the 50.0% Fibonacci level at 0.68491. This 50% level is also critical, as it aligns with psychological support, providing additional validation for traders looking to enter long positions if the price dips. Key support zones to monitor include the immediate 38.2% level and the 50.0% level. Resistance is primarily positioned at the 23.6% level (0.70751) and the swing high (0.72772), both of which will be crucial for bullish continuation. In terms of trading implications, traders should consider entering long positions near the 38.2% level if a bullish reversal pattern emerges, with a target towards the 23.6% level. Conversely, a break below the 38.2% level could prompt a reassessment of bullish strategies, with potential stops below the 50.0% level to mitigate risks. In conclusion, watch closely the 0.69501 and 0.68491 levels, as they will provide critical insights into the potential direction of price movement in the near term.
Fibonacci Levels
| Level | Price | Distance | Status |
|---|---|---|---|
| 0.0% | 0.72772 | +0.03365 (+4.85%) | ↑ RESISTANCE |
| 23.6% | 0.70751 | +0.01344 (+1.94%) | ↑ RESISTANCE |
| 38.2% | 0.69501 | +0.00094 (+0.14%) | ↑ RESISTANCE |
| 50.0% | 0.68491 | -0.00916 (-1.32%) | ↓ SUPPORT |
| 61.8% | 0.67480 | -0.01927 (-2.78%) | ↓ SUPPORT |
| 78.6% | 0.66041 | -0.03366 (-4.85%) | ↓ SUPPORT |
| 100.0% | 0.64209 | -0.05198 (-7.49%) | ↓ SUPPORT |
USD/JPY - U.S. Dollar / Japanese Yen
Trading at 157.74300 (-0.20% today), USD/JPY is also showing interesting positioning near the 38.2% level (only 0.42% away).
The USD/JPY currently trades at 157.74300, positioned just 0.42% below the critical 38.2% Fibonacci retracement level at 158.40298. This proximity underscores the significance of the 38.2% level as a potential reversal point in the ongoing uptrend. A sustained breach above this level could signal bullish momentum, potentially targeting the next Fibonacci resistance at 23.6% (160.53604), which is 1.77% higher. Conversely, if the price fails to break above the 38.2% level, it may retrace towards the 50.0% level at 156.67900, which serves as a key support zone. Should the price dip below this support, the next significant level to watch is 61.8% at 154.95502. Traders should monitor these Fibonacci levels closely, as they will provide essential insights into potential reversals and continuation patterns, shaping trading strategies in this trending market.
Fibonacci Levels
| Level | Price | Distance | Status |
|---|---|---|---|
| 0.0% | 163.98400 | +6.24100 (+3.96%) | ↑ RESISTANCE |
| 23.6% | 160.53604 | +2.79304 (+1.77%) | ↑ RESISTANCE |
| 38.2% | 158.40298 | +0.65998 (+0.42%) | ↑ RESISTANCE |
| 50.0% | 156.67900 | -1.06400 (-0.67%) | ↓ SUPPORT |
| 61.8% | 154.95502 | -2.78798 (-1.77%) | ↓ SUPPORT |
| 78.6% | 152.50054 | -5.24246 (-3.32%) | ↓ SUPPORT |
| 100.0% | 149.37400 | -8.36900 (-5.31%) | ↓ SUPPORT |
Key Takeaways
- AUD/USD is positioned near the 38.2% Fibonacci level, a historically significant price zone
- USD/JPY is also testing the 38.2% retracement level
- These Fibonacci levels often act as dynamic support and resistance zones
- Traders should monitor price action at these levels for potential trading opportunities
- Risk management remains crucial when trading near Fibonacci retracement levels
Disclaimer
The content on MarketsFN.com is provided for educational and informational purposes only. It does not constitute financial advice, investment recommendations, or trading guidance. All investments involve risks, and past performance does not guarantee future results. You are solely responsible for your investment decisions and should conduct independent research and consult a qualified financial advisor before acting. MarketsFN.com and its authors are not liable for any losses or damages arising from your use of this information.