GBP/USD: Down 0.24% to 1.3493 — RSI Oversold
MarketsFN Team
GBP/USD: Down 0.24% to 1.3493 — RSI Oversold
Published: September 14, 2026 · MarketsFN Team · US Session
| Pair | Rate | Change | RSI(14) | SMA-20 | SMA-50 | 52W High | 52W Low | Pivot | R1 | S1 |
|---|---|---|---|---|---|---|---|---|---|---|
| GBP/USD | 1.3493 | -0.24% | 28.2 | 1.3556 | 1.3478 | 1.3846 | 1.3019 | 1.3513 | 1.3546 | 1.3492 |
📊 Support & Resistance Levels
Dynamic Trendlines
| Level | Type | Direction | Distance |
|---|---|---|---|
| 1.3441 | 20d Support | ↘ descending | -0.38% / 51.4 pips |
| 1.3543 | 20d Resistance | ↘ descending | +0.37% / 50.0 pips |
| 1.3448 | 50d Support | ↗ ascending | -0.33% / 44.5 pips |
| 1.3745 | 50d Resistance | ↗ ascending | +1.86% / 251.6 pips |
Static Levels
| Level | Type | Touches | Distance |
|---|---|---|---|
| 1.3588 | Resistance | 2× | +0.71% / 95.5 pips |
| 1.3567 | Resistance | 2× | +0.55% / 74.3 pips |
| 1.3507 | Resistance | 2× | +0.10% / 14.0 pips |
| 1.3474 | Support | 2× | -0.14% / 19.2 pips |
| 1.3322 | Support | 2× | -1.27% / 170.7 pips |
| 1.3303 | Support | 2× | -1.41% / 189.7 pips |
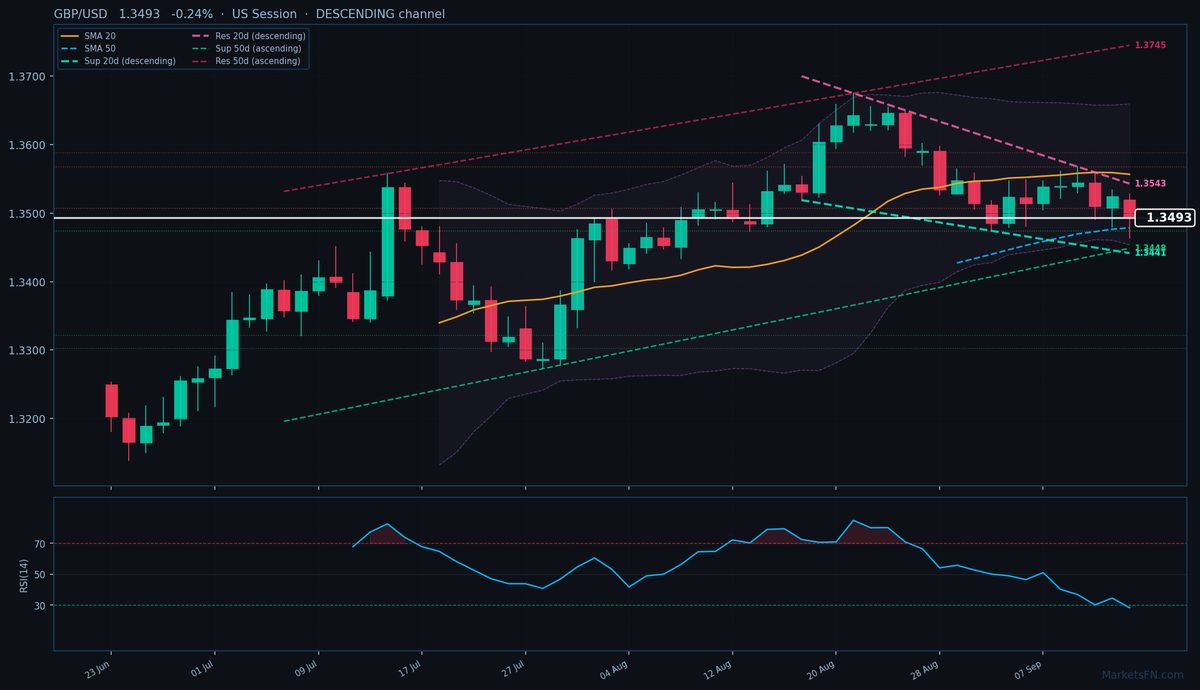
GBP/USD is trading at 1.3493 (-0.24%), caught in a tug-of-war between conflicting technical signals as it consolidates below the SMA-20 (1.3556) but above the SMA-50 (1.3478). The pair is trapped between descending short-term and ascending medium-term dynamic channels, with the 20-day descending resistance at 1.3543 (50.0 pips above) and 50-day ascending support at 1.3448 (44.5 pips below). This compression suggests indecision, though the RSI at 28.2 flags extreme oversold conditions that may limit further downside.
The nearest static levels are S1 at 1.3474 (19.2 pips below) and R1 at 1.3507 (14.0 pips above), both tested twice previously. With the ATR(14) at 0.0053, today’s range of 1.3463–1.3528 aligns with typical volatility, but the failure to hold above the pivot (1.3513) signals bearish near-term bias. The 20-day descending channel dominates price action, but the ascending 50-day support could trigger a reversal if tested.
Short-term, the oversold RSI and proximity to the 50-day SMA suggest a bounce toward 1.3507 (R1) is likely, but sustained selling pressure below 1.3474 (S1) would expose the 50-day dynamic support at 1.3448. A close above the 20-day resistance at 1.3543 is needed to invalidate the bearish channel. Watch today’s US session for momentum shifts — a break above 1.3528 (today’s high) could trigger short-covering toward 1.3546 (pivot R1).
Disclaimer
The content on MarketsFN.com is provided for educational and informational purposes only and does not constitute financial advice. All investments involve risk and past performance does not guarantee future results.