GBP/USD: Down 0.16% to 1.3377 — RSI Overbought
MarketsFN Team
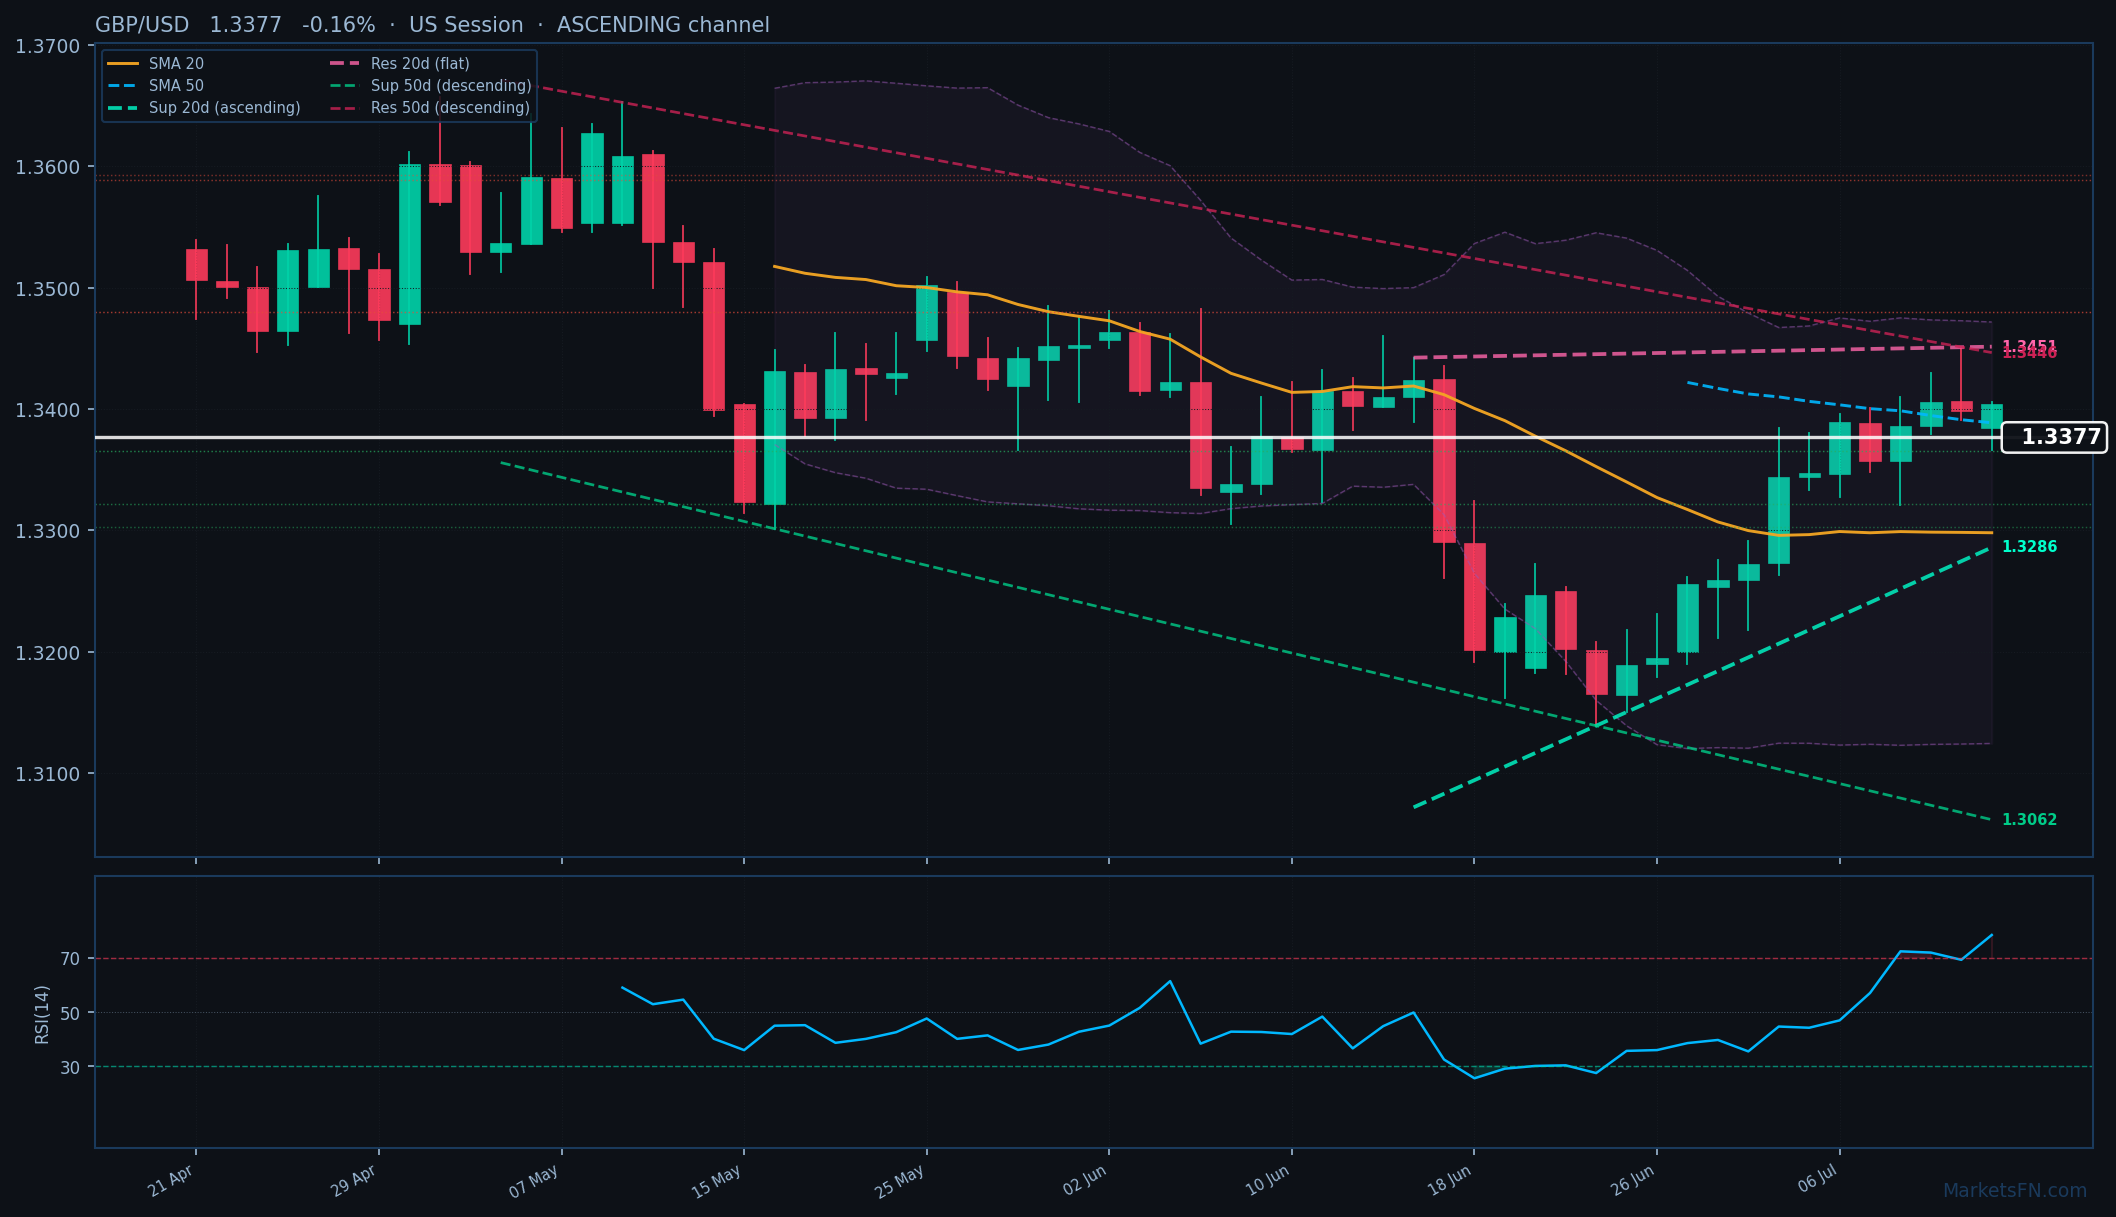
GBP/USD: Down 0.16% to 1.3377 — RSI Overbought
Published: July 13, 2026 · MarketsFN Team · US Session
| Pair | Rate | Change | RSI(14) | SMA-20 | SMA-50 | 52W High | 52W Low | Pivot | R1 | S1 |
|---|---|---|---|---|---|---|---|---|---|---|
| GBP/USD | 1.3377 | -0.16% | 78.4 | 1.3298 | 1.3389 | 1.3846 | 1.3019 | 1.3414 | 1.3436 | 1.3376 |
📊 Support & Resistance Levels
Dynamic Trendlines
| Level | Type | Direction | Distance |
|---|---|---|---|
| 1.3286 | 20d Support | ↗ ascending | -0.68% / 90.5 pips |
| 1.3451 | 20d Resistance | → flat | +0.56% / 74.7 pips |
| 1.3062 | 50d Support | ↘ descending | -2.35% / 314.7 pips |
| 1.3446 | 50d Resistance | ↘ descending | +0.52% / 69.9 pips |
Static Levels
| Level | Type | Touches | Distance |
|---|---|---|---|
| 1.3593 | Resistance | 2× | +1.40% / 188.3 pips |
| 1.3588 | Resistance | 2× | +1.37% / 184.1 pips |
| 1.3480 | Resistance | 2× | +0.57% / 75.9 pips |
| 1.3365 | Support | 2× | -0.29% / 39.2 pips |
| 1.3322 | Support | 2× | -0.61% / 82.1 pips |
| 1.3303 | Support | 2× | -0.75% / 101.1 pips |
GBP/USD is trading at 1.3377 (-0.16%), caught in a consolidation phase between its 20-day SMA (1.3298, bullish) and 50-day SMA (1.3389, bearish), reflecting indecision after the recent rally. The pair is testing the lower bound of its ascending 20-day channel (dynamic support at 1.3286, 90.5 pips below), while facing resistance from a flat 20-day dynamic trendline at 1.3451 (74.7 pips above). The conflicting 50-day descending channel (resistance at 1.3446, 69.9 pips above) adds overhead pressure, suggesting limited upside potential near-term.
Immediate static support sits at 1.3365 (39.2 pips below, tested twice), with a break opening the path to 1.3322 (82.1 pips lower). Resistance is concentrated at R1 (1.3436, 59 pips above), aligning with the dynamic resistance cluster. The RSI at 78.4 flags extreme overbought conditions, increasing vulnerability to a pullback despite the ascending 20-day channel.
The short-term outlook leans bearish for a retest of 1.3365 support, with a decisive break potentially accelerating toward 1.3322. Bulls need a close above the 50-day SMA (1.3389) to challenge R1, though overbought momentum and descending 50-day resistance suggest rallies will be sold. Watch US session flows for confirmation—a hold above 1.3365 could extend consolidation, while a break below triggers the next leg down.
Disclaimer
The content on MarketsFN.com is provided for educational and informational purposes only and does not constitute financial advice. All investments involve risk and past performance does not guarantee future results.


