Fibonacci Retracement Analysis: USD/JPY and AUD/USD Near Key Levels
MarketsFN Team
Fibonacci Retracement Analysis: USD/JPY and AUD/USD Near Key Levels
Published: September 29, 2026
Market Overview
The US dollar remains strong, buoyed by data risks and rising expectations for Federal Reserve rate hikes, reaching a two-month high. Meanwhile, Asian currencies are experiencing mixed performances amid this dollar strength, with anticipation building around the Reserve Bank of Australia's upcoming decision. Additionally, higher Brent oil prices are projected to continue into 2027, which may indirectly influence currency valuations tied to oil-exporting nations.
USD/JPY - U.S. Dollar / Japanese Yen
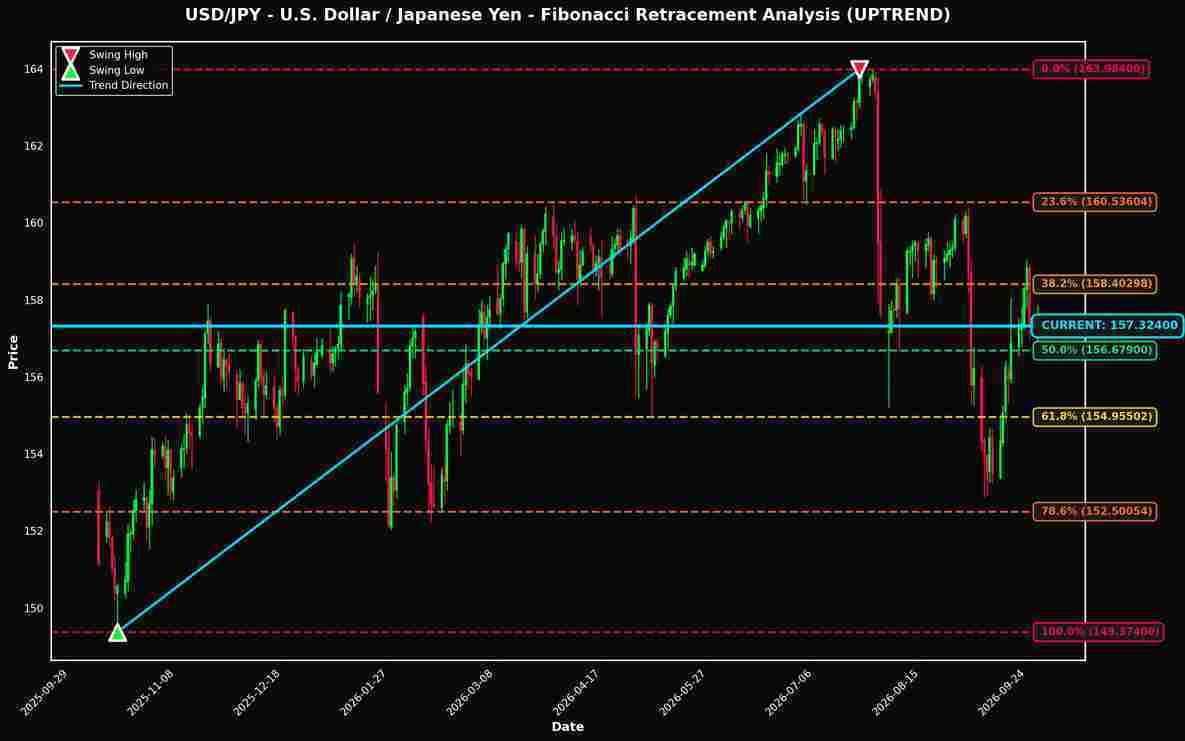
Currently trading at 157.32400 (-0.04% today), USD/JPY is positioned just 0.41% away from the critical 50.0% Fibonacci retracement level, making it a pair to watch closely.

Technical Analysis
**Technical Analysis of USD/JPY Using Fibonacci Retracement Levels** As of the latest market data, USD/JPY is trading at 157.32400 within an established uptrend. The significant swing high is at 163.98400, while the swing low is recorded at 149.37400. Analyzing the Fibonacci retracement levels derived from these points offers critical insights into the current market dynamics. Currently, the price is positioned just above the 50.0% retracement level at 156.67900, with a mere 0.41% distance from this key level. The proximity to the 50.0% retracement indicates a critical juncture for traders, as this level often acts as a strong support in uptrends. A bounce off this level could signify continued bullish momentum, while a breach below could suggest a potential reversal or deeper retracement. Key Fibonacci levels to monitor include the 38.2% level at 158.40298, which may serve as an immediate resistance. Should the price advance beyond this point, the next notable resistance is the 23.6% level at 160.53604. Conversely, should the price decline, the 61.8% level at 154.95502 presents a crucial support zone, further reinforcing the bullish narrative if held. In terms of trading implications, a sustained hold above the 50.0% level could offer a favorable entry for long positions, targeting the 38.2% and potentially the 23.6% levels as profit-taking zones. Conversely, a failure to maintain above the 50.0% level could encourage short positions, with the 61.8% level as a key target for profit. Traders should remain vigilant around the 50.0% Fibonacci retracement level at 156.67900, observing price action for potential bullish or bearish signals. Maintaining awareness of these Fibonacci levels will be crucial for navigating potential price movements in the USD/JPY pair.
Fibonacci Levels
| Level | Price | Distance | Status |
|---|---|---|---|
| 0.0% | 163.98400 | +6.66000 (+4.23%) | ↑ RESISTANCE |
| 23.6% | 160.53604 | +3.21204 (+2.04%) | ↑ RESISTANCE |
| 38.2% | 158.40298 | +1.07898 (+0.69%) | ↑ RESISTANCE |
| 50.0% | 156.67900 | -0.64500 (-0.41%) | ↓ SUPPORT |
| 61.8% | 154.95502 | -2.36898 (-1.51%) | ↓ SUPPORT |
| 78.6% | 152.50054 | -4.82346 (-3.07%) | ↓ SUPPORT |
| 100.0% | 149.37400 | -7.95000 (-5.05%) | ↓ SUPPORT |
AUD/USD - Australian Dollar / U.S. Dollar
Trading at 0.69873 (-0.48% today), AUD/USD is also showing interesting positioning near the 38.2% level (only 0.53% away).
The current price of AUD/USD at 0.69873 is positioned just above the 38.2% Fibonacci retracement level at 0.69501, which is a critical area for maintaining bullish momentum. Being only 0.53% away from this key level indicates a potential support zone; a bounce off this level could further reinforce the uptrend initiated from the swing low of 0.64209. Key resistance is seen at the 23.6% level at 0.70751, which is +1.26% above the current price. Should price action rally past this level, it may attract additional buying pressure, targeting the swing high of 0.72772 (+4.15%). Conversely, if the price breaches the 38.2% level, the next significant support would be the 50.0% level at 0.68491 (-1.98%). Traders should watch these levels closely, as a sustained hold above 0.69501 indicates bullish potential, while a drop below this level could signal a shift in trend.
Fibonacci Levels
| Level | Price | Distance | Status |
|---|---|---|---|
| 0.0% | 0.72772 | +0.02899 (+4.15%) | ↑ RESISTANCE |
| 23.6% | 0.70751 | +0.00878 (+1.26%) | ↑ RESISTANCE |
| 38.2% | 0.69501 | -0.00372 (-0.53%) | ↓ SUPPORT |
| 50.0% | 0.68491 | -0.01382 (-1.98%) | ↓ SUPPORT |
| 61.8% | 0.67480 | -0.02393 (-3.42%) | ↓ SUPPORT |
| 78.6% | 0.66041 | -0.03832 (-5.48%) | ↓ SUPPORT |
| 100.0% | 0.64209 | -0.05664 (-8.11%) | ↓ SUPPORT |
Key Takeaways
- USD/JPY is positioned near the 50.0% Fibonacci level, a historically significant price zone
- AUD/USD is also testing the 38.2% retracement level
- These Fibonacci levels often act as dynamic support and resistance zones
- Traders should monitor price action at these levels for potential trading opportunities
- Risk management remains crucial when trading near Fibonacci retracement levels
Disclaimer
The content on MarketsFN.com is provided for educational and informational purposes only. It does not constitute financial advice, investment recommendations, or trading guidance. All investments involve risks, and past performance does not guarantee future results. You are solely responsible for your investment decisions and should conduct independent research and consult a qualified financial advisor before acting. MarketsFN.com and its authors are not liable for any losses or damages arising from your use of this information.