FX Morning Briefing — Tue 29 Sep 2026: USD/MXN Rallies 1.31% as European Session Opens
MarketsFN FX Desk

European markets open on Tuesday 29 September 2026 with G10 FX showing mixed signals as the Asian session wraps up and traders position for Friday's US afternoon data. The top movers overnight are USD/MXN (+1.31%), USD/ZAR (+0.68%), USD/NOK (+0.58%). The US Dollar Index (DXY) reflects accumulated Fed rate-cut expectations, with risk-sensitive currencies responding to equity futures and commodity prices in early London trade.
The European morning calendar is light — German and Spanish CPI finals confirm the disinflationary trend — before the key risk event arrives in the US session: University of Michigan Consumer Sentiment (preliminary September) at 16:00 UTC. A beat would support USD broadly; a miss would renew pressure on USD/JPY near its 2026 floor and push EUR/USD back toward its 52-week high. Norges Bank's hawkish hold continues to anchor NOK outperformance, while exotic pairs trade in tight ranges ahead of the weekly close.
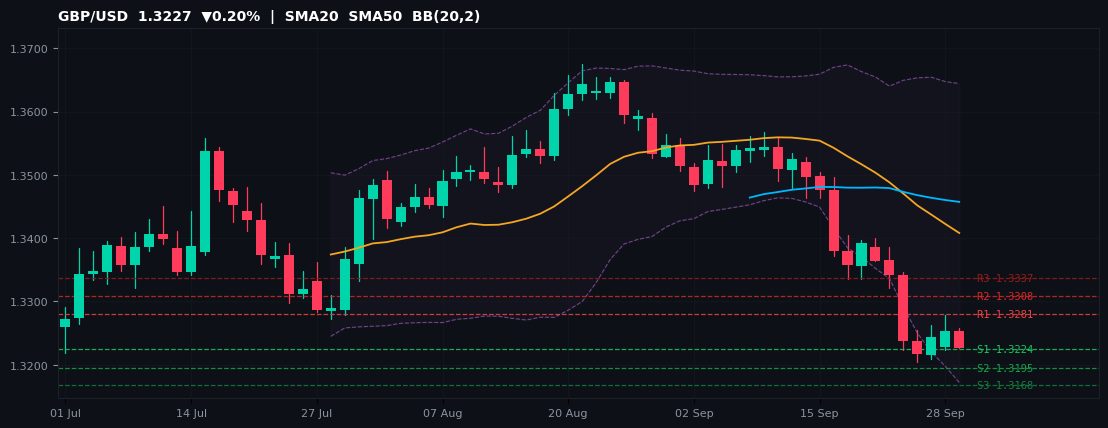
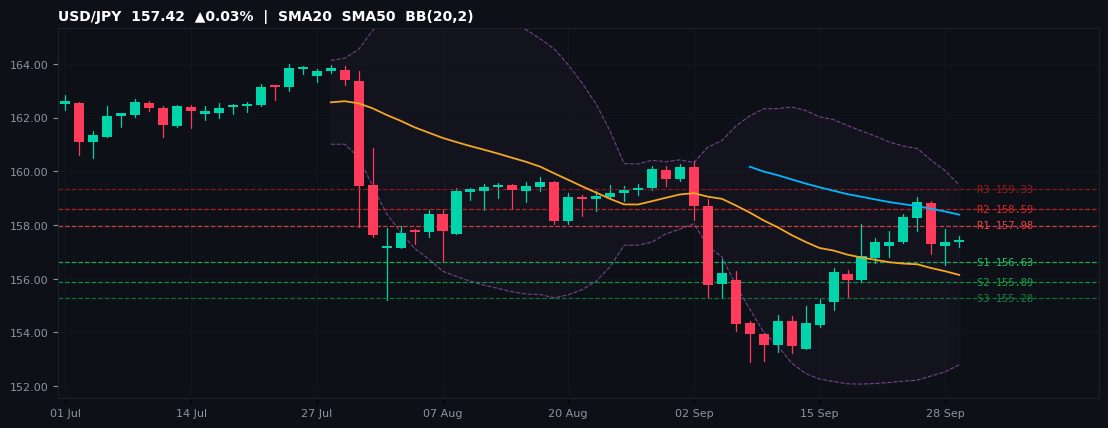
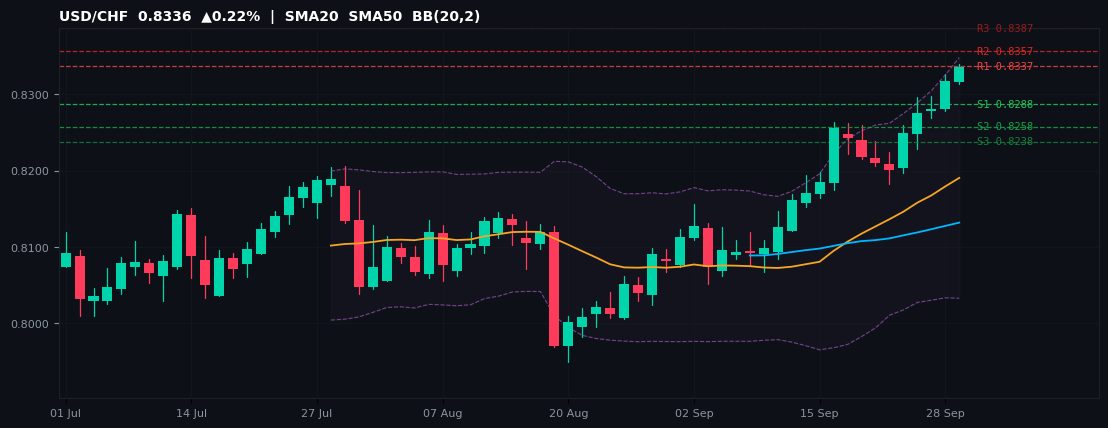
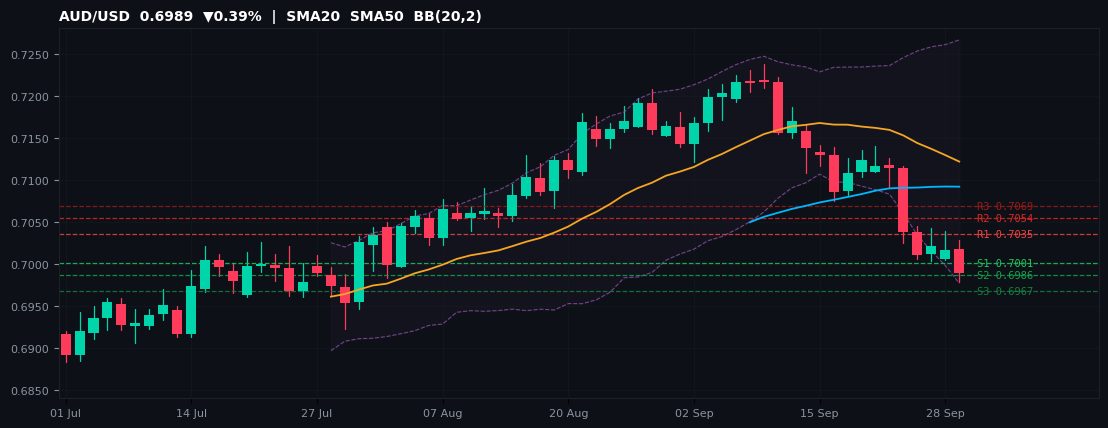
All 19 pairs below include live MT5 pivot levels (R1 R2 R3 / S1 S2 S3) computed from Thursday's full-session OHLC, 65-day candlestick charts with SMA20, SMA50 and Bollinger Bands (20,2), and forward-looking analysis for the EU and US sessions on Tue 29 Sep 2026.
Today's Economic Calendar
| Time (UTC) | Event | CCY | Previous | Forecast | Actual |
|---|---|---|---|---|---|
| 01:30 | ● RBA Rate Statement | AUD | — | — | — |
| 04:30 | ● RBA Interest Rate Decision (Sep) | AUD | 4.35% | 4.60% | 4.60% |
| 07:00 | ● KOF Leading Indicators (Sep) | CHF | 107.5 | 106.0 | 109.1 |
| 07:00 | ● Spanish CPI (YoY) (Sep) | EUR | 4.3% | 4.6% | 4.9% |
| 07:00 | ● Spanish HICP (YoY) (Sep) | EUR | 4.6% | — | 5.0% |
| 09:30 | ● Italian 10-Year BTP Auction | EUR | 4.10% | — | — |
| 10:00 | ● German Buba Mauderer Speaks | EUR | — | — | — |
| 10:00 | ● German Buba President Nagel Speaks | EUR | — | — | — |
| 10:00 | ● France Jobseekers Total (Aug) | EUR | 3,143.0K | — | — |
| 11:00 | ● ECB President Lagarde Speaks | EUR | — | — | — |
| 12:00 | ● Unemployment Rate (Aug) | BRL | 5.3% | 5.3% | — |
| 12:30 | ● GDP (MoM) (Jul) | CAD | 0.3% | 0.0% | — |
| 12:30 | ● GDP (MoM) (Jul) | CAD | 0.3% | — | — |
| 13:00 | ● S&P/CS HPI Composite - 20 n.s.a. (YoY) (Jul) | USD | 2.1% | 2.2% | — |
| 13:00 | ● S&P/CS HPI Composite - 20 n.s.a. (MoM) (Jul) | USD | 0.4% | — | — |
| 14:00 | ● CB Consumer Confidence (Sep) | USD | 89.4 | 89.2 | — |
| 14:00 | ● JOLTS Job Openings (Aug) | USD | 7.271M | 7.230M | — |
| 15:00 | ● BoE MPC Member Mann Speaks | GBP | — | — | — |
| 15:00 | ● FOMC Member Bowman Speaks | USD | — | — | — |
| 16:40 | ● Fed Vice Chair for Supervision Barr Speaks | USD | — | — | — |
| 18:00 | ● FOMC Member Williams Speaks | USD | — | — | — |
| 18:00 | ● ECB's Lane Speaks | EUR | — | — | — |
| 19:00 | ● Fed Waller Speaks | USD | — | — | — |
| 20:30 | ● API Weekly Crude Oil Stock | USD | 1.786M | -1.900M | — |
| 23:50 | ● Industrial Production (MoM) (Aug) | JPY | -0.2% | 1.4% | — |
Major Pairs
EUR/USD
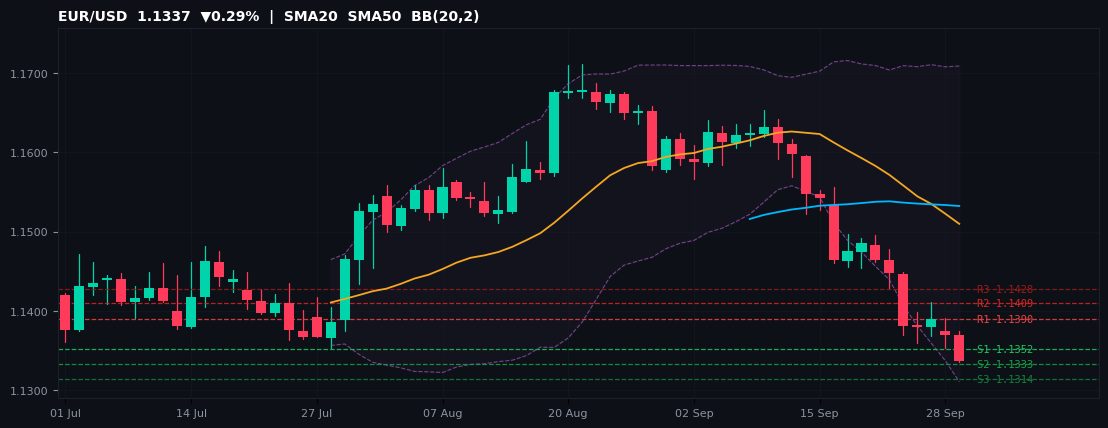
1.1337 ▼0.29% Session H 1.1374 / L 1.1335 52W 1.1324–1.2082
| R3 | R2 | R1 | S1 | S2 | S3 |
|---|---|---|---|---|---|
| 1.1428 | 1.1409 | 1.1390 | 1.1352 | 1.1333 | 1.1314 |
EUR/USD opens the European session at 1.1337 (-0.29% vs. Thursday's close), just 0.11% above its 52-week floor at 1.1324. The intraday bias remains neutral-to-bearish while price holds below the daily pivot at 1.1371. The 52-week range of 1.1324–1.2082 places EUR/USD at the 2th percentile — the annual support is the key line in the sand — hold or break determines the next directional leg.
Resistance levels to monitor on the upside: R1 at 1.1390 is the first pivot barrier; clearing it shifts momentum decisively higher toward R2 (1.1409) and R3 (1.1428). On the downside, S1 at 1.1352 is the immediate support floor — a confirmed break below S1 exposes S2 (1.1333) then S3 (1.1314). The R1–S1 corridor (1.1390–1.1352) marks the most probable intraday trading band.
For the session ahead, the key US data risk is the UoM Consumer Sentiment (preliminary September reading), due at 16:00 UTC. A reading above consensus would strengthen the dollar broadly; a miss would renew USD selling pressure. For EUR/USD, a weekly close below S1 would reinforce the corrective bias into next week.
EUR/USDRangeboundBelow S1Near 52W Low
GBP/USD
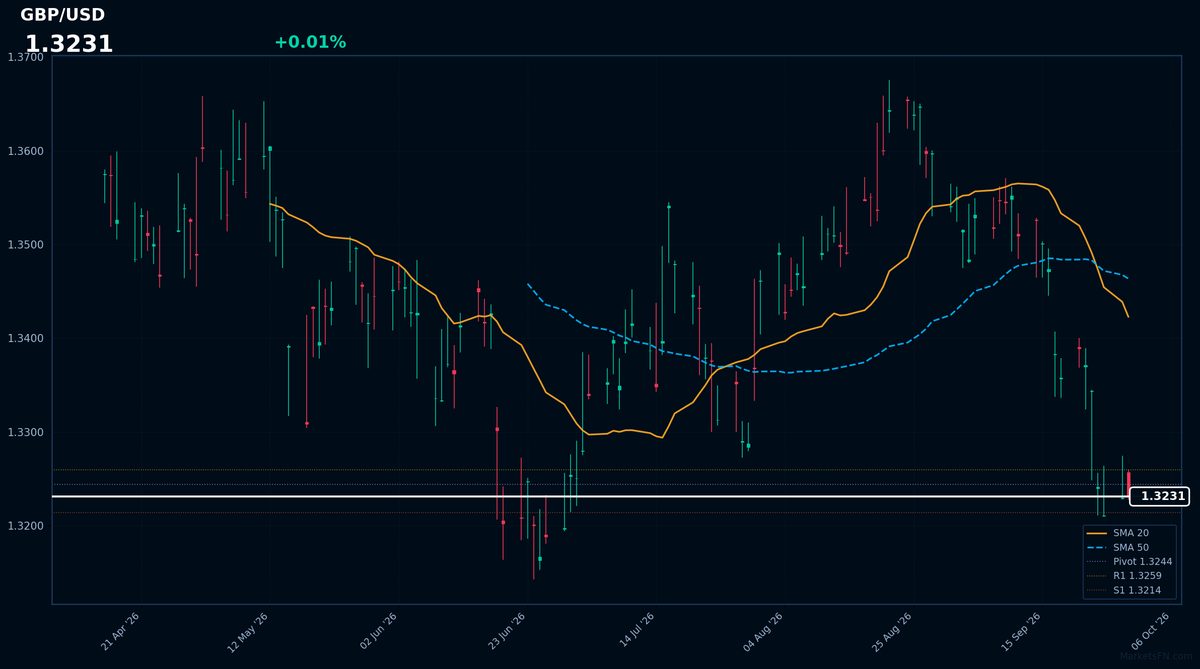
1.3227 ▼0.20% Session H 1.3257 / L 1.3226 52W 1.3009–1.3868
| R3 | R2 | R1 | S1 | S2 | S3 |
|---|---|---|---|---|---|
| 1.3337 | 1.3308 | 1.3281 | 1.3224 | 1.3195 | 1.3168 |
GBP/USD opens the European session at 1.3227 (-0.20% vs. Thursday's close), at the 25th percentile of its 1.3009–1.3868 52-week range. The intraday bias remains neutral-to-bearish while price holds below the daily pivot at 1.3252. The 52-week range of 1.3009–1.3868 places GBP/USD at the 25th percentile — price remains in the lower half of its annual range, reflecting structural headwinds.
Resistance levels to monitor on the upside: R1 at 1.3281 is the first pivot barrier; clearing it shifts momentum decisively higher toward R2 (1.3308) and R3 (1.3337). On the downside, S1 at 1.3224 is the immediate support floor — a confirmed break below S1 exposes S2 (1.3195) then S3 (1.3168). The R1–S1 corridor (1.3281–1.3224) marks the most probable intraday trading band.
For the session ahead, the key US data risk is the UoM Consumer Sentiment (preliminary September reading), due at 16:00 UTC. A reading above consensus would strengthen the dollar broadly; a miss would renew USD selling pressure. For GBP/USD, a weekly close below S1 would reinforce the corrective bias into next week.
GBP/USDRangebound
USD/JPY
157.42 ▲0.03% Session H 157.58 / L 157.20 52W 149.37–163.98
| R3 | R2 | R1 | S1 | S2 | S3 |
|---|---|---|---|---|---|
| 159.33 | 158.59 | 157.98 | 156.63 | 155.89 | 155.28 |
USD/JPY opens the European session at 157.42 (+0.03% vs. Thursday's close), at the 55th percentile of its 149.37–163.98 52-week range. The intraday bias tilts bullish while price holds above the daily pivot at 157.24. The 52-week range of 149.37–163.98 places USD/JPY at the 55th percentile — momentum is broadly constructive within the annual range.
Resistance levels to monitor on the upside: R1 at 157.98 is the first pivot barrier; clearing it shifts momentum decisively higher toward R2 (158.59) and R3 (159.33). On the downside, S1 at 156.63 is the immediate support floor — a confirmed break below S1 exposes S2 (155.89) then S3 (155.28). The R1–S1 corridor (157.98–156.63) marks the most probable intraday trading band.
For the session ahead, the key US data risk is the UoM Consumer Sentiment (preliminary September reading), due at 16:00 UTC. A reading above consensus would strengthen the dollar broadly; a miss would renew USD selling pressure. For USD/JPY, a weekly close above R1 would confirm the bullish structure into next week.
USD/JPYRangebound
USD/CHF
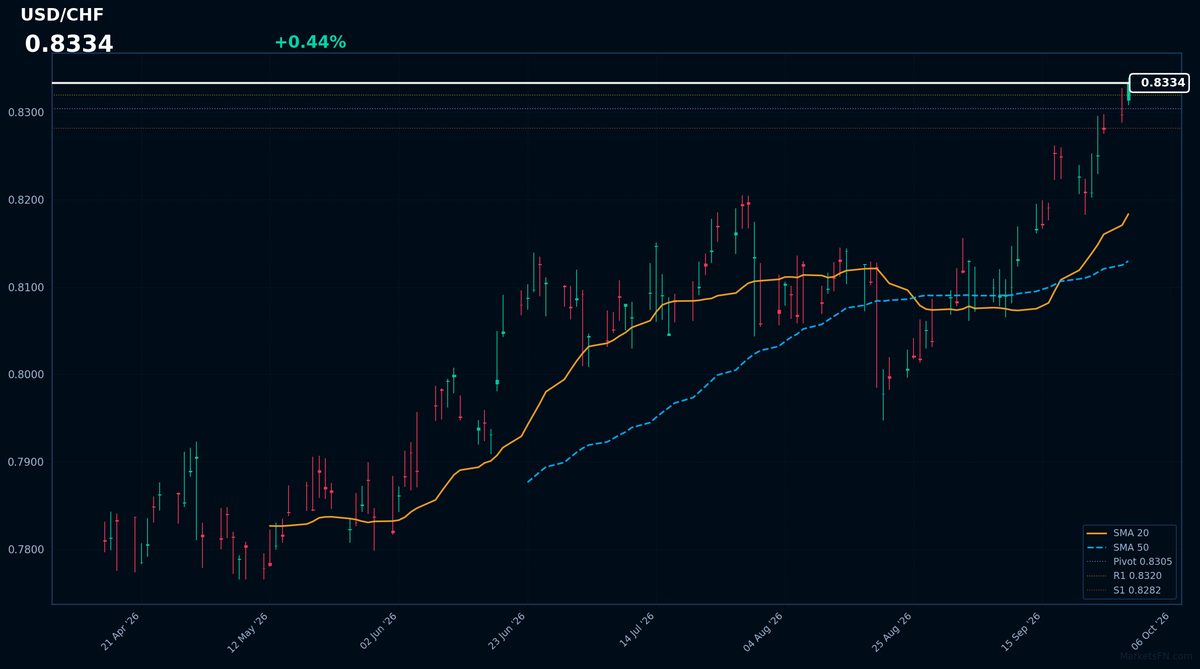
0.8336 ▲0.22% Session H 0.8339 / L 0.8313 52W 0.7602–0.8339
| R3 | R2 | R1 | S1 | S2 | S3 |
|---|---|---|---|---|---|
| 0.8387 | 0.8357 | 0.8337 | 0.8288 | 0.8258 | 0.8238 |
USD/CHF opens the European session at 0.8336 (+0.22% vs. Thursday's close), just 0.04% below its 52-week high of 0.8339. The intraday bias tilts bullish while price holds above the daily pivot at 0.8307. The 52-week range of 0.7602–0.8339 places USD/CHF at the 100th percentile — upside momentum is intact; a break above the 52W high would signal trend extension.
Resistance levels to monitor on the upside: R1 at 0.8337 is the first pivot barrier; clearing it shifts momentum decisively higher toward R2 (0.8357) and R3 (0.8387). On the downside, S1 at 0.8288 is the immediate support floor — a confirmed break below S1 exposes S2 (0.8258) then S3 (0.8238). The R1–S1 corridor (0.8337–0.8288) marks the most probable intraday trading band.
For the session ahead, the key US data risk is the UoM Consumer Sentiment (preliminary September reading), due at 16:00 UTC. A reading above consensus would strengthen the dollar broadly; a miss would renew USD selling pressure. For USD/CHF, a weekly close above R1 would confirm the bullish structure into next week.
USD/CHFRangeboundNear 52W High
AUD/USD
0.6989 ▼0.39% Session H 0.7029 / L 0.6978 52W 0.6421–0.7277
| R3 | R2 | R1 | S1 | S2 | S3 |
|---|---|---|---|---|---|
| 0.7069 | 0.7054 | 0.7035 | 0.7001 | 0.6986 | 0.6967 |
AUD/USD opens the European session at 0.6989 (-0.39% vs. Thursday's close), at the 66th percentile of its 0.6421–0.7277 52-week range. The intraday bias remains neutral-to-bearish while price holds below the daily pivot at 0.7020. The 52-week range of 0.6421–0.7277 places AUD/USD at the 66th percentile — momentum is broadly constructive within the annual range.
Resistance levels to monitor on the upside: R1 at 0.7035 is the first pivot barrier; clearing it shifts momentum decisively higher toward R2 (0.7054) and R3 (0.7069). On the downside, S1 at 0.7001 is the immediate support floor — a confirmed break below S1 exposes S2 (0.6986) then S3 (0.6967). The R1–S1 corridor (0.7035–0.7001) marks the most probable intraday trading band.
For the session ahead, the key US data risk is the UoM Consumer Sentiment (preliminary September reading), due at 16:00 UTC. A reading above consensus would strengthen the dollar broadly; a miss would renew USD selling pressure. For AUD/USD, a weekly close below S1 would reinforce the corrective bias into next week.
AUD/USDBearishBelow S1
NZD/USD
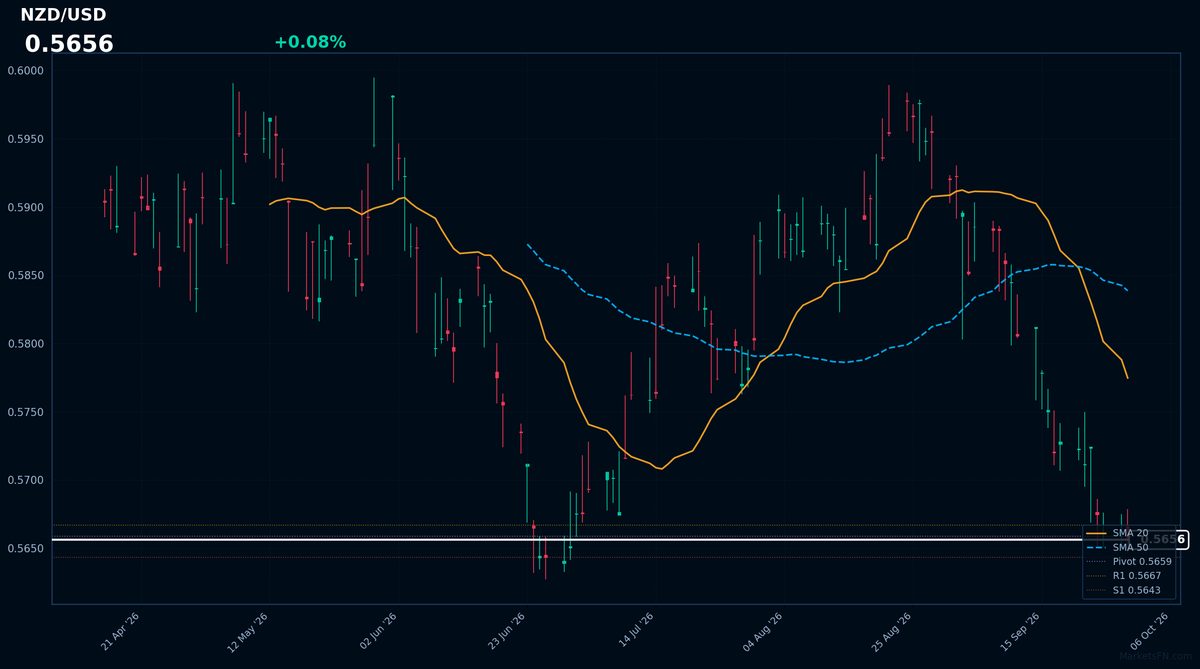
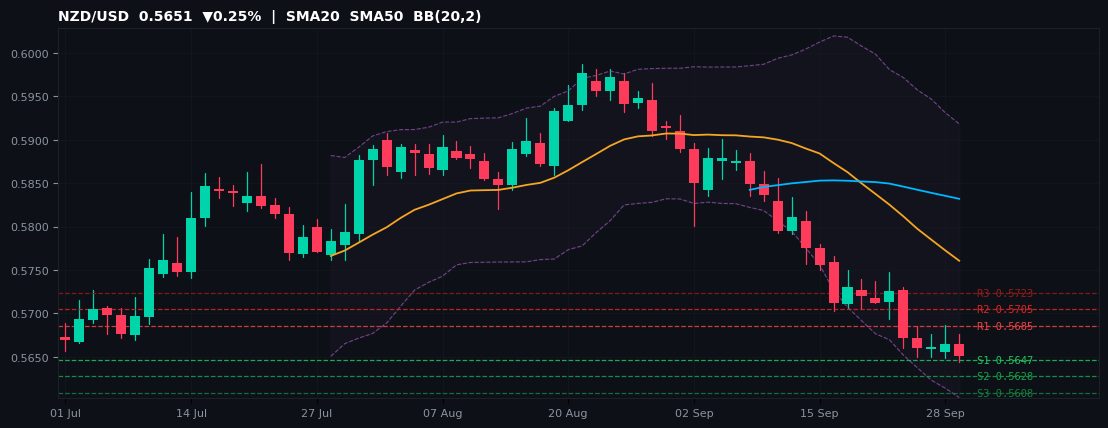
0.5651 ▼0.25% Session H 0.5676 / L 0.5643 52W 0.5576–0.6092
| R3 | R2 | R1 | S1 | S2 | S3 |
|---|---|---|---|---|---|
| 0.5723 | 0.5705 | 0.5685 | 0.5647 | 0.5628 | 0.5608 |
NZD/USD opens the European session at 0.5651 (-0.25% vs. Thursday's close), just 1.35% above its 52-week floor at 0.5576. The intraday bias remains neutral-to-bearish while price holds below the daily pivot at 0.5666. The 52-week range of 0.5576–0.6092 places NZD/USD at the 15th percentile — the annual support is the key line in the sand — hold or break determines the next directional leg.
Resistance levels to monitor on the upside: R1 at 0.5685 is the first pivot barrier; clearing it shifts momentum decisively higher toward R2 (0.5705) and R3 (0.5723). On the downside, S1 at 0.5647 is the immediate support floor — a confirmed break below S1 exposes S2 (0.5628) then S3 (0.5608). The R1–S1 corridor (0.5685–0.5647) marks the most probable intraday trading band.
For the session ahead, the key US data risk is the UoM Consumer Sentiment (preliminary September reading), due at 16:00 UTC. A reading above consensus would strengthen the dollar broadly; a miss would renew USD selling pressure. For NZD/USD, a weekly close below S1 would reinforce the corrective bias into next week.
NZD/USDRangeboundNear 52W Low
USD/CAD
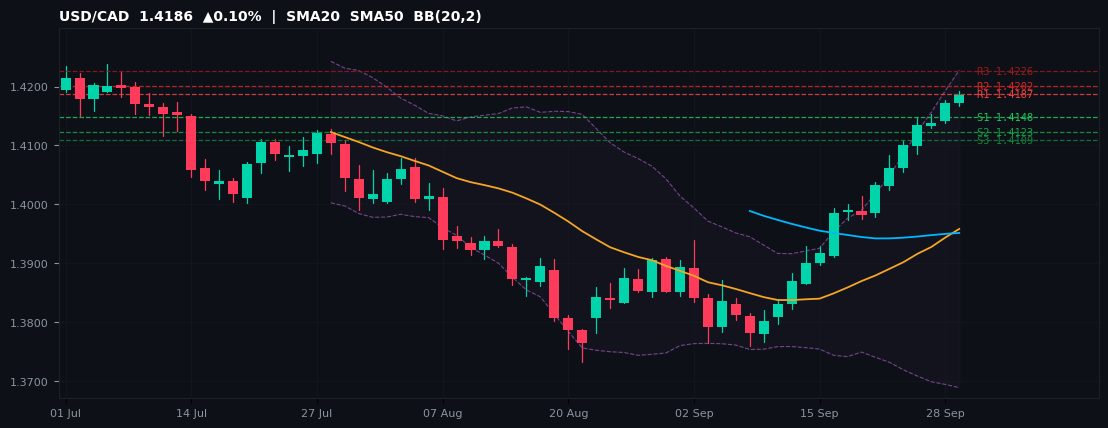
1.4186 ▲0.10% Session H 1.4192 / L 1.4167 52W 1.3480–1.4247
| R3 | R2 | R1 | S1 | S2 | S3 |
|---|---|---|---|---|---|
| 1.4226 | 1.4202 | 1.4187 | 1.4148 | 1.4123 | 1.4109 |
USD/CAD opens the European session at 1.4186 (+0.10% vs. Thursday's close), just 0.43% below its 52-week high of 1.4247. The intraday bias tilts bullish while price holds above the daily pivot at 1.4162. The 52-week range of 1.3480–1.4247 places USD/CAD at the 92th percentile — upside momentum is intact; a break above the 52W high would signal trend extension.
Resistance levels to monitor on the upside: R1 at 1.4187 is the first pivot barrier; clearing it shifts momentum decisively higher toward R2 (1.4202) and R3 (1.4226). On the downside, S1 at 1.4148 is the immediate support floor — a confirmed break below S1 exposes S2 (1.4123) then S3 (1.4109). The R1–S1 corridor (1.4187–1.4148) marks the most probable intraday trading band.
For the session ahead, the key US data risk is the UoM Consumer Sentiment (preliminary September reading), due at 16:00 UTC. A reading above consensus would strengthen the dollar broadly; a miss would renew USD selling pressure. For USD/CAD, a weekly close above R1 would confirm the bullish structure into next week.
USD/CADRangeboundNear 52W High
📚 Book Insights
If You Believe Markets Are Efficient, Do Not Read This
A practitioner's guide to structural market inefficiencies — how central bank policy divergence, carry dynamics, and cross-asset flows create durable FX trading edges that efficient-market theorists systematically underestimate.
Read the analysis →Cross Pairs
EUR/GBP
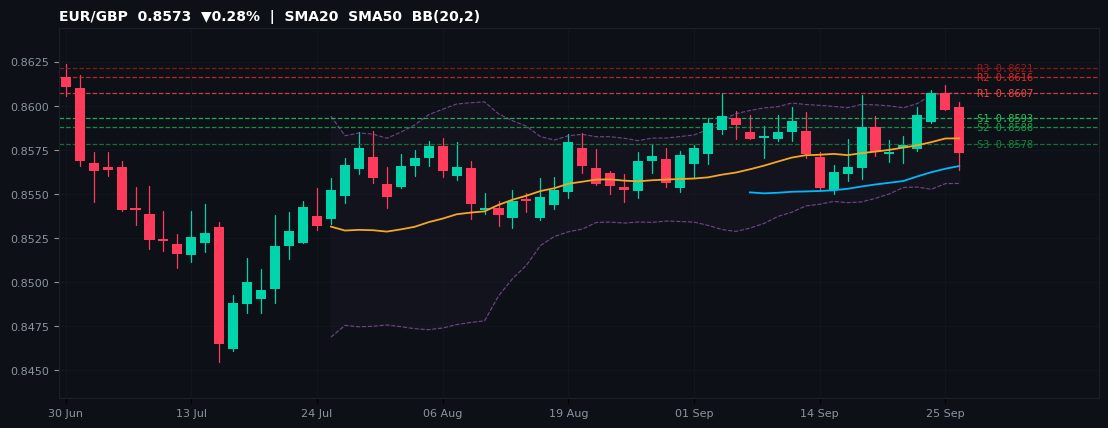
0.8573 ▼0.28% Session H 0.8602 / L 0.8563 52W 0.8454–0.8865
| R3 | R2 | R1 | S1 | S2 | S3 |
|---|---|---|---|---|---|
| 0.8621 | 0.8616 | 0.8607 | 0.8593 | 0.8588 | 0.8578 |
EUR/GBP opens the European session at 0.8573 (-0.28% vs. Thursday's close), just 1.41% above its 52-week floor at 0.8454. The intraday bias remains neutral-to-bearish while price holds below the daily pivot at 0.8602. The 52-week range of 0.8454–0.8865 places EUR/GBP at the 29th percentile — the annual support is the key line in the sand — hold or break determines the next directional leg.
Resistance levels to monitor on the upside: R1 at 0.8607 is the first pivot barrier; clearing it shifts momentum decisively higher toward R2 (0.8616) and R3 (0.8621). On the downside, S1 at 0.8593 is the immediate support floor — a confirmed break below S1 exposes S2 (0.8588) then S3 (0.8578). The R1–S1 corridor (0.8607–0.8593) marks the most probable intraday trading band.
For the session ahead, the key US data risk is the UoM Consumer Sentiment (preliminary September reading), due at 16:00 UTC. A reading above consensus would strengthen the dollar broadly; a miss would renew USD selling pressure. For EUR/GBP, a weekly close below S1 would reinforce the corrective bias into next week.
EUR/GBPRangeboundBelow S1Near 52W Low
EUR/JPY
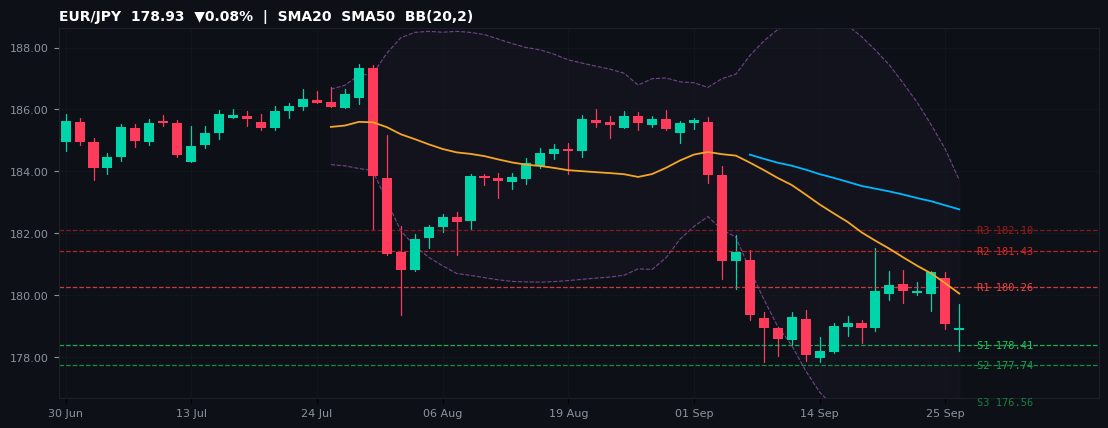
178.93 ▼0.08% Session H 179.72 / L 178.19 52W 174.81–187.94
| R3 | R2 | R1 | S1 | S2 | S3 |
|---|---|---|---|---|---|
| 182.10 | 181.43 | 180.26 | 178.41 | 177.74 | 176.56 |
EUR/JPY opens the European session at 178.93 (-0.08% vs. Thursday's close), at the 31th percentile of its 174.81–187.94 52-week range. The intraday bias remains neutral-to-bearish while price holds below the daily pivot at 179.58. The 52-week range of 174.81–187.94 places EUR/JPY at the 31th percentile — price remains in the lower half of its annual range, reflecting structural headwinds.
Resistance levels to monitor on the upside: R1 at 180.26 is the first pivot barrier; clearing it shifts momentum decisively higher toward R2 (181.43) and R3 (182.10). On the downside, S1 at 178.41 is the immediate support floor — a confirmed break below S1 exposes S2 (177.74) then S3 (176.56). The R1–S1 corridor (180.26–178.41) marks the most probable intraday trading band.
For the session ahead, the key US data risk is the UoM Consumer Sentiment (preliminary September reading), due at 16:00 UTC. A reading above consensus would strengthen the dollar broadly; a miss would renew USD selling pressure. For EUR/JPY, a weekly close below S1 would reinforce the corrective bias into next week.
EUR/JPYRangebound
GBP/JPY
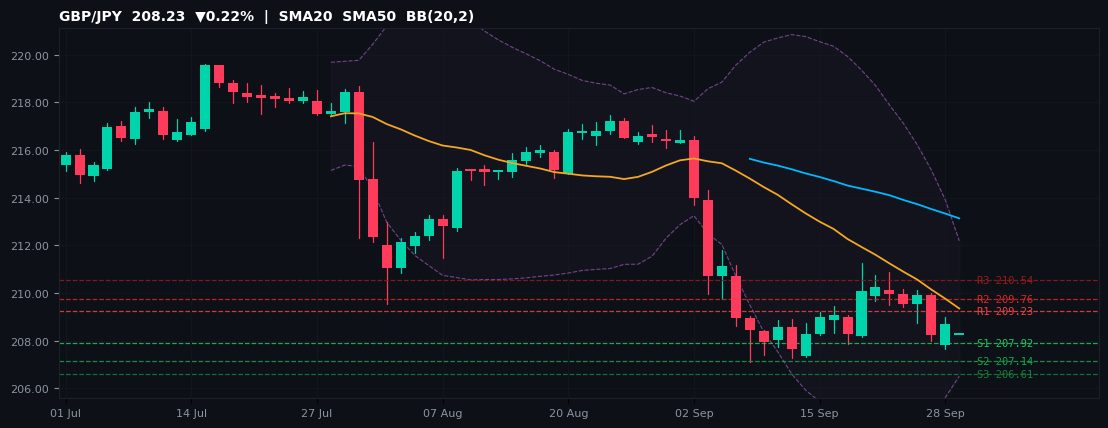
208.23 ▼0.22% Session H 208.23 / L 208.23 52W 199.06–219.60
| R3 | R2 | R1 | S1 | S2 | S3 |
|---|---|---|---|---|---|
| 210.54 | 209.76 | 209.23 | 207.92 | 207.14 | 206.61 |
GBP/JPY opens the European session at 208.23 (-0.22% vs. Thursday's close), at the 45th percentile of its 199.06–219.60 52-week range. The intraday bias remains neutral-to-bearish while price holds below the daily pivot at 208.45. The 52-week range of 199.06–219.60 places GBP/JPY at the 45th percentile — price remains in the lower half of its annual range, reflecting structural headwinds.
Resistance levels to monitor on the upside: R1 at 209.23 is the first pivot barrier; clearing it shifts momentum decisively higher toward R2 (209.76) and R3 (210.54). On the downside, S1 at 207.92 is the immediate support floor — a confirmed break below S1 exposes S2 (207.14) then S3 (206.61). The R1–S1 corridor (209.23–207.92) marks the most probable intraday trading band.
For the session ahead, the key US data risk is the UoM Consumer Sentiment (preliminary September reading), due at 16:00 UTC. A reading above consensus would strengthen the dollar broadly; a miss would renew USD selling pressure. For GBP/JPY, a weekly close below S1 would reinforce the corrective bias into next week.
GBP/JPYRangebound
AUD/JPY
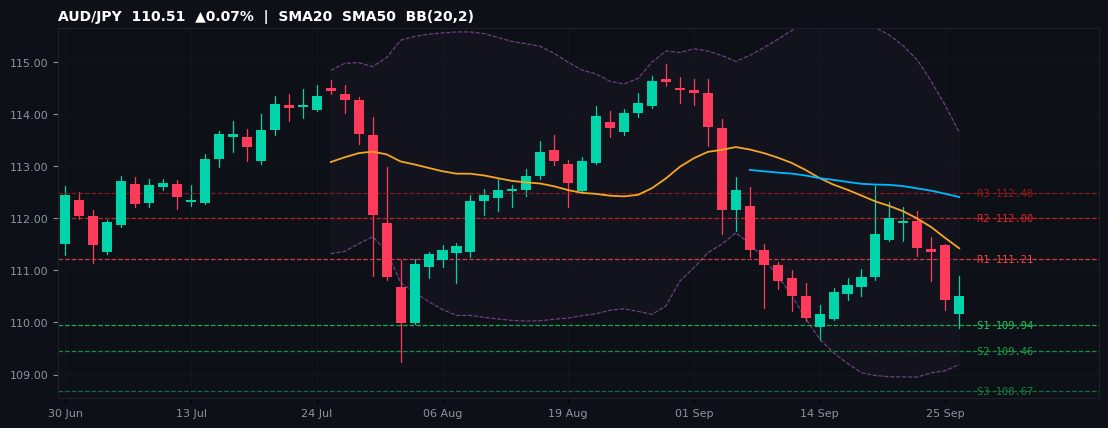
110.51 ▲0.07% Session H 110.88 / L 109.90 52W 96.25–114.95
| R3 | R2 | R1 | S1 | S2 | S3 |
|---|---|---|---|---|---|
| 112.48 | 112.00 | 111.21 | 109.94 | 109.46 | 108.67 |
AUD/JPY opens the European session at 110.51 (+0.07% vs. Thursday's close), at the 76th percentile of its 96.25–114.95 52-week range. The intraday bias remains neutral-to-bearish while price holds below the daily pivot at 110.73. The 52-week range of 96.25–114.95 places AUD/JPY at the 76th percentile — momentum is broadly constructive within the annual range.
Resistance levels to monitor on the upside: R1 at 111.21 is the first pivot barrier; clearing it shifts momentum decisively higher toward R2 (112.00) and R3 (112.48). On the downside, S1 at 109.94 is the immediate support floor — a confirmed break below S1 exposes S2 (109.46) then S3 (108.67). The R1–S1 corridor (111.21–109.94) marks the most probable intraday trading band.
For the session ahead, the key US data risk is the UoM Consumer Sentiment (preliminary September reading), due at 16:00 UTC. A reading above consensus would strengthen the dollar broadly; a miss would renew USD selling pressure. For AUD/JPY, a weekly close below S1 would reinforce the corrective bias into next week.
AUD/JPYRangebound
🏭 Forex Course — Quick Quiz
Test Your Knowledge on Today's Key Themes
Five questions on carry trade dynamics, central bank divergence, commodity-currency correlations and technical extremes. Instant results, mobile-friendly.
Start the Quiz →Nordic Pairs
USD/NOK
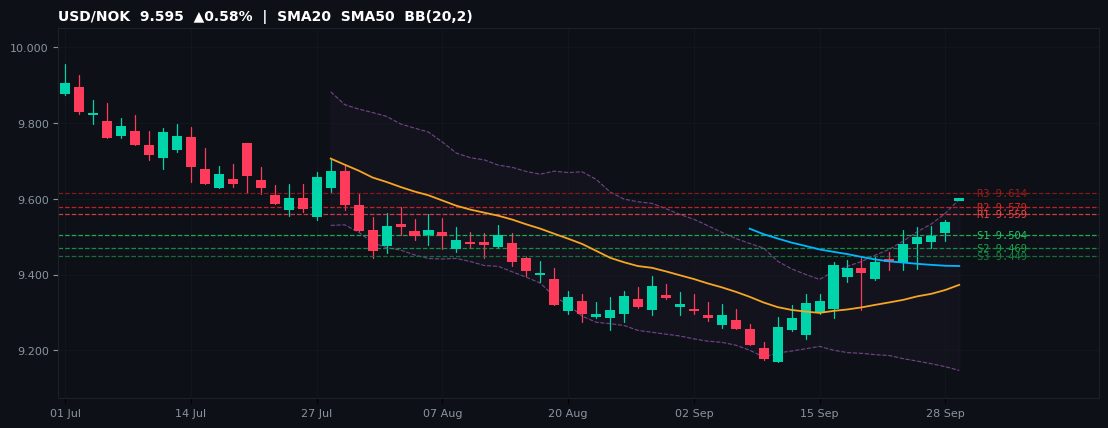
9.595 ▲0.58% Session H 9.595 / L 9.595 52W 9.144–10.297
| R3 | R2 | R1 | S1 | S2 | S3 |
|---|---|---|---|---|---|
| 9.614 | 9.579 | 9.559 | 9.504 | 9.469 | 9.449 |
USD/NOK opens the European session at 9.595 (+0.58% vs. Thursday's close), at the 39th percentile of its 9.144–10.297 52-week range. The intraday bias tilts bullish while price holds above the daily pivot at 9.524. The 52-week range of 9.144–10.297 places USD/NOK at the 39th percentile — price remains in the lower half of its annual range, reflecting structural headwinds.
Resistance levels to monitor on the upside: R1 at 9.559 is the first pivot barrier; clearing it shifts momentum decisively higher toward R2 (9.579) and R3 (9.614). On the downside, S1 at 9.504 is the immediate support floor — a confirmed break below S1 exposes S2 (9.469) then S3 (9.449). The R1–S1 corridor (9.559–9.504) marks the most probable intraday trading band.
For the session ahead, the key US data risk is the UoM Consumer Sentiment (preliminary September reading), due at 16:00 UTC. A reading above consensus would strengthen the dollar broadly; a miss would renew USD selling pressure. For USD/NOK, a weekly close above R1 would confirm the bullish structure into next week.
USD/NOKBullishAbove R1
USD/SEK
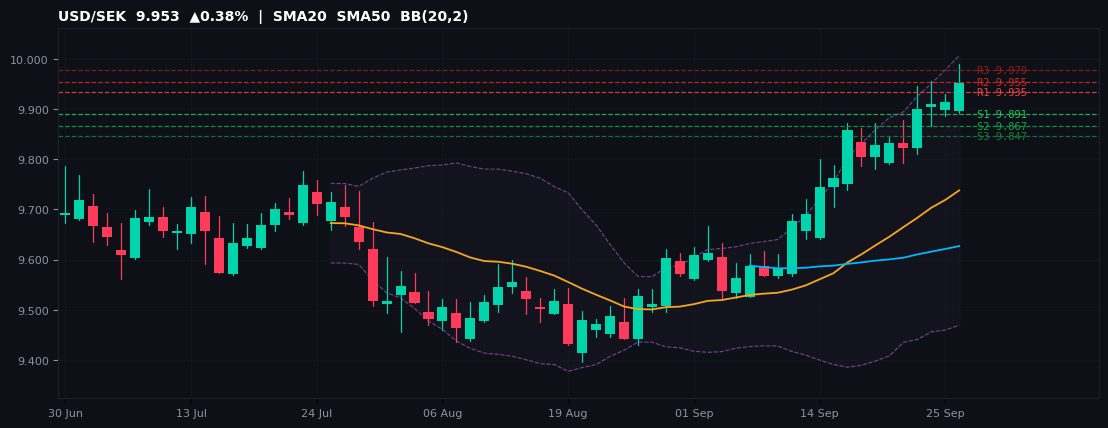
9.953 ▲0.38% Session H 9.990 / L 9.893 52W 8.737–9.990
| R3 | R2 | R1 | S1 | S2 | S3 |
|---|---|---|---|---|---|
| 9.979 | 9.955 | 9.935 | 9.891 | 9.867 | 9.847 |
USD/SEK opens the European session at 9.953 (+0.38% vs. Thursday's close), just 0.38% below its 52-week high of 9.990. The intraday bias tilts bullish while price holds above the daily pivot at 9.911. The 52-week range of 8.737–9.990 places USD/SEK at the 97th percentile — upside momentum is intact; a break above the 52W high would signal trend extension.
Resistance levels to monitor on the upside: R1 at 9.935 is the first pivot barrier; clearing it shifts momentum decisively higher toward R2 (9.955) and R3 (9.979). On the downside, S1 at 9.891 is the immediate support floor — a confirmed break below S1 exposes S2 (9.867) then S3 (9.847). The R1–S1 corridor (9.935–9.891) marks the most probable intraday trading band.
For the session ahead, the key US data risk is the UoM Consumer Sentiment (preliminary September reading), due at 16:00 UTC. A reading above consensus would strengthen the dollar broadly; a miss would renew USD selling pressure. For USD/SEK, a weekly close above R1 would confirm the bullish structure into next week.
USD/SEKBullishAbove R1Near 52W High
EUR/NOK
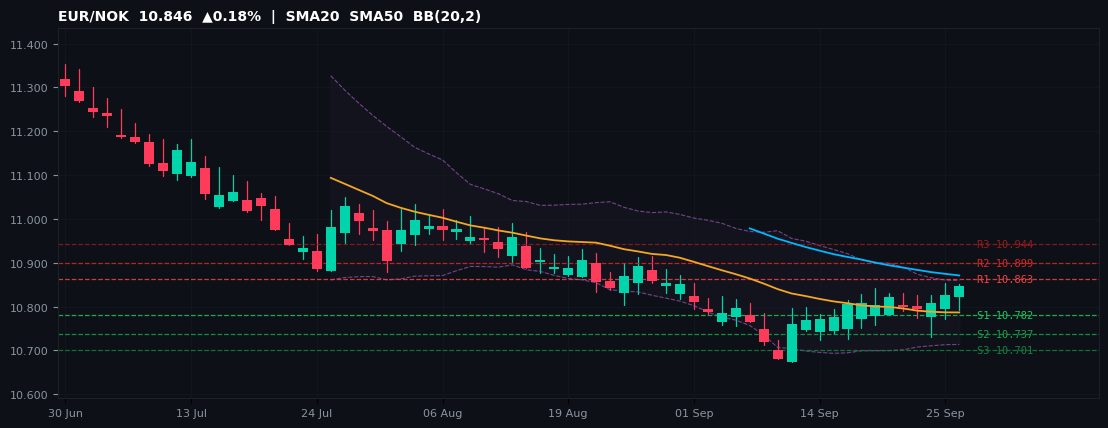
10.846 ▲0.18% Session H 10.851 / L 10.791 52W 10.673–12.012
| R3 | R2 | R1 | S1 | S2 | S3 |
|---|---|---|---|---|---|
| 10.944 | 10.899 | 10.863 | 10.782 | 10.737 | 10.701 |
EUR/NOK opens the European session at 10.846 (+0.18% vs. Thursday's close), at the 13th percentile of its 10.673–12.012 52-week range. The intraday bias tilts bullish while price holds above the daily pivot at 10.818. The 52-week range of 10.673–12.012 places EUR/NOK at the 13th percentile — price remains in the lower half of its annual range, reflecting structural headwinds.
Resistance levels to monitor on the upside: R1 at 10.863 is the first pivot barrier; clearing it shifts momentum decisively higher toward R2 (10.899) and R3 (10.944). On the downside, S1 at 10.782 is the immediate support floor — a confirmed break below S1 exposes S2 (10.737) then S3 (10.701). The R1–S1 corridor (10.863–10.782) marks the most probable intraday trading band.
For the session ahead, the key US data risk is the UoM Consumer Sentiment (preliminary September reading), due at 16:00 UTC. A reading above consensus would strengthen the dollar broadly; a miss would renew USD selling pressure. For EUR/NOK, a weekly close above R1 would confirm the bullish structure into next week.
EUR/NOKRangebound
NOK/SEK
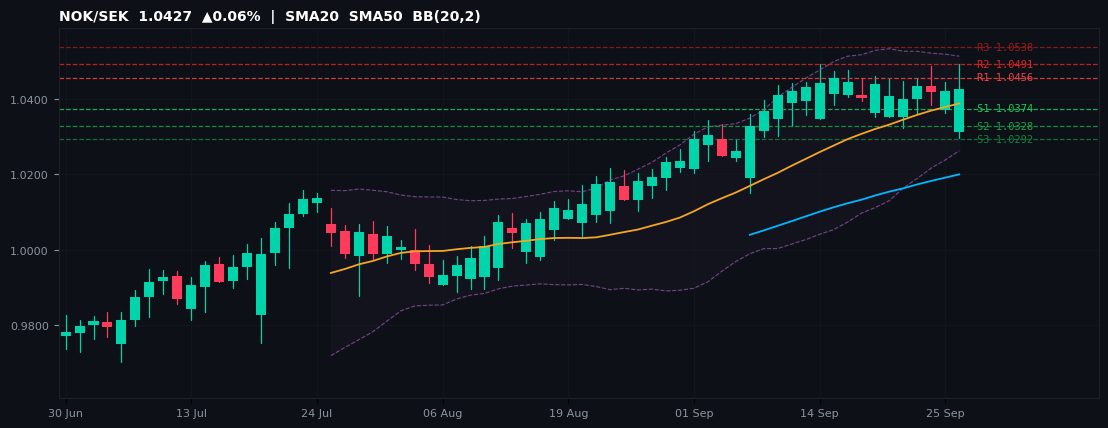
1.0427 ▲0.06% Session H 1.0491 / L 1.0295 52W 0.9064–1.0491
| R3 | R2 | R1 | S1 | S2 | S3 |
|---|---|---|---|---|---|
| 1.0538 | 1.0491 | 1.0456 | 1.0374 | 1.0328 | 1.0292 |
NOK/SEK opens the European session at 1.0427 (+0.06% vs. Thursday's close), just 0.62% below its 52-week high of 1.0491. The intraday bias tilts bullish while price holds above the daily pivot at 1.0409. The 52-week range of 0.9064–1.0491 places NOK/SEK at the 95th percentile — upside momentum is intact; a break above the 52W high would signal trend extension.
Resistance levels to monitor on the upside: R1 at 1.0456 is the first pivot barrier; clearing it shifts momentum decisively higher toward R2 (1.0491) and R3 (1.0538). On the downside, S1 at 1.0374 is the immediate support floor — a confirmed break below S1 exposes S2 (1.0328) then S3 (1.0292). The R1–S1 corridor (1.0456–1.0374) marks the most probable intraday trading band.
For the session ahead, the key US data risk is the UoM Consumer Sentiment (preliminary September reading), due at 16:00 UTC. A reading above consensus would strengthen the dollar broadly; a miss would renew USD selling pressure. For NOK/SEK, a weekly close above R1 would confirm the bullish structure into next week.
NOK/SEKRangeboundNear 52W High
Exotic Pairs
USD/TRY
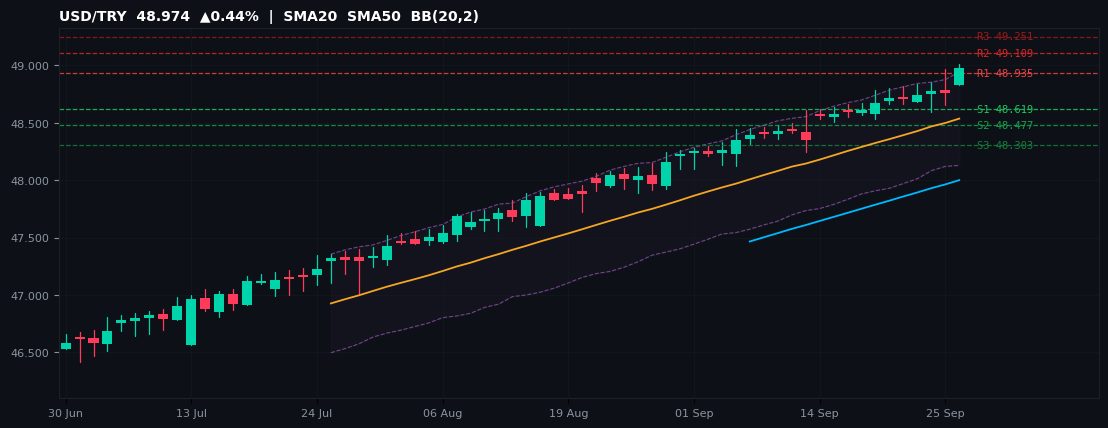
48.974 ▲0.44% Session H 49.010 / L 48.826 52W 41.415–49.010
| R3 | R2 | R1 | S1 | S2 | S3 |
|---|---|---|---|---|---|
| 49.251 | 49.109 | 48.935 | 48.619 | 48.477 | 48.303 |
USD/TRY opens the European session at 48.974 (+0.44% vs. Thursday's close), just 0.07% below its 52-week high of 49.010. The intraday bias tilts bullish while price holds above the daily pivot at 48.793. The 52-week range of 41.415–49.010 places USD/TRY at the 100th percentile — upside momentum is intact; a break above the 52W high would signal trend extension.
Resistance levels to monitor on the upside: R1 at 48.935 is the first pivot barrier; clearing it shifts momentum decisively higher toward R2 (49.109) and R3 (49.251). On the downside, S1 at 48.619 is the immediate support floor — a confirmed break below S1 exposes S2 (48.477) then S3 (48.303). The R1–S1 corridor (48.935–48.619) marks the most probable intraday trading band.
For the session ahead, the key US data risk is the UoM Consumer Sentiment (preliminary September reading), due at 16:00 UTC. A reading above consensus would strengthen the dollar broadly; a miss would renew USD selling pressure. For USD/TRY, a weekly close above R1 would confirm the bullish structure into next week.
USD/TRYBullishAbove R1Near 52W High
USD/MXN
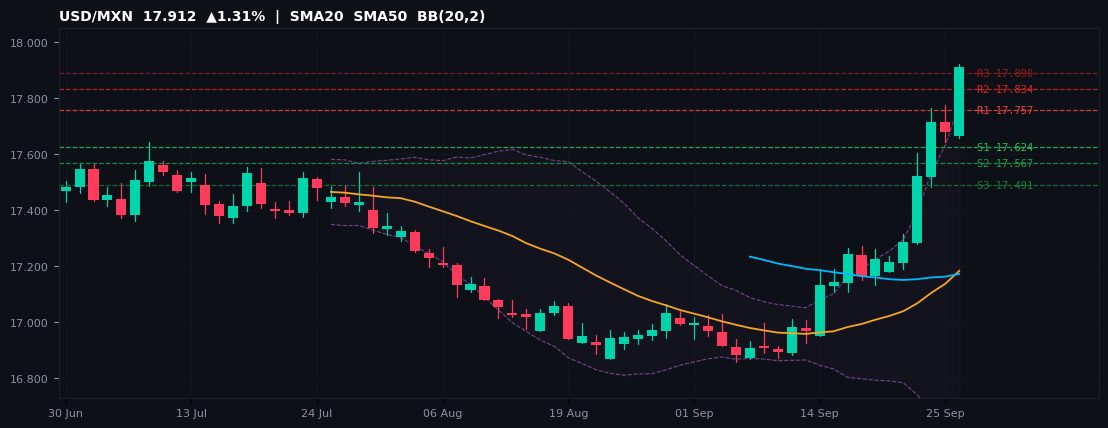
17.912 ▲1.31% Session H 17.922 / L 17.660 52W 16.855–18.768
| R3 | R2 | R1 | S1 | S2 | S3 |
|---|---|---|---|---|---|
| 17.890 | 17.834 | 17.757 | 17.624 | 17.567 | 17.491 |
USD/MXN opens the European session at 17.912 (+1.31% vs. Thursday's close), at the 55th percentile of its 16.855–18.768 52-week range. The intraday bias tilts bullish while price holds above the daily pivot at 17.700. The 52-week range of 16.855–18.768 places USD/MXN at the 55th percentile — momentum is broadly constructive within the annual range.
Resistance levels to monitor on the upside: R1 at 17.757 is the first pivot barrier; clearing it shifts momentum decisively higher toward R2 (17.834) and R3 (17.890). On the downside, S1 at 17.624 is the immediate support floor — a confirmed break below S1 exposes S2 (17.567) then S3 (17.491). The R1–S1 corridor (17.757–17.624) marks the most probable intraday trading band.
For the session ahead, the key US data risk is the UoM Consumer Sentiment (preliminary September reading), due at 16:00 UTC. A reading above consensus would strengthen the dollar broadly; a miss would renew USD selling pressure. For USD/MXN, a weekly close above R1 would confirm the bullish structure into next week.
USD/MXNBullishAbove R1
USD/ZAR
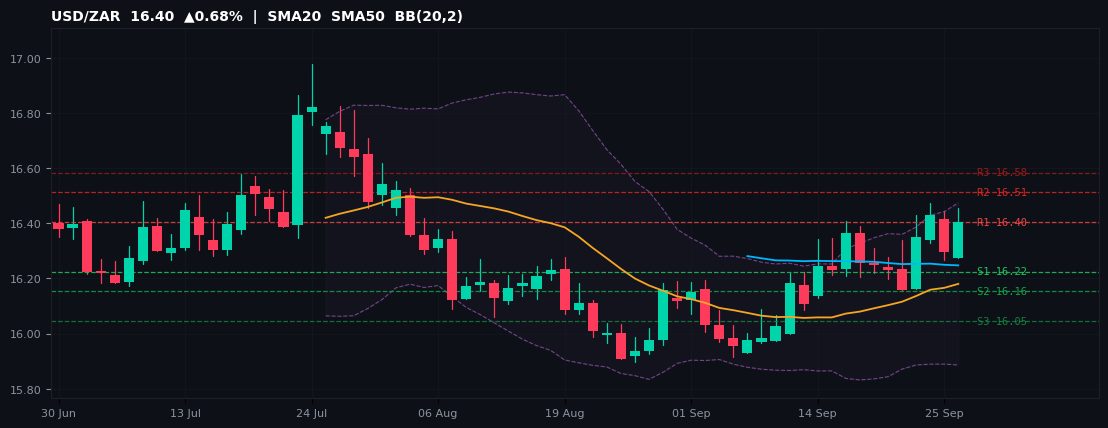
16.40 ▲0.68% Session H 16.46 / L 16.28 52W 15.64–17.57
| R3 | R2 | R1 | S1 | S2 | S3 |
|---|---|---|---|---|---|
| 16.58 | 16.51 | 16.40 | 16.22 | 16.16 | 16.05 |
USD/ZAR opens the European session at 16.40 (+0.68% vs. Thursday's close), at the 40th percentile of its 15.64–17.57 52-week range. The intraday bias tilts bullish while price holds above the daily pivot at 16.33. The 52-week range of 15.64–17.57 places USD/ZAR at the 40th percentile — price remains in the lower half of its annual range, reflecting structural headwinds.
Resistance levels to monitor on the upside: R1 at 16.40 is the first pivot barrier; clearing it shifts momentum decisively higher toward R2 (16.51) and R3 (16.58). On the downside, S1 at 16.22 is the immediate support floor — a confirmed break below S1 exposes S2 (16.16) then S3 (16.05). The R1–S1 corridor (16.40–16.22) marks the most probable intraday trading band.
For the session ahead, the key US data risk is the UoM Consumer Sentiment (preliminary September reading), due at 16:00 UTC. A reading above consensus would strengthen the dollar broadly; a miss would renew USD selling pressure. For USD/ZAR, a weekly close above R1 would confirm the bullish structure into next week.
USD/ZARBullishAbove R1
USD/PLN
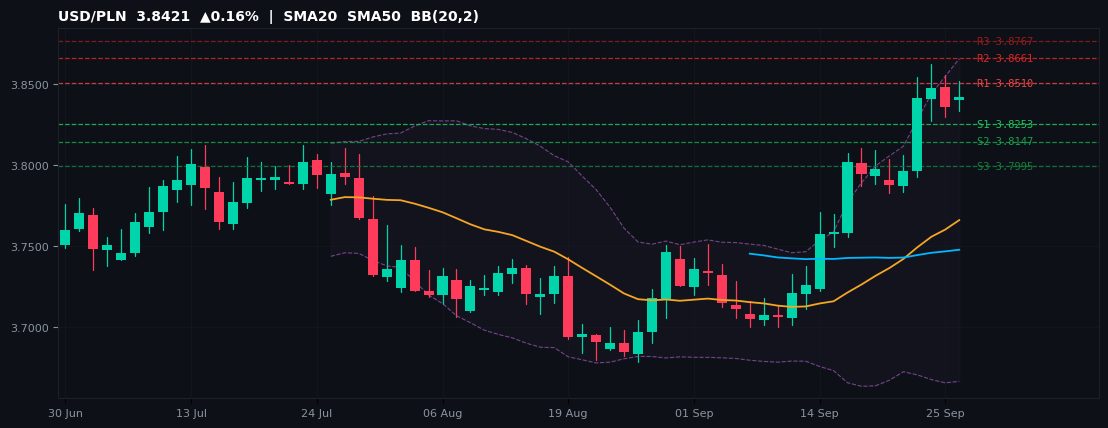
3.8421 ▲0.16% Session H 3.8520 / L 3.8337 52W 3.4750–3.8624
| R3 | R2 | R1 | S1 | S2 | S3 |
|---|---|---|---|---|---|
| 3.8767 | 3.8661 | 3.8510 | 3.8253 | 3.8147 | 3.7995 |
USD/PLN opens the European session at 3.8421 (+0.16% vs. Thursday's close), just 0.53% below its 52-week high of 3.8624. The intraday bias tilts bullish while price holds above the daily pivot at 3.8404. The 52-week range of 3.4750–3.8624 places USD/PLN at the 95th percentile — upside momentum is intact; a break above the 52W high would signal trend extension.
Resistance levels to monitor on the upside: R1 at 3.8510 is the first pivot barrier; clearing it shifts momentum decisively higher toward R2 (3.8661) and R3 (3.8767). On the downside, S1 at 3.8253 is the immediate support floor — a confirmed break below S1 exposes S2 (3.8147) then S3 (3.7995). The R1–S1 corridor (3.8510–3.8253) marks the most probable intraday trading band.
For the session ahead, the key US data risk is the UoM Consumer Sentiment (preliminary September reading), due at 16:00 UTC. A reading above consensus would strengthen the dollar broadly; a miss would renew USD selling pressure. For USD/PLN, a weekly close above R1 would confirm the bullish structure into next week.
USD/PLNRangeboundNear 52W High
Informational purposes only — not investment advice. Pivot levels computed from Thursday's session OHLC via standard floor-pivot formula. Data sourced from MetaTrader 5 as of Tuesday 29 September 2026 EU open. Past performance is not indicative of future results.