Fibonacci Retracement Analysis: USD/CAD and GBP/USD Near Key Levels
MarketsFN Team
Fibonacci Retracement Analysis: USD/CAD and GBP/USD Near Key Levels
Published: September 01, 2026
Market Overview
The Japanese Yen is influenced by expectations of a potential Bank of Japan interest rate hike, while the AUD/USD pair shows bullish prospects supported by a rising 20-day EMA. The Indian Rupee gains strength from positive Q2 GDP data and a reduced fiscal deficit, amid a mixed performance of Asian currencies as the dollar stabilizes and the yen hovers near the 160 mark.
USD/CAD - U.S. Dollar / Canadian Dollar
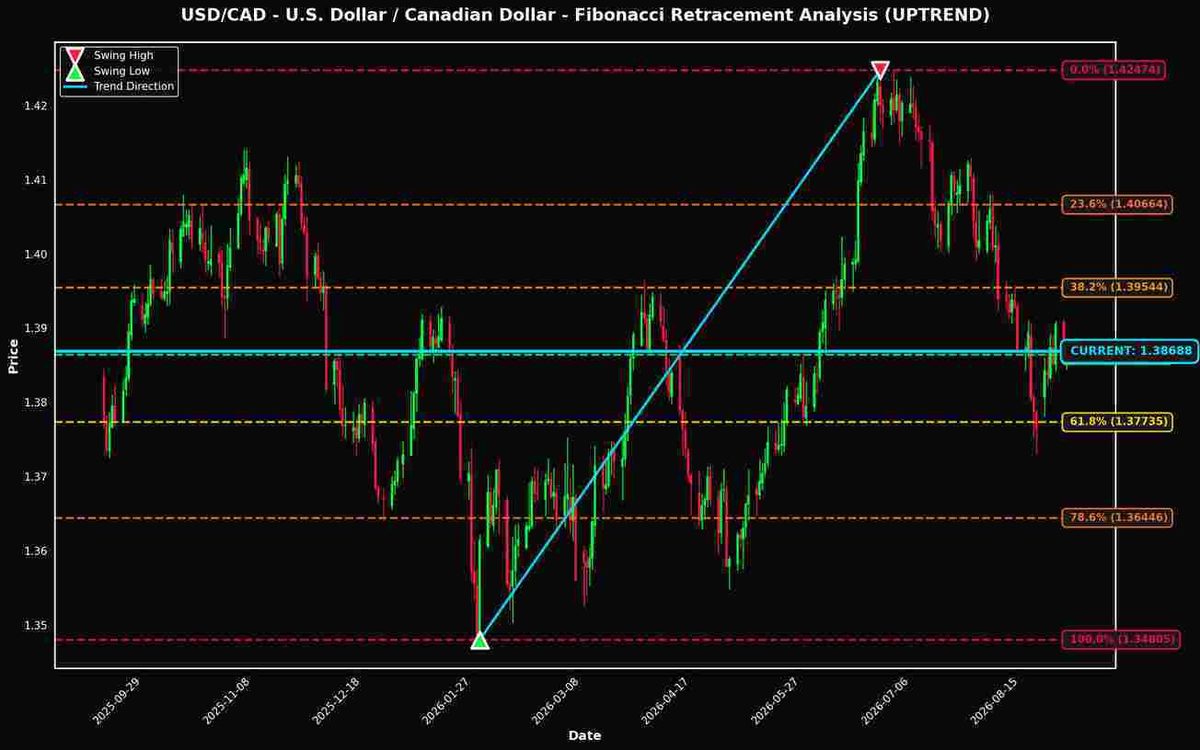
Currently trading at 1.38688 (+0.12% today), USD/CAD is positioned just 0.03% away from the critical 50.0% Fibonacci retracement level, making it a pair to watch closely.

Technical Analysis
As of the current market data, the USD/CAD is trading at 1.38688, positioning itself just 0.03% above the significant 50.0% Fibonacci retracement level at 1.38639. This retracement level is pivotal as it often acts as a psychological and technical barrier, serving as a potential area of both support and resistance. ### Current Price Position Relative to Fibonacci Levels The current price is situated between the 38.2% retracement level at 1.39544 and the 50.0% level at 1.38639. This proximity to the 50.0% level suggests the market may be consolidating in anticipation of a decisive movement. If the price holds above this level, it may indicate continued bullish sentiment. ### Significance of the 50.0% Level The 50.0% Fibonacci retracement level is widely regarded as a crucial threshold in technical analysis. It often serves as a battleground for buyers and sellers. Given the current uptrend, a bounce from this level could validate the bullish momentum, propelling the price back toward the swing high of 1.42474. ### Key Support and Resistance Zones Immediate support is identified at the 50.0% level (1.38639). Should the price decline below this level, the next significant support lies at the 61.8% level at 1.37735, which could attract buyers looking for value. Conversely, resistance is expected near the 38.2% level at 1.39544, followed by the 23.6% level at 1.40664, providing potential profit-taking zones for traders. ### Potential Trading Implications Traders should watch for a potential bounce at the 50.0% level. A confirmed rebound could present a buying opportunity with targets set at the 38.2% level and beyond. Conversely, a decisive break below 1.38639 may invalidate the bullish outlook, prompting a reassessment of market positions. ### Important Levels to Watch Key levels to monitor include 1.38639 (50.0% support), 1.39544 (38.2% resistance), and 1.37735 (61.8% support). These levels will be crucial in determining the next directional move for USD/CAD.
Fibonacci Levels
| Level | Price | Distance | Status |
|---|---|---|---|
| 0.0% | 1.42474 | +0.03786 (+2.73%) | ↑ RESISTANCE |
| 23.6% | 1.40664 | +0.01976 (+1.42%) | ↑ RESISTANCE |
| 38.2% | 1.39544 | +0.00856 (+0.62%) | ↑ RESISTANCE |
| 50.0% | 1.38639 | -0.00049 (-0.03%) | ↓ SUPPORT |
| 61.8% | 1.37735 | -0.00953 (-0.69%) | ↓ SUPPORT |
| 78.6% | 1.36446 | -0.02242 (-1.62%) | ↓ SUPPORT |
| 100.0% | 1.34805 | -0.03883 (-2.80%) | ↓ SUPPORT |
GBP/USD - British Pound / U.S. Dollar
Trading at 1.35318 (-0.12% today), GBP/USD is also showing interesting positioning near the 38.2% level (only 0.06% away).
The GBP/USD is currently trading at 1.35318, positioned just 0.06% below the 38.2% Fibonacci retracement level at 1.35398, indicative of a strong bullish sentiment following the recent uptrend from the swing low of 1.30093 to the swing high of 1.38677. The proximity to the 38.2% level suggests it may act as a significant support zone, where buyers could enter the market, potentially driving prices higher. Should the price breach this level, the next key resistance lies at the 23.6% level of 1.36651, representing a 0.99% upside. Conversely, if the price retraces, the 50.0% level at 1.34385 serves as a critical support point, with a downside risk of about 0.69%. Traders should monitor these levels closely, as a bounce from the 38.2% level may lead to a retest of the recent high, while a break below 1.34385 could signal a shift in momentum.
Fibonacci Levels
| Level | Price | Distance | Status |
|---|---|---|---|
| 0.0% | 1.38677 | +0.03359 (+2.48%) | ↑ RESISTANCE |
| 23.6% | 1.36651 | +0.01333 (+0.99%) | ↑ RESISTANCE |
| 38.2% | 1.35398 | +0.00080 (+0.06%) | ↑ RESISTANCE |
| 50.0% | 1.34385 | -0.00933 (-0.69%) | ↓ SUPPORT |
| 61.8% | 1.33372 | -0.01946 (-1.44%) | ↓ SUPPORT |
| 78.6% | 1.31930 | -0.03388 (-2.50%) | ↓ SUPPORT |
| 100.0% | 1.30093 | -0.05225 (-3.86%) | ↓ SUPPORT |
Key Takeaways
- USD/CAD is positioned near the 50.0% Fibonacci level, a historically significant price zone
- GBP/USD is also testing the 38.2% retracement level
- These Fibonacci levels often act as dynamic support and resistance zones
- Traders should monitor price action at these levels for potential trading opportunities
- Risk management remains crucial when trading near Fibonacci retracement levels
Disclaimer
The content on MarketsFN.com is provided for educational and informational purposes only. It does not constitute financial advice, investment recommendations, or trading guidance. All investments involve risks, and past performance does not guarantee future results. You are solely responsible for your investment decisions and should conduct independent research and consult a qualified financial advisor before acting. MarketsFN.com and its authors are not liable for any losses or damages arising from your use of this information.


