Fibonacci Retracement Analysis: USD/CAD and EUR/USD Near Key Levels
MarketsFN Team
Fibonacci Retracement Analysis: USD/CAD and EUR/USD Near Key Levels
Published: August 28, 2026
Market Overview
Central banks in Asia are increasingly seen as risk managers, influencing currency volatility amid global uncertainties. The Euro is currently in a consolidation phase against the US Dollar, which remains muted ahead of key speeches, while the Japanese Yen continues to weaken despite positive economic indicators. Meanwhile, the Australian Dollar is poised for gains as rising inflation raises expectations for interest rate hikes by the Reserve Bank of Australia.
USD/CAD - U.S. Dollar / Canadian Dollar
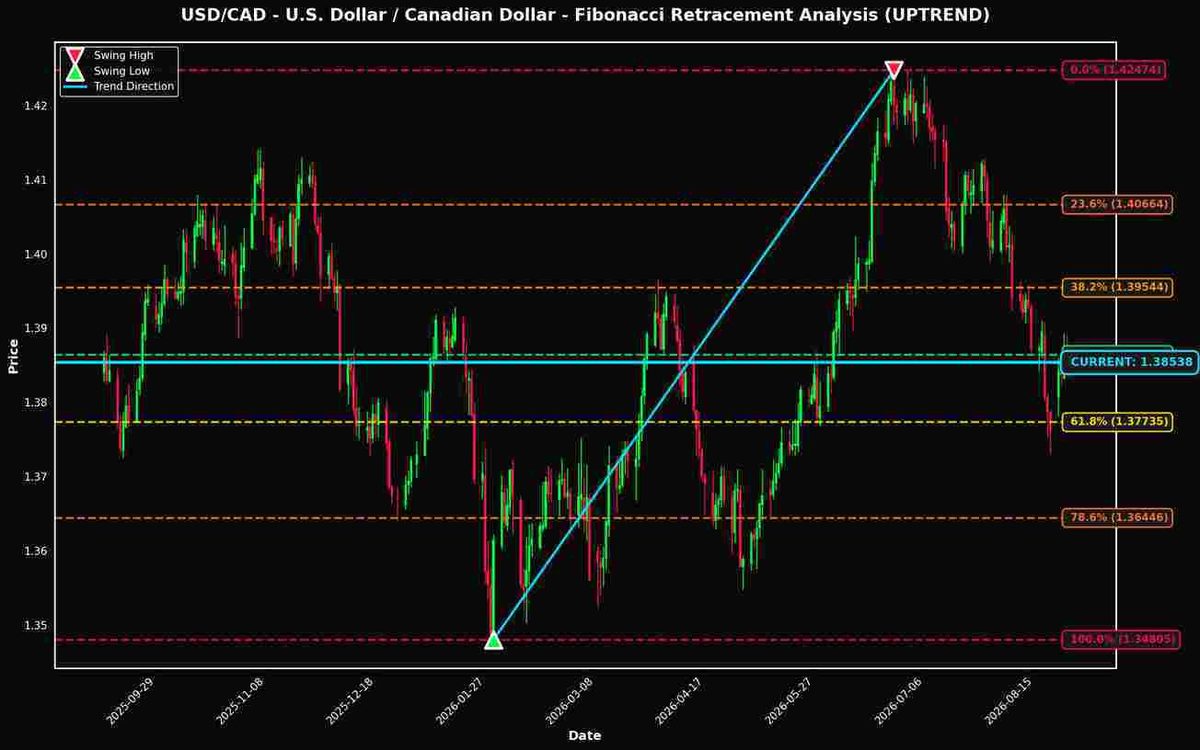
Currently trading at 1.38538 (-0.01% today), USD/CAD is positioned just 0.07% away from the critical 50.0% Fibonacci retracement level, making it a pair to watch closely.

Technical Analysis
**Technical Analysis of USD/CAD Using Fibonacci Retracement Levels** As of the latest market data, USD/CAD is trading at 1.38538, firmly within an uptrend after rebounding from a significant swing low of 1.34805. The current price is notably positioned just 0.07% below the critical 50.0% Fibonacci retracement level at 1.38639, suggesting a pivotal moment for traders. The proximity to the 50.0% retracement level is particularly significant, as this level often acts as a psychological barrier and a strong potential support zone in an uptrend. If the price successfully breaks above this level, it could indicate renewed buying momentum, potentially leading the pair towards the next resistance at the 38.2% level (1.39544), followed closely by the 23.6% level at 1.40664. In terms of key support and resistance zones, the immediate support can be observed at the 61.8% level (1.37735), which is approximately 0.58% below the current price. This level, coupled with the previous swing low at 1.34805, forms a robust support area that traders should monitor. Conversely, resistance is anticipated at the 38.2% retracement level (1.39544) and the psychological resistance at 1.40000, which could serve as a barrier to further upward movement. From a trading perspective, the proximity to the 50.0% level presents a potential buying opportunity, especially if the price closes above this point on strong volume. Conversely, a failure to hold above this level could prompt a retracement back towards the 61.8% level. In summary, traders should watch the following key levels: the 50.0% retracement (1.38639) as a critical pivot, with support at 1.37735 and resistance at 1.39544. Monitoring these levels will be essential for formulating a strategy in the evolving market landscape.
Fibonacci Levels
| Level | Price | Distance | Status |
|---|---|---|---|
| 0.0% | 1.42474 | +0.03936 (+2.84%) | ↑ RESISTANCE |
| 23.6% | 1.40664 | +0.02126 (+1.53%) | ↑ RESISTANCE |
| 38.2% | 1.39544 | +0.01006 (+0.73%) | ↑ RESISTANCE |
| 50.0% | 1.38639 | +0.00101 (+0.07%) | ↑ RESISTANCE |
| 61.8% | 1.37735 | -0.00803 (-0.58%) | ↓ SUPPORT |
| 78.6% | 1.36446 | -0.02092 (-1.51%) | ↓ SUPPORT |
| 100.0% | 1.34805 | -0.03733 (-2.69%) | ↓ SUPPORT |
EUR/USD - Euro / U.S. Dollar
Trading at 1.16442 (-0.06% today), EUR/USD is also showing interesting positioning near the 38.2% level (only 0.26% away).
As of the current market data, EUR/USD is trading at 1.16442, positioned just 0.26% below the critical 38.2% Fibonacci retracement level at 1.16135, indicating a significant area of interest in this downtrend. The proximity to this level suggests potential for a bounce or reversal, given its historical role as a support zone. Should the price break below the 38.2% level, the next key support is the 50.0% level at 1.17030, while resistance can be found at the 23.6% level of 1.15029 and the 61.8% level at 1.17924. Traders should closely monitor the price action around 1.16135; a rejection here could lead to a short-term rally, but a decisive breach may signal continuation of the downtrend towards the 50.0% level. Key levels to watch include the 38.2% and 50.0% Fibonacci retracement levels for potential trading opportunities.
Fibonacci Levels
| Level | Price | Distance | Status |
|---|---|---|---|
| 100.0% | 1.20819 | +0.04377 (+3.76%) | ↑ RESISTANCE |
| 78.6% | 1.19197 | +0.02755 (+2.37%) | ↑ RESISTANCE |
| 61.8% | 1.17924 | +0.01482 (+1.27%) | ↑ RESISTANCE |
| 50.0% | 1.17030 | +0.00588 (+0.50%) | ↑ RESISTANCE |
| 38.2% | 1.16135 | -0.00307 (-0.26%) | ↓ SUPPORT |
| 23.6% | 1.15029 | -0.01413 (-1.21%) | ↓ SUPPORT |
| 0.0% | 1.13240 | -0.03202 (-2.75%) | ↓ SUPPORT |
Key Takeaways
- USD/CAD is positioned near the 50.0% Fibonacci level, a historically significant price zone
- EUR/USD is also testing the 38.2% retracement level
- These Fibonacci levels often act as dynamic support and resistance zones
- Traders should monitor price action at these levels for potential trading opportunities
- Risk management remains crucial when trading near Fibonacci retracement levels
Disclaimer
The content on MarketsFN.com is provided for educational and informational purposes only. It does not constitute financial advice, investment recommendations, or trading guidance. All investments involve risks, and past performance does not guarantee future results. You are solely responsible for your investment decisions and should conduct independent research and consult a qualified financial advisor before acting. MarketsFN.com and its authors are not liable for any losses or damages arising from your use of this information.


