Fibonacci Retracement Analysis: NZD/USD and USD/JPY Near Key Levels
MarketsFN Team
Fibonacci Retracement Analysis: NZD/USD and USD/JPY Near Key Levels
Published: September 15, 2026
Market Overview
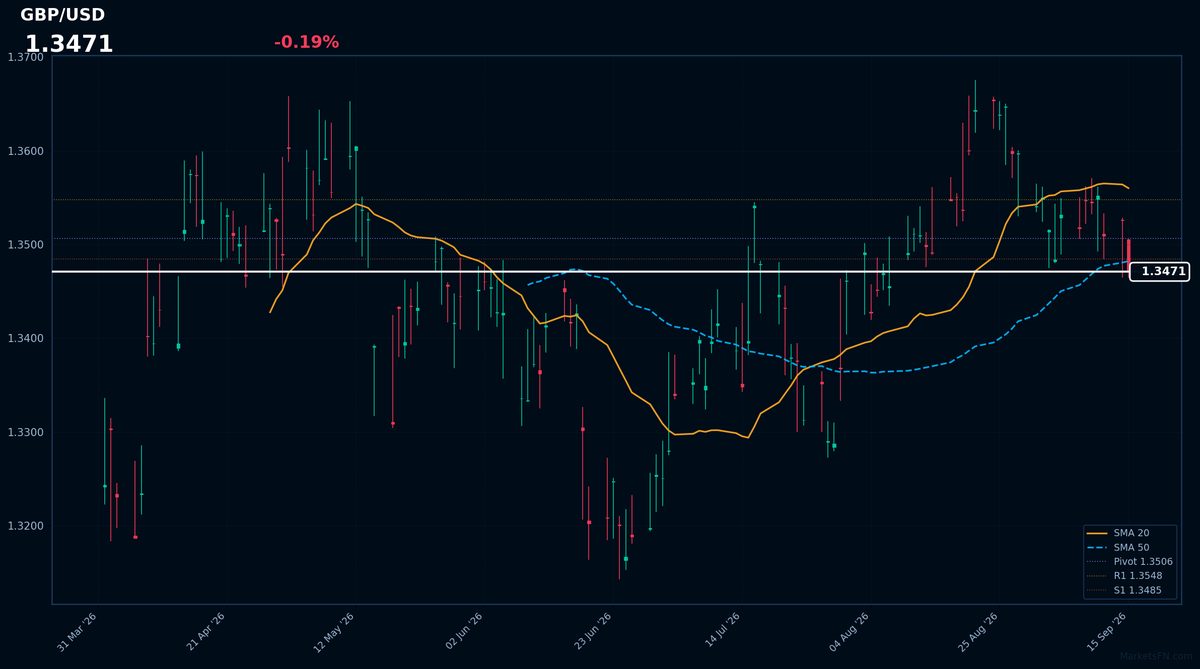
The US Dollar Index is targeting a confluence hurdle at 99.80 as market attention centers on potential Federal Reserve policy shifts. Meanwhile, the British Pound weakened after disappointing UK employment data, contributing to the Euro's slight recovery. Asian currencies, including the Japanese yen, faced downward pressure ahead of upcoming decisions from the Fed and the Bank of Japan, while the Canadian dollar remained near a 12-day low, struggling to gain traction despite oil's structural tightness.
NZD/USD - New Zealand Dollar / U.S. Dollar
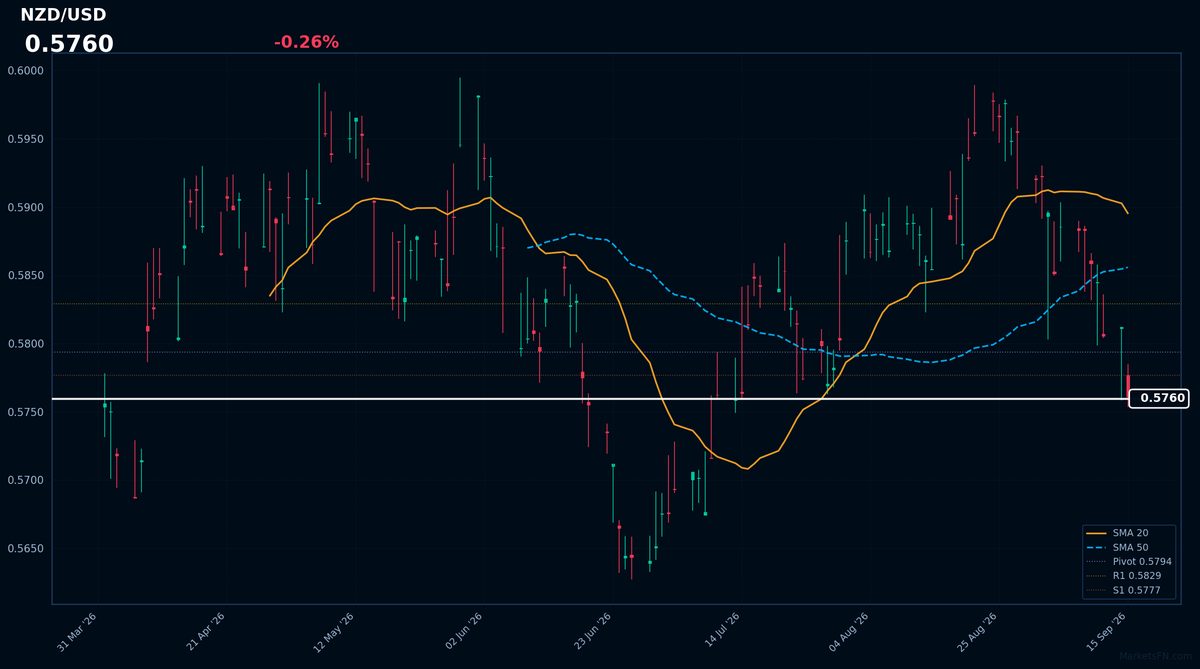
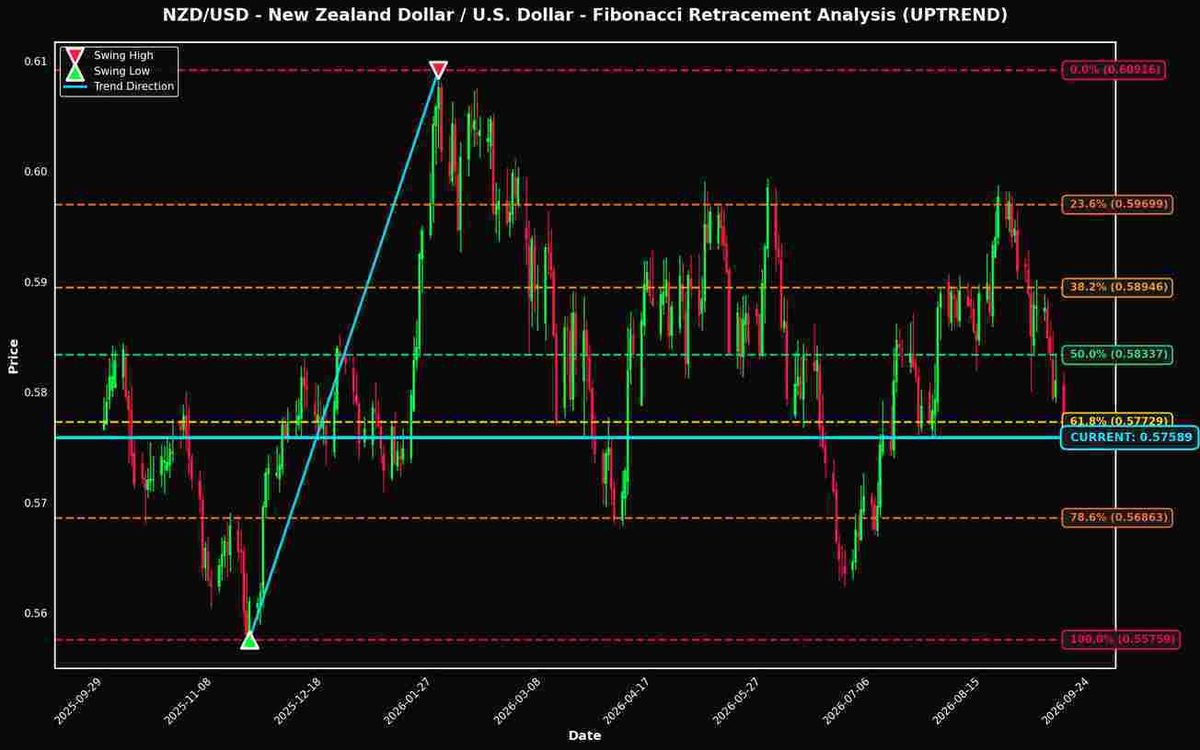
Currently trading at 0.57589 (-0.27% today), NZD/USD is positioned just 0.24% away from the critical 61.8% Fibonacci retracement level, making it a pair to watch closely.

Technical Analysis
### Technical Analysis of NZD/USD Using Fibonacci Retracement Levels The current market data for NZD/USD indicates a price of 0.57589, which positions the pair just above the critical 61.8% Fibonacci retracement level at 0.57729. This retracement level is widely regarded as a key area of support, often acting as a decision point for traders. Being only 0.24% away from this level suggests an imminent test of support, which could influence short-term price action. The significance of the 61.8% level cannot be overstated. This Fibonacci ratio is considered one of the most reliable retracement levels, where many traders anticipate either a reversal or a continuation of the prevailing trend. Given the current uptrend, a successful hold above this level may reaffirm bullish sentiment, potentially propelling prices toward the next key resistance at the 50.0% retracement level of 0.58337, which lies 1.30% above the current price. Key support zones are established at 0.57729 (61.8%) and further at 0.56863 (78.6%), should the price fall below the 61.8% retracement. Conversely, the primary resistance zones are positioned at 0.58337 (50.0%) and 0.58946 (38.2%). A breakthrough above 0.58337 would enhance bullish momentum, opening the path toward the swing high at 0.60916. From a trading perspective, traders should monitor the price action closely around the 61.8% level. A bounce off this level could provide a buying opportunity, while a decisive close below it may necessitate a reassessment of bullish positions. Important levels to watch include 0.57729 for immediate support and 0.58337 for resistance. The market dynamics in these zones could dictate the near-term trajectory of NZD/USD, warranting careful observation and strategic positioning.
Fibonacci Levels
| Level | Price | Distance | Status |
|---|---|---|---|
| 0.0% | 0.60916 | +0.03327 (+5.78%) | ↑ RESISTANCE |
| 23.6% | 0.59699 | +0.02110 (+3.66%) | ↑ RESISTANCE |
| 38.2% | 0.58946 | +0.01357 (+2.36%) | ↑ RESISTANCE |
| 50.0% | 0.58337 | +0.00748 (+1.30%) | ↑ RESISTANCE |
| 61.8% | 0.57729 | +0.00140 (+0.24%) | ↑ RESISTANCE |
| 78.6% | 0.56863 | -0.00726 (-1.26%) | ↓ SUPPORT |
| 100.0% | 0.55759 | -0.01830 (-3.18%) | ↓ SUPPORT |
USD/JPY - U.S. Dollar / Japanese Yen
Trading at 154.87900 (+0.35% today), USD/JPY is also showing interesting positioning near the 50.0% level (only 0.26% away).
The current price of USD/JPY at 154.879 is positioned close to the 50.0% Fibonacci retracement level of 155.28350, only 0.26% away. This proximity suggests a potential pivot point where buyers may step in, reinforcing the prevailing uptrend. The significance of the 50.0% level lies in its psychological importance, often serving as a critical support zone. Key support can be found at the 61.8% retracement level of 153.23018, while resistance is noted at the 38.2% level of 157.33682. Should the price break below the 50.0% level, the next support at 61.8% may come into play, indicating a possible shift in momentum. Traders should watch for price action around these levels to gauge sentiment. A bounce off the 50.0% level could provide a buying opportunity, while a sustained breach below may signal a deeper correction towards the 61.8% level.
Fibonacci Levels
| Level | Price | Distance | Status |
|---|---|---|---|
| 0.0% | 163.98400 | +9.10500 (+5.88%) | ↑ RESISTANCE |
| 23.6% | 159.87736 | +4.99836 (+3.23%) | ↑ RESISTANCE |
| 38.2% | 157.33682 | +2.45782 (+1.59%) | ↑ RESISTANCE |
| 50.0% | 155.28350 | +0.40450 (+0.26%) | ↑ RESISTANCE |
| 61.8% | 153.23018 | -1.64882 (-1.06%) | ↓ SUPPORT |
| 78.6% | 150.30681 | -4.57219 (-2.95%) | ↓ SUPPORT |
| 100.0% | 146.58300 | -8.29600 (-5.36%) | ↓ SUPPORT |
Key Takeaways
- NZD/USD is positioned near the 61.8% Fibonacci level, a historically significant price zone
- USD/JPY is also testing the 50.0% retracement level
- These Fibonacci levels often act as dynamic support and resistance zones
- Traders should monitor price action at these levels for potential trading opportunities
- Risk management remains crucial when trading near Fibonacci retracement levels
Disclaimer
The content on MarketsFN.com is provided for educational and informational purposes only. It does not constitute financial advice, investment recommendations, or trading guidance. All investments involve risks, and past performance does not guarantee future results. You are solely responsible for your investment decisions and should conduct independent research and consult a qualified financial advisor before acting. MarketsFN.com and its authors are not liable for any losses or damages arising from your use of this information.