Fibonacci Retracement Analysis: NZD/USD and USD/CAD Near Key Levels
MarketsFN Team
Fibonacci Retracement Analysis: NZD/USD and USD/CAD Near Key Levels
Published: September 02, 2026
Market Overview
Risk aversion is dominating forex markets as escalating tensions in the Middle East drive investors toward safe-haven assets, boosting the US Dollar. The Australian Dollar is expected to retreat toward 0.7120 against the USD, while the Euro is facing downward pressure against the Japanese Yen due to speculation of potential US-Japan intervention. Overall, Asian currencies are weakening as the Dollar steadies, and both the Euro and Pound are slipping amid the prevailing uncertainty.
NZD/USD - New Zealand Dollar / U.S. Dollar
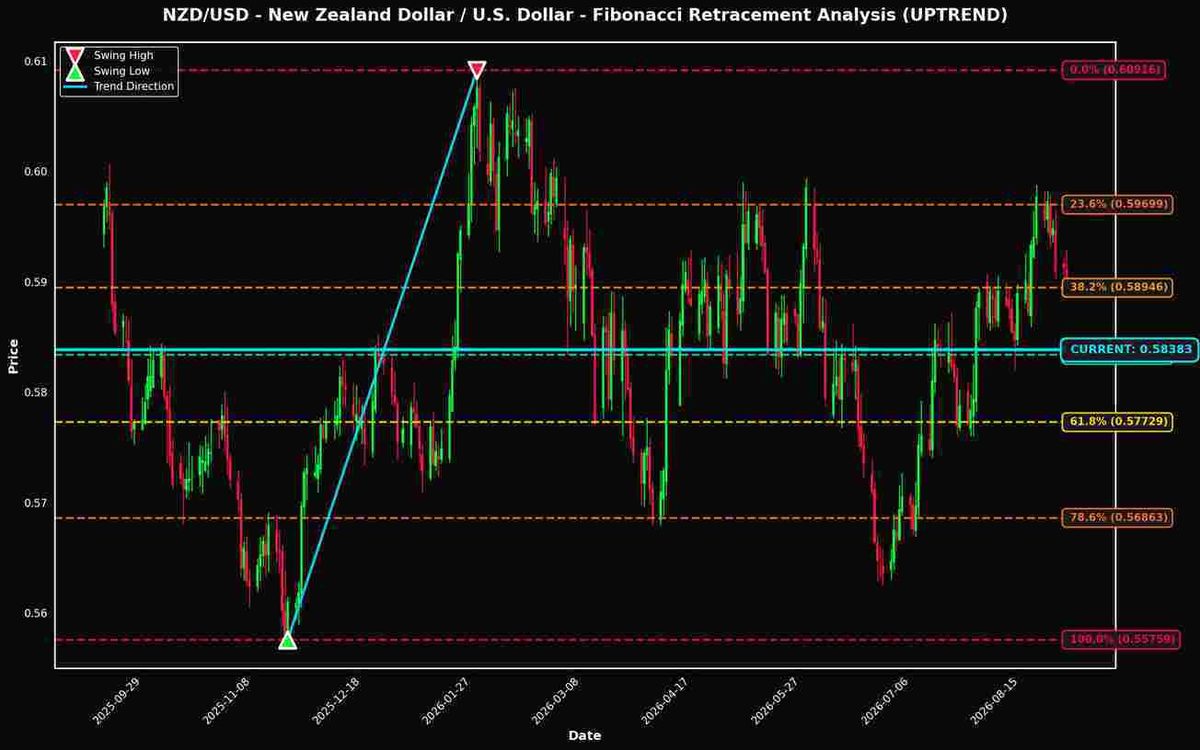
Currently trading at 0.58383 (-0.89% today), NZD/USD is positioned just 0.08% away from the critical 50.0% Fibonacci retracement level, making it a pair to watch closely.

Technical Analysis
**Technical Analysis of NZD/USD Using Fibonacci Retracement Levels** As of the latest market data, the NZD/USD currency pair is trading at 0.58383, positioning itself just marginally above the 50.0% Fibonacci retracement level at 0.58337. This retracement level is crucial as it often acts as a significant psychological barrier for traders, marking a midpoint in the recent bullish movement from the swing low of 0.55759 to the swing high of 0.60916. The proximity of the current price to this level (only 0.08% away) indicates potential volatility, as traders may react to this critical juncture. The 50.0% Fibonacci retracement is particularly significant because it is commonly viewed as a strong support level during uptrends. If the price holds above this level, it could indicate a continuation of the bullish trend, with the next key resistance likely at the 38.2% level (0.58946), just 0.96% higher. Conversely, a decisive breach below the 50.0% level could open the door to further downside, targeting the 61.8% Fibonacci level at 0.57729, which would provide a more substantial support zone. In terms of trading implications, maintaining a position above the 50.0% level could attract bullish sentiment, potentially leading to a test of the 23.6% retracement level at 0.59699, which poses a critical resistance point. Traders should be vigilant for a breakout above this level, as it could signal a renewed upward trend. Key levels to watch include the immediate support at 0.58337 (50.0%), followed by the more robust support at 0.57729 (61.8%). On the resistance side, focus on 0.58946 (38.2%) and 0.59699 (23.6%). Monitoring price action around these levels will be crucial for positioning in the upcoming sessions.
Fibonacci Levels
| Level | Price | Distance | Status |
|---|---|---|---|
| 0.0% | 0.60916 | +0.02533 (+4.34%) | ↑ RESISTANCE |
| 23.6% | 0.59699 | +0.01316 (+2.25%) | ↑ RESISTANCE |
| 38.2% | 0.58946 | +0.00563 (+0.96%) | ↑ RESISTANCE |
| 50.0% | 0.58337 | -0.00045 (-0.08%) | ↓ SUPPORT |
| 61.8% | 0.57729 | -0.00654 (-1.12%) | ↓ SUPPORT |
| 78.6% | 0.56863 | -0.01520 (-2.60%) | ↓ SUPPORT |
| 100.0% | 0.55759 | -0.02624 (-4.49%) | ↓ SUPPORT |
USD/CAD - U.S. Dollar / Canadian Dollar
Trading at 1.39233 (+0.37% today), USD/CAD is also showing interesting positioning near the 38.2% level (only 0.22% away).
As of the current price of 1.39233, USD/CAD is positioned near the significant 38.2% Fibonacci retracement level at 1.39544, only 0.22% away. This proximity indicates a critical juncture where buyers may seek to establish momentum within the prevailing uptrend, particularly as the market tests this retracement level. The 38.2% level is often regarded as a strong support zone, which, if held, could facilitate a continuation of the uptrend toward the 23.6% level at 1.40664 and potentially the 0.0% level (swing high) at 1.42474. Conversely, a break below the 50.0% level at 1.38639 would signal a shift in momentum and could lead to testing deeper retracement levels at 61.8% (1.37735) and beyond. Traders should monitor these key levels closely for potential entry or exit points, with the 38.2% level acting as a crucial pivot. A failure to hold this support could indicate a bearish reversal.
Fibonacci Levels
| Level | Price | Distance | Status |
|---|---|---|---|
| 0.0% | 1.42474 | +0.03241 (+2.33%) | ↑ RESISTANCE |
| 23.6% | 1.40664 | +0.01431 (+1.03%) | ↑ RESISTANCE |
| 38.2% | 1.39544 | +0.00311 (+0.22%) | ↑ RESISTANCE |
| 50.0% | 1.38639 | -0.00594 (-0.43%) | ↓ SUPPORT |
| 61.8% | 1.37735 | -0.01498 (-1.08%) | ↓ SUPPORT |
| 78.6% | 1.36446 | -0.02787 (-2.00%) | ↓ SUPPORT |
| 100.0% | 1.34805 | -0.04428 (-3.18%) | ↓ SUPPORT |
Key Takeaways
- NZD/USD is positioned near the 50.0% Fibonacci level, a historically significant price zone
- USD/CAD is also testing the 38.2% retracement level
- These Fibonacci levels often act as dynamic support and resistance zones
- Traders should monitor price action at these levels for potential trading opportunities
- Risk management remains crucial when trading near Fibonacci retracement levels
Disclaimer
The content on MarketsFN.com is provided for educational and informational purposes only. It does not constitute financial advice, investment recommendations, or trading guidance. All investments involve risks, and past performance does not guarantee future results. You are solely responsible for your investment decisions and should conduct independent research and consult a qualified financial advisor before acting. MarketsFN.com and its authors are not liable for any losses or damages arising from your use of this information.


