Fibonacci Retracement Analysis: NZD/USD and GBP/USD Near Key Levels
MarketsFN Team
Fibonacci Retracement Analysis: NZD/USD and GBP/USD Near Key Levels
Published: July 28, 2026
Market Overview
The US Dollar is gaining strength ahead of the FOMC meeting, driven by hawkish expectations, which is impacting Asian currencies negatively. The Swiss Franc has weakened due to diminishing safe-haven demand and US tariffs, while the USD/JPY and USD/CAD are experiencing heightened volatility, with the yen falling to a 40-year low. Additionally, gold prices are being supported by declining oil prices and lower yields.
NZD/USD - New Zealand Dollar / U.S. Dollar
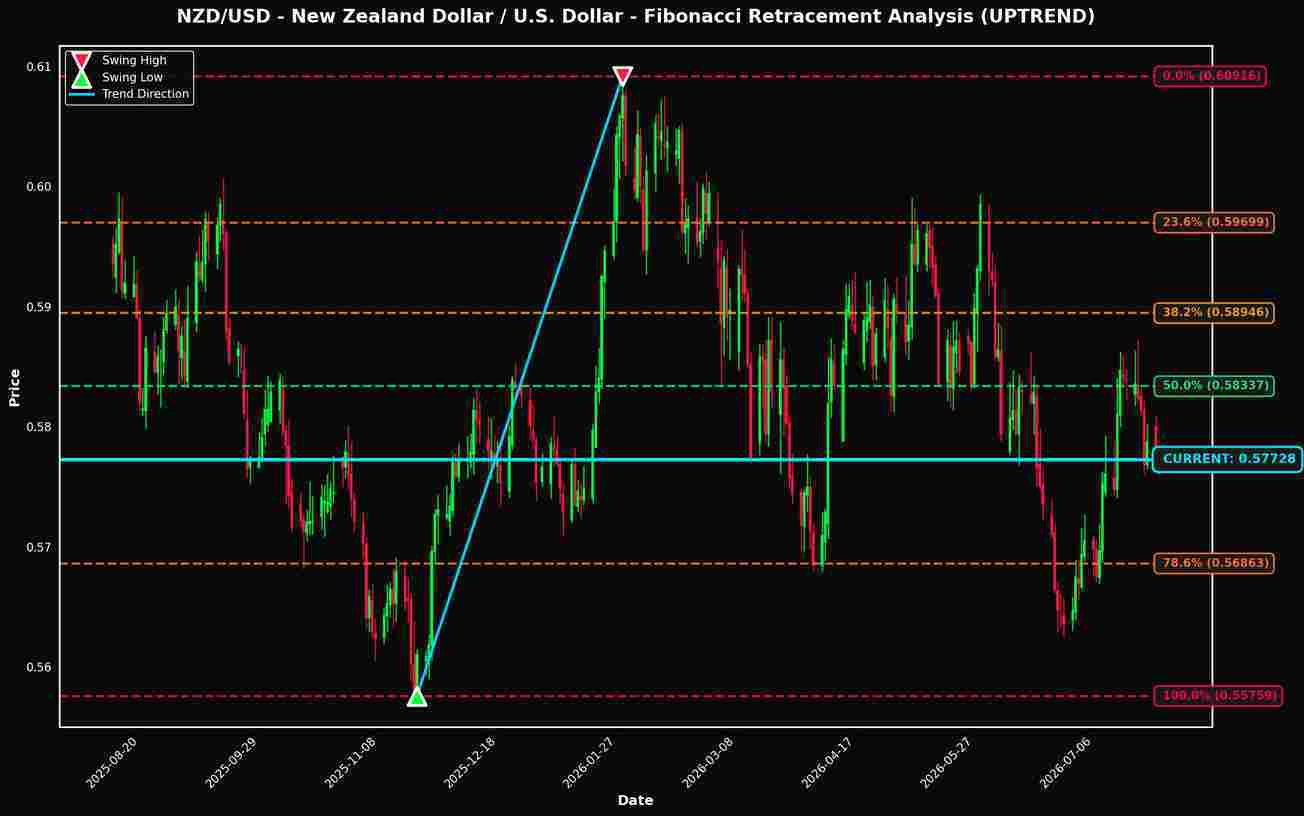
Currently trading at 0.57728 (+0.03% today), NZD/USD is positioned just 0.00% away from the critical 61.8% Fibonacci retracement level, making it a pair to watch closely.

Technical Analysis
### Technical Analysis of NZD/USD Using Fibonacci Retracement Levels The NZD/USD pair is currently positioned at 0.57728, firmly in an uptrend. Analyzing the Fibonacci retracement levels drawn from the recent swing high at 0.60916 to the swing low at 0.55759, we note that the price is nearly at the 61.8% retracement level, specifically at 0.57729—just 0.01% away. This proximity to the 61.8% level is crucial, as this Fibonacci level is often regarded as a strong point of support or resistance due to its historical significance in technical analysis. Being at the 61.8% level indicates a potential pivot point where buyers may step in, leading to a continuation of the uptrend if the level holds. Conversely, a failure to maintain above this level could signal a retracement towards the 50.0% level at 0.58337 or even the 38.2% level at 0.58946, reinforcing these areas as critical support zones. In terms of resistance, the next significant level above the current price is the 23.6% retracement at 0.59699, which is approximately 3.41% away. This level may act as a target for bullish traders if the price can successfully bounce off the 61.8% support. From a trading perspective, if the price stabilizes above 0.57729, traders might consider entering long positions with targets set at 0.58946 (38.2% level) and 0.59699 (23.6% level). However, if the price closes below 0.57728, caution is warranted as it may lead to a deeper retracement, with 0.56863 (78.6% level) being a critical support area to monitor. In summary, the key levels to watch are the 61.8% retracement at 0.57729 for support, with potential resistance at 0.58946 and 0.59699. The outcome at this juncture will be pivotal for the short-term direction of NZD/USD.
Fibonacci Levels
| Level | Price | Distance | Status |
|---|---|---|---|
| 0.0% | 0.60916 | +0.03188 (+5.52%) | ↑ RESISTANCE |
| 23.6% | 0.59699 | +0.01971 (+3.41%) | ↑ RESISTANCE |
| 38.2% | 0.58946 | +0.01218 (+2.11%) | ↑ RESISTANCE |
| 50.0% | 0.58337 | +0.00609 (+1.06%) | ↑ RESISTANCE |
| 61.8% | 0.57729 | +0.00001 (+0.00%) | ✓ CURRENT |
| 78.6% | 0.56863 | -0.00865 (-1.50%) | ↓ SUPPORT |
| 100.0% | 0.55759 | -0.01969 (-3.41%) | ↓ SUPPORT |
GBP/USD - British Pound / U.S. Dollar
Trading at 1.33033 (+0.12% today), GBP/USD is also showing interesting positioning near the 61.8% level (only 0.25% away).
The GBP/USD pair is currently trading at 1.33033, positioning itself just 0.25% above the critical 61.8% Fibonacci retracement level at 1.33372. This proximity suggests increased volatility, as the 61.8% level is often seen as a pivotal support point in an uptrend. A breach below this level could indicate a reversal, with potential support at 78.6% (1.31930) becoming the next focal point. On the upside, the next resistance levels are the 50.0% retracement at 1.34385 and the 38.2% level at 1.35398, both of which could attract bullish momentum if the market breaks above the 61.8% level convincingly. Traders should closely monitor the price action around these Fibonacci levels. A sustained close above 1.33372 could signal continuation towards higher targets, while a drop below this key level could prompt reassessment of long positions and signal potential bearish reversals. Key levels to watch are 1.33372, 1.31930, and 1.34385.
Fibonacci Levels
| Level | Price | Distance | Status |
|---|---|---|---|
| 0.0% | 1.38677 | +0.05644 (+4.24%) | ↑ RESISTANCE |
| 23.6% | 1.36651 | +0.03618 (+2.72%) | ↑ RESISTANCE |
| 38.2% | 1.35398 | +0.02365 (+1.78%) | ↑ RESISTANCE |
| 50.0% | 1.34385 | +0.01352 (+1.02%) | ↑ RESISTANCE |
| 61.8% | 1.33372 | +0.00339 (+0.25%) | ↑ RESISTANCE |
| 78.6% | 1.31930 | -0.01103 (-0.83%) | ↓ SUPPORT |
| 100.0% | 1.30093 | -0.02940 (-2.21%) | ↓ SUPPORT |
Key Takeaways
- NZD/USD is positioned near the 61.8% Fibonacci level, a historically significant price zone
- GBP/USD is also testing the 61.8% retracement level
- These Fibonacci levels often act as dynamic support and resistance zones
- Traders should monitor price action at these levels for potential trading opportunities
- Risk management remains crucial when trading near Fibonacci retracement levels
Disclaimer
The content on MarketsFN.com is provided for educational and informational purposes only. It does not constitute financial advice, investment recommendations, or trading guidance. All investments involve risks, and past performance does not guarantee future results. You are solely responsible for your investment decisions and should conduct independent research and consult a qualified financial advisor before acting. MarketsFN.com and its authors are not liable for any losses or damages arising from your use of this information.


