Fibonacci Retracement Analysis: EUR/USD and USD/CAD Near Key Levels
MarketsFN Team
Fibonacci Retracement Analysis: EUR/USD and USD/CAD Near Key Levels
Published: August 24, 2026
Market Overview
The British Pound is currently experiencing range trading, with expectations to test the 1.3700 level against the US Dollar, as analysts at UOB suggest. Meanwhile, the Canadian Dollar is under pressure from ongoing trade conflicts, while the Australian Dollar remains resilient near June highs, buoyed by anticipation of sanctions on Iran. The US Dollar is struggling near three-month lows due to concerns over U.S. debt and geopolitical risks, with its outlook increasingly tied to U.S. Treasury dynamics and Federal Reserve policy credibility.
EUR/USD - Euro / U.S. Dollar
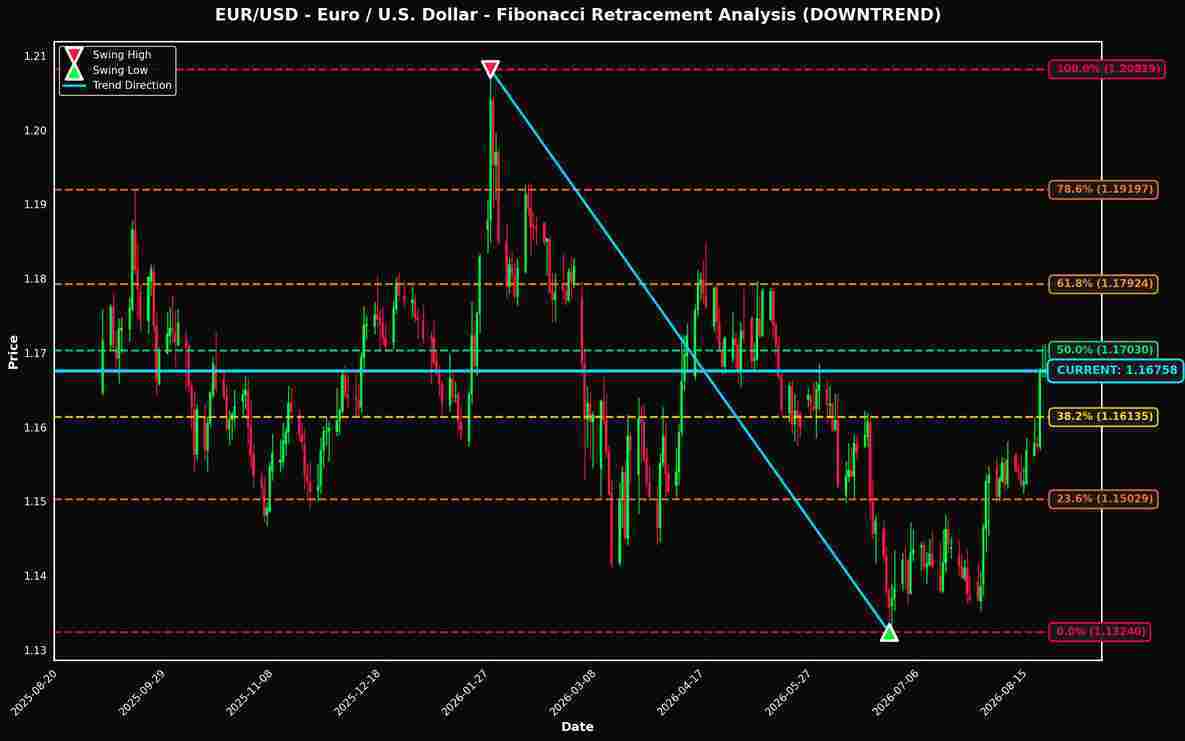
Currently trading at 1.16758 (-0.02% today), EUR/USD is positioned just 0.23% away from the critical 50.0% Fibonacci retracement level, making it a pair to watch closely.

Technical Analysis
**EUR/USD Technical Analysis – Fibonacci Retracement Levels** As of the current market data, EUR/USD is trading at 1.16758, positioned within a confirmed downtrend. The recent swing high is at 1.20819, and the swing low is at 1.13240. The Fibonacci retracement levels provide critical insights into potential price action, with particular emphasis on the proximity of the current price to the 50.0% level, which stands at 1.17030. Currently, EUR/USD is just 0.23% away from the 50.0% retracement level. This level is significant as it often serves as a pivotal point for market reversals or continuation patterns. Typically, in a downtrend, a failure to break above this level may reinforce bearish sentiment, while a successful breach could indicate a potential reversal or a corrective rally. In terms of key support and resistance zones, the immediate resistance above the current price is identified at the 50.0% Fibonacci level (1.17030), followed by the 61.8% level at 1.17924. Conversely, support levels can be observed at 38.2% (1.16135) and the swing low at 1.13240. The 23.6% level at 1.15029 may also provide temporary support in the event of further declines. The proximity to the 50.0% retracement level suggests that traders should closely monitor price action around this area. A rejection at this level may present short-selling opportunities, targeting the next support level at 1.16135. Conversely, a breakout above 1.17030 could signal a shift in momentum, potentially targeting the 61.8% level at 1.17924 as the next resistance. In summary, traders should remain vigilant around the 50.0% Fibonacci level at 1.17030, as it will dictate the next movement in the EUR/USD pair. Important levels to watch include 1.16135 (support) and 1.17924 (resistance).
Fibonacci Levels
| Level | Price | Distance | Status |
|---|---|---|---|
| 100.0% | 1.20819 | +0.04061 (+3.48%) | ↑ RESISTANCE |
| 78.6% | 1.19197 | +0.02439 (+2.09%) | ↑ RESISTANCE |
| 61.8% | 1.17924 | +0.01166 (+1.00%) | ↑ RESISTANCE |
| 50.0% | 1.17030 | +0.00272 (+0.23%) | ↑ RESISTANCE |
| 38.2% | 1.16135 | -0.00623 (-0.53%) | ↓ SUPPORT |
| 23.6% | 1.15029 | -0.01729 (-1.48%) | ↓ SUPPORT |
| 0.0% | 1.13240 | -0.03518 (-3.01%) | ↓ SUPPORT |
USD/CAD - U.S. Dollar / Canadian Dollar
Trading at 1.38251 (+0.44% today), USD/CAD is also showing interesting positioning near the 50.0% level (only 0.28% away).
The current price of USD/CAD at 1.38251 is strategically positioned near the 50.0% Fibonacci retracement level at 1.38639, just 0.28% away. This proximity suggests a critical support zone, where buyer interest may strengthen, potentially leading to a bounce back towards the 38.2% level at 1.39544 or even the 23.6% level at 1.40664. The significance of the 50.0% level cannot be overstated; it often acts as a decisive pivot in trending markets, indicating a possible continuation of the uptrend if it holds. Conversely, a break below this level could signal a shift in momentum towards the 61.8% level at 1.37735, which would serve as the next key support. Traders should watch for price action around these levels, as a confirmed bounce at 1.38639 could present a buying opportunity, while a decisive break below may necessitate a reevaluation of bullish positions. Key levels to monitor include 1.38639, 1.37735, and upward targets at 1.39544 and 1.40664.
Fibonacci Levels
| Level | Price | Distance | Status |
|---|---|---|---|
| 0.0% | 1.42474 | +0.04223 (+3.05%) | ↑ RESISTANCE |
| 23.6% | 1.40664 | +0.02413 (+1.75%) | ↑ RESISTANCE |
| 38.2% | 1.39544 | +0.01293 (+0.94%) | ↑ RESISTANCE |
| 50.0% | 1.38639 | +0.00388 (+0.28%) | ↑ RESISTANCE |
| 61.8% | 1.37735 | -0.00516 (-0.37%) | ↓ SUPPORT |
| 78.6% | 1.36446 | -0.01805 (-1.31%) | ↓ SUPPORT |
| 100.0% | 1.34805 | -0.03446 (-2.49%) | ↓ SUPPORT |
Key Takeaways
- EUR/USD is positioned near the 50.0% Fibonacci level, a historically significant price zone
- USD/CAD is also testing the 50.0% retracement level
- These Fibonacci levels often act as dynamic support and resistance zones
- Traders should monitor price action at these levels for potential trading opportunities
- Risk management remains crucial when trading near Fibonacci retracement levels
Disclaimer
The content on MarketsFN.com is provided for educational and informational purposes only. It does not constitute financial advice, investment recommendations, or trading guidance. All investments involve risks, and past performance does not guarantee future results. You are solely responsible for your investment decisions and should conduct independent research and consult a qualified financial advisor before acting. MarketsFN.com and its authors are not liable for any losses or damages arising from your use of this information.


