Fibonacci Retracement Analysis: EUR/USD and GBP/USD Near Key Levels
MarketsFN Team
Fibonacci Retracement Analysis: EUR/USD and GBP/USD Near Key Levels
Published: September 08, 2026
Market Overview
The Euro rebounded against the Japanese Yen as the European Central Bank's policy remains a key focus, despite dipping after disappointing German Trade Balance data. Meanwhile, Asian currencies strengthened alongside the Yen, which reached a seven-month high amid increasing speculation of a Bank of Japan interest rate hike, while the US Dollar remained subdued.
EUR/USD - Euro / U.S. Dollar
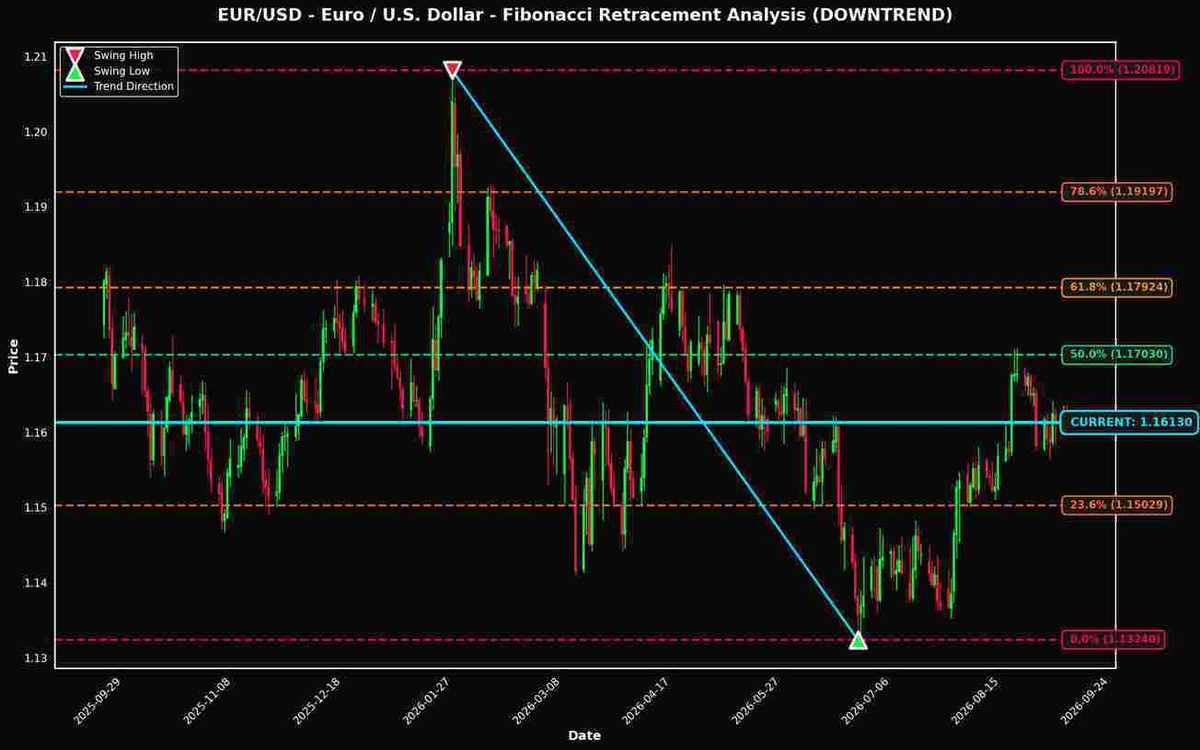
Currently trading at 1.16130 (-0.07% today), EUR/USD is positioned just 0.00% away from the critical 38.2% Fibonacci retracement level, making it a pair to watch closely.

Technical Analysis
### Technical Analysis of EUR/USD Using Fibonacci Retracement Levels As of the current market data, EUR/USD is trading at 1.16130, positioned just below the critical 38.2% Fibonacci retracement level at 1.16135. This indicates the market is poised for potential volatility as it approaches a key resistance zone, suggesting that traders should remain vigilant. The proximity to the 38.2% level is significant for several reasons. This Fibonacci retracement level is often viewed as a pivotal point where price reversals can occur, especially in a downtrend. Given the prevailing downtrend from the swing high of 1.20819 to the swing low of 1.13240, the failure to break above this level could reinforce bearish sentiment, potentially leading to further downside. Key support and resistance zones are critical for traders in this context. The immediate resistance is established at the 38.2% level (1.16135) and further up at the 50.0% level (1.17030). If the price fails to surpass these levels, traders may look for selling opportunities, especially if it moves back towards the swing low of 1.13240. On the downside, the support levels are prominently situated at 23.6% (1.15029) and 0.0% (1.13240), which could become critical if the market reverses. Potential trading implications suggest that if EUR/USD fails to break the 38.2% resistance, a short position could be initiated with targets set around 1.15029 and 1.13240. Conversely, a breakthrough above 1.17030 could invalidate the downtrend scenario, inviting a rally towards higher Fibonacci levels like 61.8% (1.17924) and 78.6% (1.19197). In summary, traders should closely monitor the 38.2% Fibonacci level (1.16135) for signs of reversal or continuation, while keeping an eye on support at 1.15029 and resistance at 1.17030 for their trading strategies.
Fibonacci Levels
| Level | Price | Distance | Status |
|---|---|---|---|
| 100.0% | 1.20819 | +0.04689 (+4.04%) | ↑ RESISTANCE |
| 78.6% | 1.19197 | +0.03067 (+2.64%) | ↑ RESISTANCE |
| 61.8% | 1.17924 | +0.01794 (+1.54%) | ↑ RESISTANCE |
| 50.0% | 1.17030 | +0.00900 (+0.77%) | ↑ RESISTANCE |
| 38.2% | 1.16135 | +0.00005 (+0.00%) | ↑ RESISTANCE |
| 23.6% | 1.15029 | -0.01101 (-0.95%) | ↓ SUPPORT |
| 0.0% | 1.13240 | -0.02890 (-2.49%) | ↓ SUPPORT |
GBP/USD - British Pound / U.S. Dollar
Trading at 1.35340 (-0.09% today), GBP/USD is also showing interesting positioning near the 38.2% level (only 0.04% away).
As of the current price of 1.35340, GBP/USD is positioned just below the critical 38.2% Fibonacci retracement level at 1.35398, indicating a potential resistance zone. This proximity suggests that a breakout above this level could signal renewed bullish momentum, targeting the 23.6% retracement at 1.36651, a gain of approximately 0.97%. Conversely, if the price fails to breach the 38.2% level, traders should monitor the 50.0% retracement at 1.34385 as a key support area, which represents a potential reversal point. A drop below this level could lead to further declines towards the 61.8% level at 1.33372. The significance of the 38.2% level lies in its historical role as a retracement point where buyers often step in. Traders should watch the 1.38677 swing high as the upper resistance, while the swing low at 1.30093 marks critical support. Overall, a bullish scenario favors a move towards the 1.36651 level, while bearish implications arise if 1.34385 fails to hold.
Fibonacci Levels
| Level | Price | Distance | Status |
|---|---|---|---|
| 0.0% | 1.38677 | +0.03337 (+2.47%) | ↑ RESISTANCE |
| 23.6% | 1.36651 | +0.01311 (+0.97%) | ↑ RESISTANCE |
| 38.2% | 1.35398 | +0.00058 (+0.04%) | ↑ RESISTANCE |
| 50.0% | 1.34385 | -0.00955 (-0.71%) | ↓ SUPPORT |
| 61.8% | 1.33372 | -0.01968 (-1.45%) | ↓ SUPPORT |
| 78.6% | 1.31930 | -0.03410 (-2.52%) | ↓ SUPPORT |
| 100.0% | 1.30093 | -0.05247 (-3.88%) | ↓ SUPPORT |
Key Takeaways
- EUR/USD is positioned near the 38.2% Fibonacci level, a historically significant price zone
- GBP/USD is also testing the 38.2% retracement level
- These Fibonacci levels often act as dynamic support and resistance zones
- Traders should monitor price action at these levels for potential trading opportunities
- Risk management remains crucial when trading near Fibonacci retracement levels
Disclaimer
The content on MarketsFN.com is provided for educational and informational purposes only. It does not constitute financial advice, investment recommendations, or trading guidance. All investments involve risks, and past performance does not guarantee future results. You are solely responsible for your investment decisions and should conduct independent research and consult a qualified financial advisor before acting. MarketsFN.com and its authors are not liable for any losses or damages arising from your use of this information.

