EUR/USD: Up 0.18% to 1.1587 — Descending Channel
MarketsFN Team
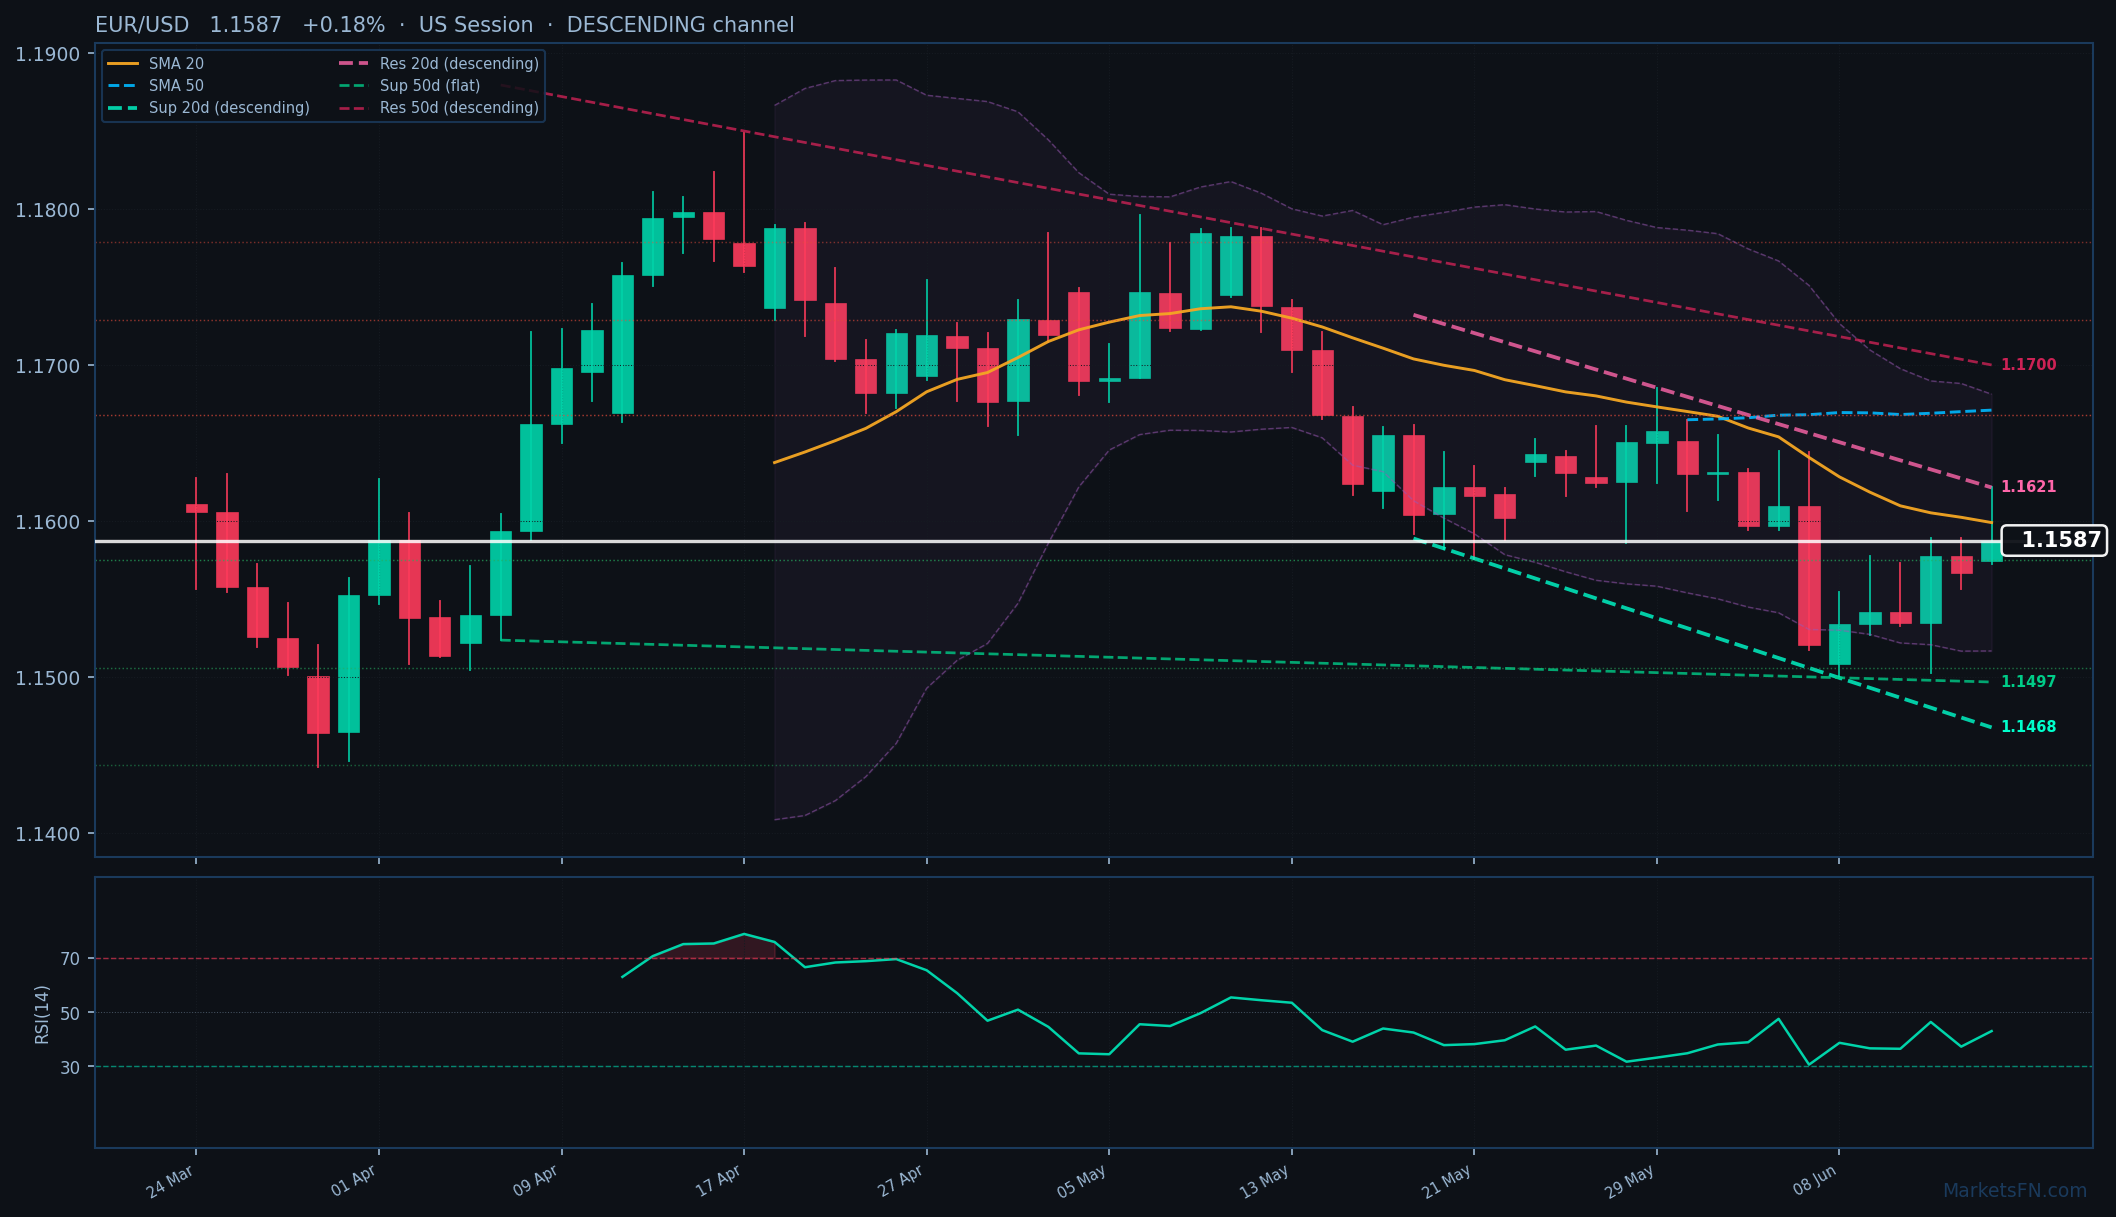
EUR/USD: Up 0.18% to 1.1587 — Descending Channel
Published: June 15, 2026 · MarketsFN Team · US Session
| Pair | Rate | Change | RSI(14) | SMA-20 | SMA-50 | 52W High | 52W Low | Pivot | R1 | S1 |
|---|---|---|---|---|---|---|---|---|---|---|
| EUR/USD | 1.1587 | +0.18% | 43.0 | 1.1599 | 1.1671 | 1.2041 | 1.1403 | 1.1571 | 1.1585 | 1.1552 |
📊 Support & Resistance Levels
Dynamic Trendlines
| Level | Type | Direction | Distance |
|---|---|---|---|
| 1.1468 | 20d Support | ↘ descending | -1.03% / 119.7 pips |
| 1.1621 | 20d Resistance | ↘ descending | +0.29% / 34.0 pips |
| 1.1497 | 50d Support | → flat | -0.78% / 90.6 pips |
| 1.1700 | 50d Resistance | ↘ descending | +0.97% / 112.5 pips |
Static Levels
| Level | Type | Touches | Distance |
|---|---|---|---|
| 1.1779 | Resistance | 2× | +1.65% / 191.6 pips |
| 1.1729 | Resistance | 2× | +1.22% / 141.4 pips |
| 1.1668 | Resistance | 2× | +0.69% / 80.2 pips |
| 1.1575 | Support | 3× | -0.11% / 12.7 pips |
| 1.1505 | Support | 2× | -0.71% / 81.9 pips |
| 1.1444 | Support | 2× | -1.24% / 143.5 pips |
EUR/USD is trading at 1.1587 (+0.18%), testing the upper bounds of a descending 20-day channel amid weak momentum and bearish technical positioning. The pair remains below both the 20-day (1.1599) and 50-day (1.1671) SMAs, confirming the broader downtrend, with today’s rally merely a retracement within a structurally weak framework. The 20-day dynamic resistance at 1.1621 (+34 pips) looms overhead, while the descending 50-day resistance at 1.1700 (+112.5 pips) reinforces the bearish bias. Immediate static support at S1 (1.1575, -12.7 pips) is critical—a break below would expose S2 at 1.1505 (-81.9 pips), aligning with the 50-day dynamic support at 1.1497 (-90.6 pips).
The RSI at 43.0 shows neutral momentum, offering no divergence signals to challenge the downtrend. With the 20-day channel descending and price action compressing near the lower Bollinger Band equivalent (implied by the SMA-20 gap), rallies remain sell opportunities. The Asian session’s tight range (1.1572–1.1622) suggests hesitation, but the bearish structure favors downside continuation. A close above the 20-day SMA (1.1599, +12 pips) could trigger short-covering toward R1 (1.1668, +80.2 pips), though the descending dynamic resistance at 1.1621 makes this unlikely without a catalyst.
The key near-term trigger is the US retail sales data due later today—a miss could spark a relief rally toward 1.1621, while strong data may confirm the downtrend’s resumption toward 1.1505. Until the pair reclaims the 50-day SMA, the path of least resistance is lower.
Disclaimer
The content on MarketsFN.com is provided for educational and informational purposes only and does not constitute financial advice. All investments involve risk and past performance does not guarantee future results.


