EUR/USD: Up 0.14% to 1.1258 — RSI Oversold
MarketsFN Team
EUR/USD: Up 0.14% to 1.1258 — RSI Oversold
Published: October 02, 2026 · MarketsFN Team · US Session
| Pair | Rate | Change | RSI(14) | SMA-20 | SMA-50 | 52W High | 52W Low | Pivot | R1 | S1 |
|---|---|---|---|---|---|---|---|---|---|---|
| EUR/USD | 1.1258 | +0.14% | 12.3 | 1.1460 | 1.1526 | 1.2041 | 1.1241 | 1.1264 | 1.1314 | 1.1192 |
📊 Support & Resistance Levels
Dynamic Trendlines
| Level | Type | Direction | Distance |
|---|---|---|---|
| 1.1193 | 20d Support | ↘ descending | -0.57% / 64.2 pips |
| 1.1343 | 20d Resistance | ↘ descending | +0.76% / 85.4 pips |
| 1.1212 | 50d Support | ↘ descending | -0.41% / 45.8 pips |
| 1.1578 | 50d Resistance | ↘ descending | +2.85% / 321.0 pips |
Static Levels
| Level | Type | Touches | Distance |
|---|---|---|---|
| 1.1668 | Resistance | 2× | +3.64% / 410.0 pips |
| 1.1654 | Resistance | 2× | +3.53% / 396.8 pips |
| 1.1640 | Resistance | 2× | +3.40% / 382.4 pips |
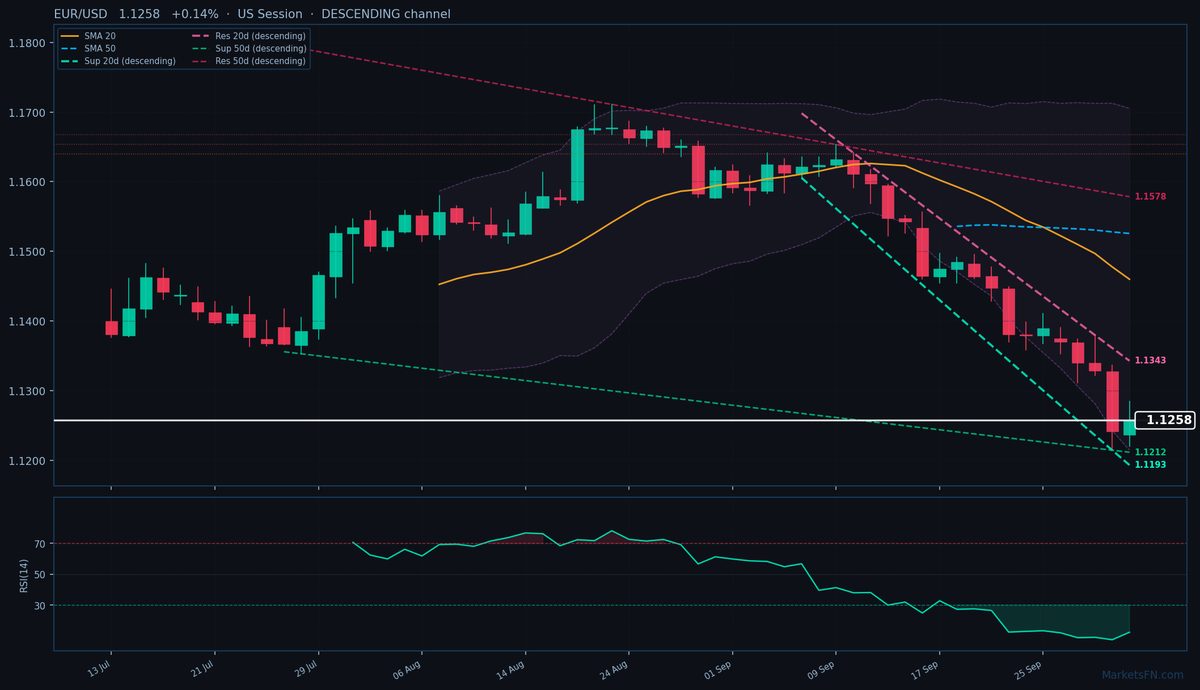
EUR/USD is trading at 1.1258 (+0.14%), clinging to the lower bounds of a firmly entrenched downtrend as both 20-day (1.1460) and 50-day (1.1526) SMAs loom overhead. The pair remains trapped in a descending 20-day channel, with immediate dynamic resistance at 1.1343 (85.4 pips above) and support at 1.1193 (64.2 pips below). The broader 50-day channel confirms bearish momentum, with resistance far above at 1.1578 (321.0 pips away) and support at 1.1212 (45.8 pips below). Static levels show the nearest floor at S1 (1.1192, 66 pips below) while R1 (1.1314, 56 pips above) presents the first meaningful overhead barrier.
Alarmingly, the RSI(14) at 12.3 signals extreme oversold conditions not seen in years, suggesting potential for a technical bounce—though the descending channel and SMA positioning argue against sustained recovery. Today’s tight 65-pip range (1.1220-1.1285) reflects hesitation near multi-year lows, with the ATR(14) of 56 pips indicating compressed volatility. The market is testing whether oversold exhaustion can override structural bearishness.
Short-term, watch for a break below 1.1192 (S1) to confirm continuation toward the 52-week low of 1.1241, while a close above 1.1314 (R1) could trigger short-covering toward 1.1343 dynamic resistance. The October 5 FOMC minutes will be the next catalyst to either validate the downtrend or force a squeeze. Until then, the path of least resistance remains south.
Disclaimer
The content on MarketsFN.com is provided for educational and informational purposes only and does not constitute financial advice. All investments involve risk and past performance does not guarantee future results.