EUR/USD: Down 0.37% to 1.1157 — RSI Oversold
MarketsFN Team
EUR/USD: Down 0.37% to 1.1157 — RSI Oversold
Published: October 12, 2026 · MarketsFN Team · US Session
| Pair | Rate | Change | RSI(14) | SMA-20 | SMA-50 | 52W High | 52W Low | Pivot | R1 | S1 |
|---|---|---|---|---|---|---|---|---|---|---|
| EUR/USD | 1.1157 | -0.37% | 16.7 | 1.1340 | 1.1495 | 1.2041 | 1.1157 | 1.1209 | 1.1231 | 1.1176 |
📊 Support & Resistance Levels
Dynamic Trendlines
| Level | Type | Direction | Distance |
|---|---|---|---|
| 1.1047 | 20d Support | ↘ descending | -0.98% / 109.3 pips |
| 1.1241 | 20d Resistance | ↘ descending | +0.75% / 84.1 pips |
| 1.1123 | 50d Support | ↘ descending | -0.30% / 34.0 pips |
| 1.1502 | 50d Resistance | ↘ descending | +3.10% / 345.6 pips |
Static Levels
| Level | Type | Touches | Distance |
|---|---|---|---|
| 1.1668 | Resistance | 2× | +4.58% / 511.0 pips |
| 1.1654 | Resistance | 2× | +4.46% / 497.8 pips |
| 1.1640 | Resistance | 2× | +4.33% / 483.4 pips |
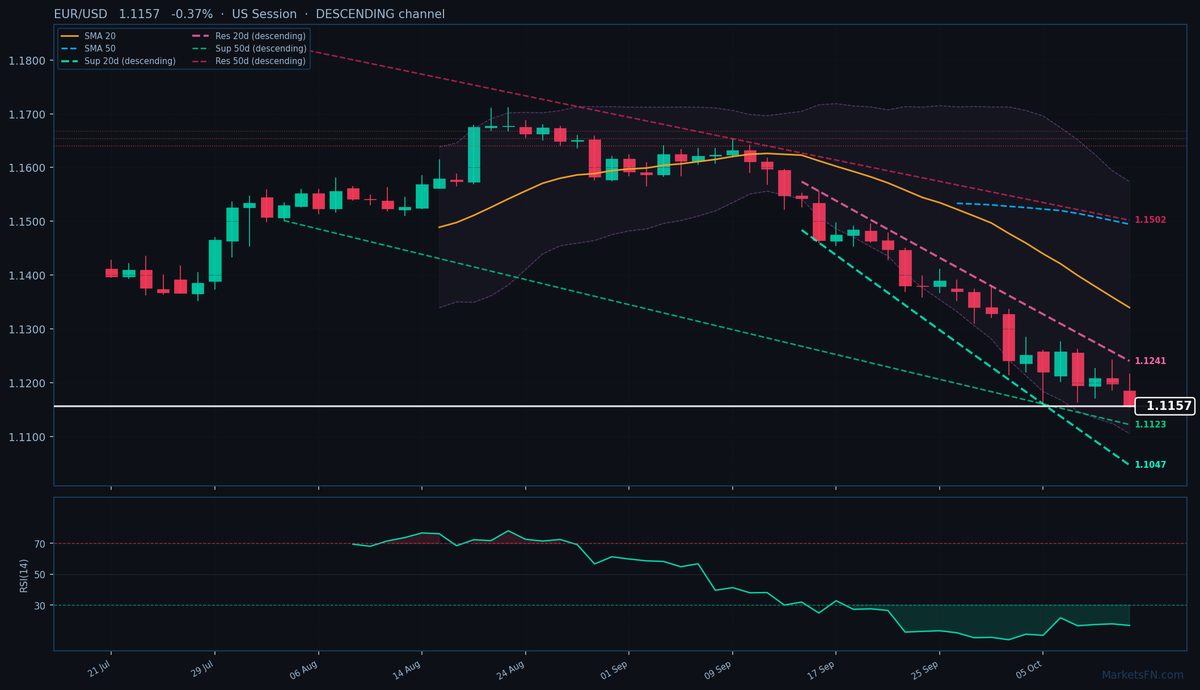
EUR/USD is trading at 1.1157 (-0.37%), extending its downtrend as the pair remains firmly below both the 20-day (1.1340) and 50-day (1.1495) SMAs—a clear bearish signal. The 20-day dynamic channel is descending, with resistance at 1.1241 (84.1 pips above current) and support at 1.1047 (109.3 pips below). The 50-day channel mirrors this downtrend, with resistance far overhead at 1.1502 (345.6 pips away) and nearer support at 1.1123 (34.0 pips below). Static levels show immediate resistance at S1 pivot 1.1176 (19.0 pips above) and R1 pivot 1.1231 (74.0 pips above), though more significant cluster resistance sits far above at 1.1640-1.1668.
The RSI at 16.7 is deeply oversold—the lowest since the 2026 data began—suggesting potential for a short-term bounce, but the descending channels and SMA positioning argue against any sustained reversal. With the 20-day ATR at 68 pips, today’s range (1.1155-1.1217) is already 62 pips, leaving limited room for further downside today without breaking the 20-day dynamic support at 1.1047.
Near-term, watch whether the RSI divergence sparks a technical rebound toward 1.1176 (S1) or 1.1231 (R1), but the broader trend remains bearish below the SMAs. A break below 1.1123 (50-day dynamic support) would confirm acceleration toward 1.1047. The US session’s close relative to 1.1176 will signal whether oversold conditions are stabilizing or if the downtrend is resuming.
Disclaimer
The content on MarketsFN.com is provided for educational and informational purposes only and does not constitute financial advice. All investments involve risk and past performance does not guarantee future results.