EUR/USD: Down 0.31% to 1.1335 — RSI Oversold
MarketsFN Team
EUR/USD: Down 0.31% to 1.1335 — RSI Oversold
Published: September 29, 2026 · MarketsFN Team · US Session
| Pair | Rate | Change | RSI(14) | SMA-20 | SMA-50 | 52W High | 52W Low | Pivot | R1 | S1 |
|---|---|---|---|---|---|---|---|---|---|---|
| EUR/USD | 1.1335 | -0.31% | 8.6 | 1.1510 | 1.1532 | 1.2041 | 1.1335 | 1.1371 | 1.1390 | 1.1352 |
📊 Support & Resistance Levels
Dynamic Trendlines
| Level | Type | Direction | Distance |
|---|---|---|---|
| 1.1318 | 20d Support | ↘ descending | -0.15% / 16.8 pips |
| 1.1390 | 20d Resistance | ↘ descending | +0.49% / 55.4 pips |
| 1.1327 | 50d Support | → flat | -0.07% / 8.2 pips |
| 1.1664 | 50d Resistance | → flat | +2.90% / 328.7 pips |
Static Levels
| Level | Type | Touches | Distance |
|---|---|---|---|
| 1.1668 | Resistance | 2× | +2.94% / 332.7 pips |
| 1.1654 | Resistance | 2× | +2.82% / 319.5 pips |
| 1.1640 | Resistance | 2× | +2.69% / 305.1 pips |
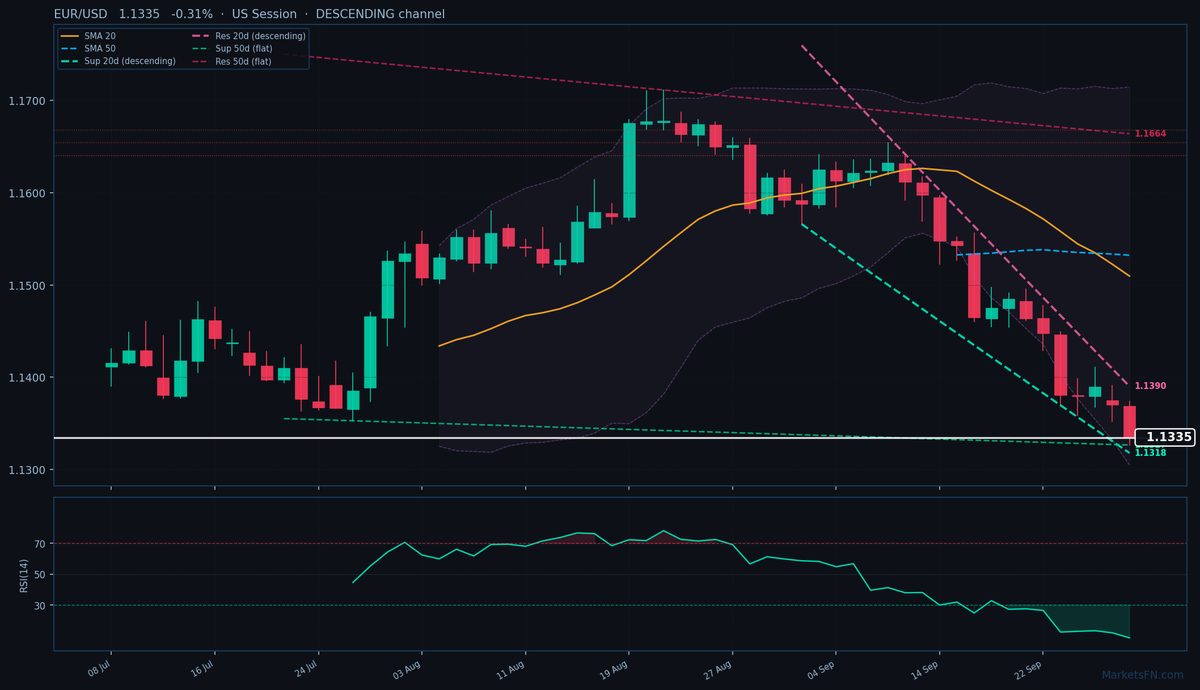
EUR/USD is trading at 1.1335 (-0.31%), extending its downtrend as it remains firmly below both the 20-day (1.1510) and 50-day (1.1532) SMAs. The pair is now testing the lower bounds of its descending 20-day channel, with dynamic resistance at 1.1390 (55.4 pips above) and dynamic support at 1.1318 (16.8 pips below). The 50-day channel has flattened into a sideways range, but the immediate pressure remains bearish given the steep slope of the 20-day trendlines.
Static levels reinforce the downside bias, with S1 at 1.1352 (17 pips above) offering minor resistance and R1 at 1.1390 (55 pips above) aligning with the dynamic channel top. The RSI at 8.6 is deeply oversold, suggesting potential for a short-term bounce, but the lack of meaningful static support until 1.1640 (305 pips away) leaves the pair vulnerable to further downside if 1.1318 breaks.
The immediate catalyst is whether the oversold RSI triggers a technical rebound or if the bearish momentum persists. A break below 1.1318 could accelerate losses toward the 52-week low of 1.1335 (already tested today), while a reversal above 1.1352 (S1) might stall the decline temporarily. Given the absence of nearby static support and the descending channel structure, the path of least resistance remains lower. Watch for a close above 1.1371 (pivot) to signal any meaningful relief.
Disclaimer
The content on MarketsFN.com is provided for educational and informational purposes only and does not constitute financial advice. All investments involve risk and past performance does not guarantee future results.