EUR/USD: Down 0.22% to 1.1353 — RSI Signals Oversold
MarketsFN Team
EUR/USD: Down 0.22% to 1.1353 — RSI Signals Oversold
Published: September 29, 2026 · MarketsFN Team
| Pair | Rate | Change | RSI(14) | SMA-20 | SMA-50 | 52W High | 52W Low | Pivot | R1 | S1 |
|---|---|---|---|---|---|---|---|---|---|---|
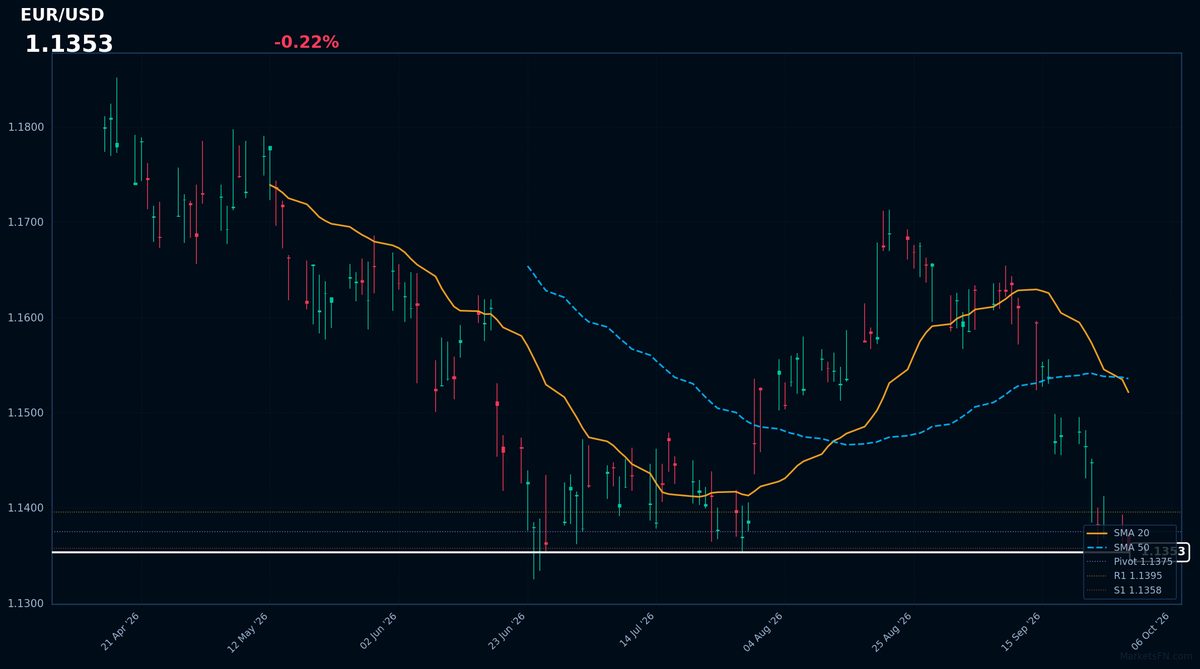
| EUR/USD | 1.1353 | -0.22% | 6.3 | 1.1521 | 1.1536 | 1.1809 | 1.1353 | 1.1375 | 1.1395 | 1.1358 |
EUR/USD is trading at 1.1353 (-0.22%) as of September 29, 2026, during the European session, marking a decline from the previous close of 1.1378. The pair is currently at its lowest level of the day and within its 52-week range, touching the year's low at 1.1353. This price action is consistent with the prevailing downtrend, as evidenced by the rate being below both the 20-day and 50-day simple moving averages at 1.1521 and 1.1536, respectively.
The Relative Strength Index (RSI) stands at 6.3, firmly in oversold territory, suggesting a potential for a technical rebound. However, the Average True Range (ATR) of 0.0054 indicates relatively subdued daily volatility. Key technical levels to watch include the pivot at 1.1375, with resistance at R1: 1.1395 and support at S1: 1.1358. The current rate is just above the S1 support level.
Given the oversold RSI reading, the market may be underpricing the likelihood of a short-term bounce. Nevertheless, the overall downtrend, as indicated by the moving averages, remains intact. A forward catalyst to confirm or invalidate this view would be the release of upcoming European economic data, particularly inflation figures, which could influence the European Central Bank's monetary policy stance and, consequently, EUR/USD dynamics.
Disclaimer
The content on MarketsFN.com is provided for educational and informational purposes only. It does not constitute financial advice or investment recommendations. All investments involve risks and past performance does not guarantee future results. You are solely responsible for your investment decisions.