EUR/PLN: Down 0.14% to 4.3023 — Price Below SMA-20
MarketsFN Team
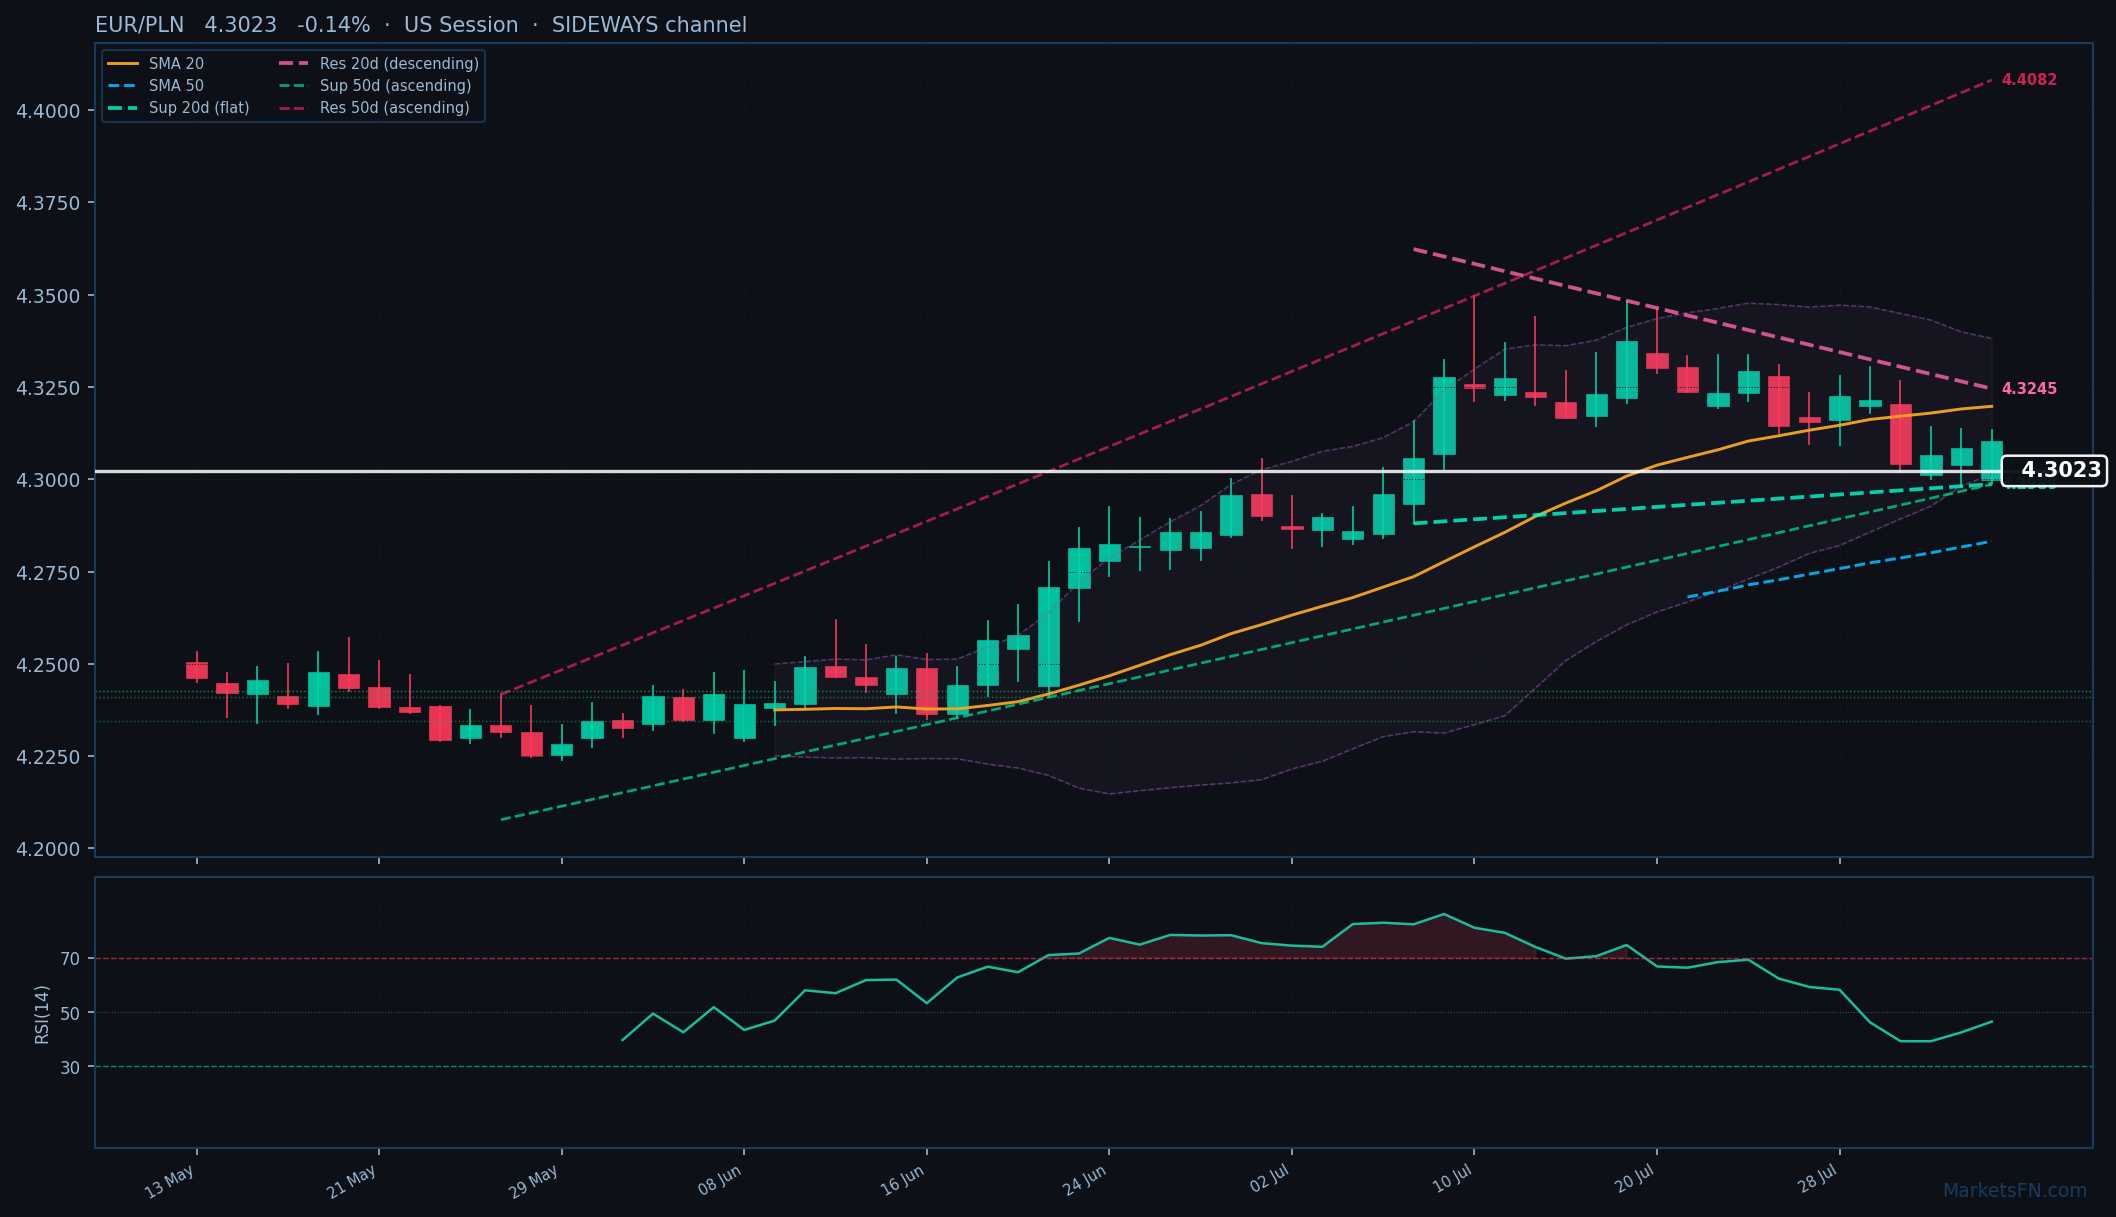
EUR/PLN: Down 0.14% to 4.3023 — Price Below SMA-20
Published: August 04, 2026 · MarketsFN Team · US Session · Emerging FX
| Pair | Rate | Change | RSI(14) | SMA-20 | SMA-50 | 52W High | 52W Low | Pivot | R1 | S1 |
|---|---|---|---|---|---|---|---|---|---|---|
| EUR/PLN | 4.3023 | -0.14% | 46.5 | 4.3198 | 4.2832 | 4.3375 | 4.1967 | 4.3068 | 4.3153 | 4.2999 |
S/R Support & Resistance Levels
Dynamic Trendlines
| Level | Type | Direction | Distance |
|---|---|---|---|
| 4.2987 | 20d Support | flat (flat) | -0.08% / 35.9 pips |
| 4.3245 | 20d Resistance | down (descending) | +0.52% / 222.7 pips |
| 4.2986 | 50d Support | up (ascending) | -0.08% / 36.3 pips |
| 4.4082 | 50d Resistance | up (ascending) | +2.46% / 1058.9 pips |
Static Levels
| Level | Type | Touches | Distance |
|---|---|---|---|
| 4.2428 | Support | 2x | -1.57% / 675.9 pips |
| 4.2410 | Support | 3x | -1.61% / 693.7 pips |
| 4.2346 | Support | 3x | -1.76% / 757.5 pips |
EUR/PLN is trading at 4.3023 (-0.14%) as it continues to navigate a consolidation phase, remaining below the 20-day simple moving average (SMA) of 4.3198 while staying above the 50-day SMA of 4.2832. This positioning indicates a market caught between short-term resistance and longer-term support, reflecting indecision among traders. The dynamic channel shows a flat 20-day support trendline at 4.2987, just 35.9 pips away, while the descending 20-day resistance trendline is positioned at 4.3245, 222.7 pips above the current rate.
On the static horizontal support and resistance front, the nearest static support level is S1 at 4.2999, only 2.4 pips below the current price, while R1 stands at 4.3153, approximately 13 pips higher. The RSI(14) at 46.5 indicates neutral momentum, suggesting that neither buyers nor sellers have a clear advantage at this moment.
In the short term, the outlook for EUR/PLN appears to hinge on the ability to break through the immediate resistance at R1. A sustained move above this level could signal a shift in momentum, potentially leading to a test of the 20-day dynamic resistance. Conversely, a drop below S1 may trigger further selling pressure, pushing the pair towards the 50-day dynamic support at 4.2986. Traders should watch for volatility around these key levels to gauge the next directional move.
Disclaimer
The content on MarketsFN.com is provided for educational and informational purposes only and does not constitute financial advice. All investments involve risk and past performance does not guarantee future results.


