European Session Crude Oil Report — 13 Oct 2026
QuoteReporter
WTI hovers near $90.86 in early European trade, down 0.27% on the day as it tests the lower bound of its Asian overnight range ($90.12-$91.78), while Brent holds firmer at $103.02, buoyed by tightening Atlantic Basin physical supply. The Brent-WTI spread widens to $12.16, pressuring European refiners already grappling with elevated crude acquisition costs. Momentum remains bearish for WTI with RSI(14) at 22.5—deep in oversold territory—while Brent’s RSI at 38.9 shows marginally more resilience. Both benchmarks extend multi-week declines, with WTI down nearly 4% on the week as it trades below all key EMAs except the 50-day ($90.23), while Brent’s proximity to its EMA9 ($103.07) suggests a potential inflection point.
Technicals paint a divergent picture. WTI struggles below its pivot point ($89.46), with immediate support at $72.17 looking distant as selling pressure builds. The October-July backwardation steepens to -10.8%, reflecting near-term supply anxieties despite broader demand concerns. Brent’s structure is even more pronounced at -14.6%, with the front-month contract ($101.80) drawing support from ongoing disruptions in the Middle East. The spread between the two benchmarks remains a focal point, with European refiners increasingly favoring WTI-linked grades to mitigate margin compression.

Geopolitical tensions continue to underpin Brent’s premium. The Strait of Hormuz remains elevated as IRGC naval activity disrupts tanker traffic, while Houthi threats in the Bab-el-Mandeb force VLCCs to divert via the Cape of Good Hope—adding $1.50-$2.00 per barrel to freight costs. Suez Canal flows normalize, but the cumulative risk premium persists. OPEC+ discipline shows cracks, with Iraq and Russia exceeding quotas, though Saudi adherence keeps the group’s output 0.6 mb/d below the call on OPEC. US production stagnates at 13.95 mb/d, while refinery utilization at 92.5% suggests steady demand despite inventory builds.
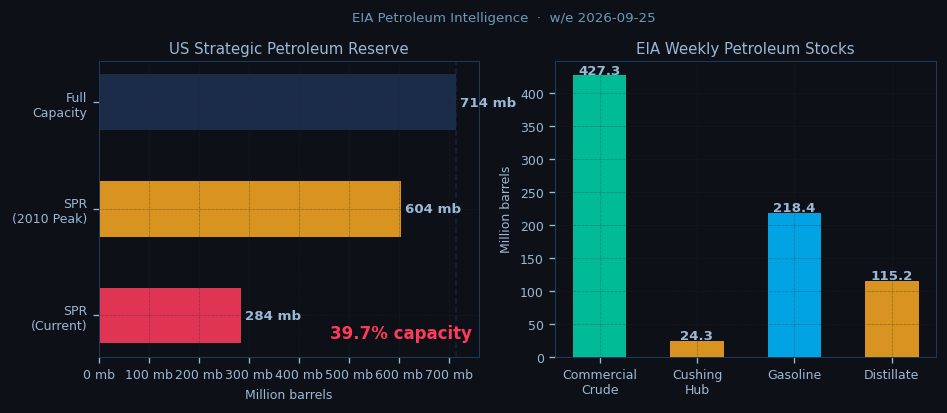
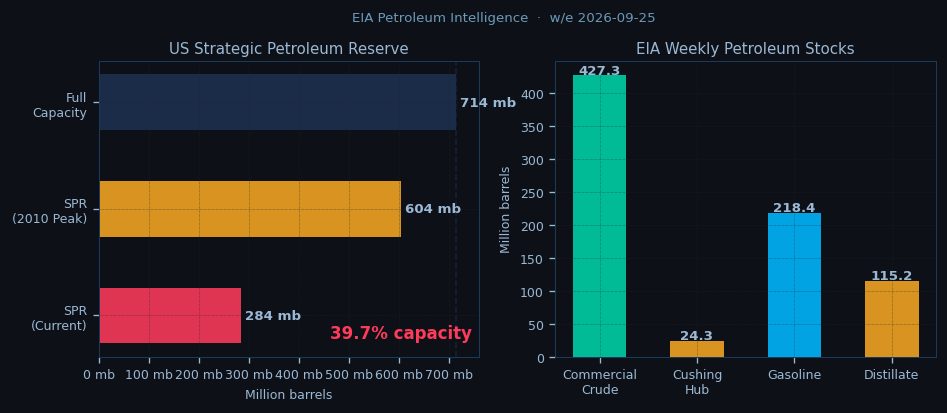
The term structure signals tightening prompt supply. WTI’s backwardation steepens as Cushing stocks hover at 24.3 mb, with the Oct26-Jul27 spread at -$9.71. Brent’s steeper curve (-$14.91) reflects stronger Atlantic Basin fundamentals, exacerbated by floating storage drawdowns in the Mediterranean. The EIA’s modest crude build (+0.9 mb) does little to alleviate backwardation, with the SPR at just 39.7% capacity—limiting the US government’s ability to intervene in markets.
All eyes turn to the NYMEX open at 14:30 CET, with traders weighing technical exhaustion against geopolitical risks. WTI’s oversold RSI may invite short-covering, but resistance at the 50-day EMA ($90.23) caps upside. Brent faces a pivotal test at $103.07—a close above could signal a reversal, though the $104.50 (R1) zone looms as a tougher barrier. The Brent-WTI spread may widen further if Middle East disruptions escalate, with European refiners likely to accelerate WTI purchases if the differential breaches $13.00. For now, the market balances frayed nerves over chokepoints against softening macro sentiment, leaving both benchmarks in a holding pattern ahead of the US session.

Disclaimer
The content on MarketsFN.com is provided for educational and informational purposes only. It does not constitute financial advice, investment recommendations, or trading guidance. All investments involve risks, and past performance does not guarantee future results. You are solely responsible for your investment decisions and should conduct independent research and consult a qualified financial advisor before acting. MarketsFN.com and its authors are not liable for any losses or damages arising from your use of this information.
Related Articles
- US Session Crude Oil Report — 12 Oct 2026 — WTI crude is trading at $90.86 in early US session action, holding near session lows as the contract extends its…
- Indonesian Earthquake Disrupts Nickel Supply — Indonesian Earthquake Disrupts Nickel Supply Chain On October 11, 2026, a magnitude 5.3 earthquake struck 150 km west…
- European Session Crude Oil Report — 12 Oct 2026 — **European Session Crude Oil Report – 05 Oct 2026 11:00 NY** WTI hovers near $90.86, down 0.27% on the session but…
- US Session Crude Oil Report — 09 Oct 2026 — WTI crude is trading at $90.86 in the US session, down 0.27% on the day as it struggles to recover from a steep weekly…
- European Session Crude Oil Report — 09 Oct 2026 — Crude oil markets stabilize in European trade after a volatile Asian session, with Brent holding above $103 while WTI…