Ethereum Stalls at $2,670 as RSI Nears Overbought Zone
QuoteReporter
•2 min read
Ethereum Stalls at $2,670 as RSI Nears Overbought Zone
Ethereum (ETH/USD) | September 30, 2026 $2,670.5701 -0.23%
🔍 Technical Analysis
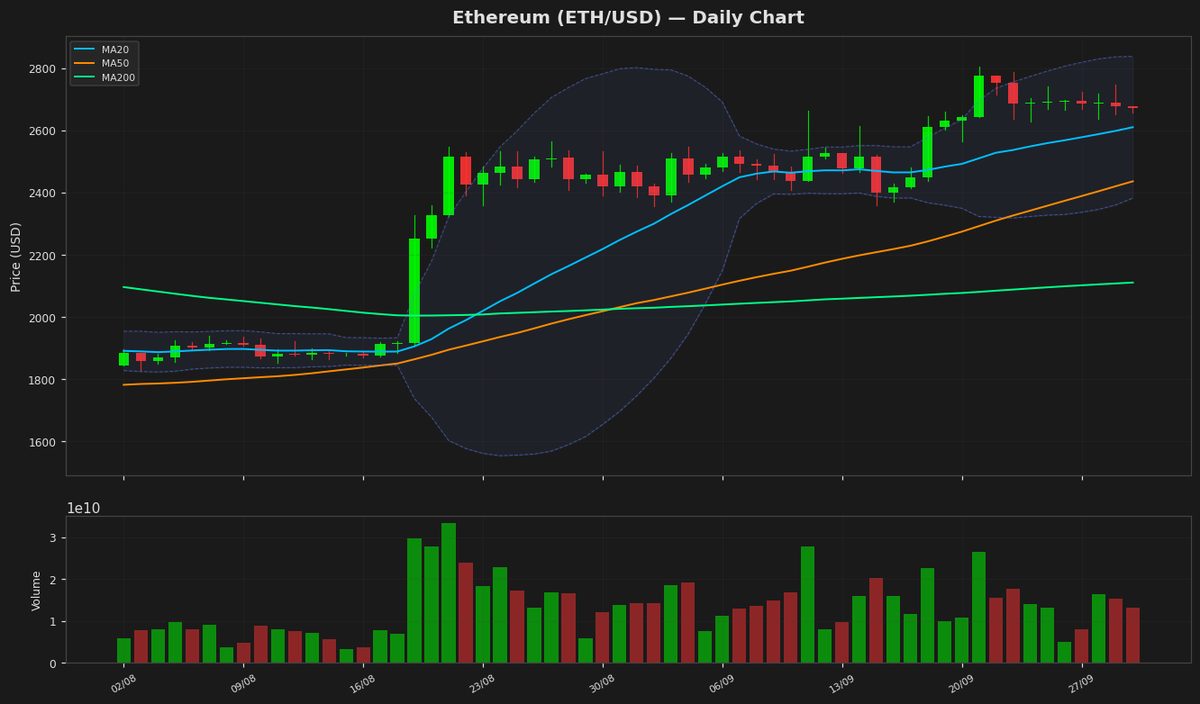
Ethereum (ETH) is currently trading at $2,670.57, showing a slight daily decline of 0.23%. The price remains above key moving averages, with the 20-day MA at $2,609.52, the 50-day MA at $2,435.46, and the 200-day MA at $2,109.67, indicating a bullish trend in the medium to long term. The Bollinger Bands suggest heightened volatility, with the upper band at $2,837.42 and the lower band at $2,381.62. The current price hovering near the upper band signals potential overbought conditions. The RSI at 75.92 confirms this overbought scenario, suggesting a possible pullback or consolidation phase. The MACD at 77.05 is below the signal line at 85.42, indicating weakening bullish momentum in the short term. Key resistance levels to watch are the yearly high at $3,040.72 and the YTD high at $3,397.90. On the downside, immediate support lies near the 20-day MA at $2,609.52, followed by the 50-day MA at $2,435.46. A break below the lower Bollinger Band at $2,381.62 could signal a deeper correction. The ATR at 87.38 reflects moderate volatility, suggesting cautious trading in the near term. Overall, Ethereum remains in an uptrend but may face short-term consolidation or correction due to overbought conditions.
Technical Metrics
| Metric | Value |
|---|---|
| Current Price | $2,670.5701 |
| Daily Change | -0.23% |
| MA 20 | $2,609.5199 |
| % from MA20 | +2.34% |
| MA 50 | $2,435.4632 |
| % from MA50 | +9.65% |
| MA 200 | $2,109.6745 |
| % from MA200 | +26.59% |
| BB Upper | $2,837.4228 |
| % from BB Upper | -5.88% |
| BB Lower | $2,381.6170 |
| % from BB Lower | +12.13% |
| RSI (14) | 75.92 |
| MACD | 77.049587 |
| MACD Signal | 85.423438 |
| ATR (14) | 87.375523 |
| 3-Day High | $2,746.0107 |
| 3-Day Low | $2,635.4846 |
| 52-Week High | $3,040.7185 |
| % from 52W High | -12.17% |
| 52-Week Low | $1,506.5057 |
| % from 52W Low | +77.27% |
| YTD High | $3,397.8977 |
| % from YTD High | -21.41% |
| YTD Low | $1,506.5057 |
| % from YTD Low | +77.27% |
📊 Market Commentary
Ethereum (ETH) is currently trading at $2,670.57, showing a slight decline of 0.23% today. The Relative Strength Index (RSI) stands at 75.9, indicating overbought conditions, which could signal potential short-term consolidation or pullback unless buying momentum persists. ETH remains within its 52-week range of $1,506.51 to $3,040.72, with the upper bound acting as a key resistance level to watch.
Market sentiment around Ethereum is cautiously optimistic, fueled by ongoing developments in the ecosystem, including layer-2 scaling solutions and anticipation around potential ETF approvals. Traders are closely monitoring the $2,700 level as immediate resistance, with a break above potentially testing the yearly high near $3,040. On the downside, support is seen around $2,500, followed by the psychologically significant $2,400 zone.
The overbought RSI suggests some traders may take profits, but sustained demand could push ETH higher. Volume trends and institutional interest remain critical factors, as ETH continues to benefit from its dominant position in smart contracts and decentralized applications. Macro factors, including Bitcoin’s price action and broader crypto market liquidity, also influence ETH’s trajectory. For now, traders are balancing bullish fundamentals with technical indicators hinting at near-term exhaustion.
Market sentiment around Ethereum is cautiously optimistic, fueled by ongoing developments in the ecosystem, including layer-2 scaling solutions and anticipation around potential ETF approvals. Traders are closely monitoring the $2,700 level as immediate resistance, with a break above potentially testing the yearly high near $3,040. On the downside, support is seen around $2,500, followed by the psychologically significant $2,400 zone.
The overbought RSI suggests some traders may take profits, but sustained demand could push ETH higher. Volume trends and institutional interest remain critical factors, as ETH continues to benefit from its dominant position in smart contracts and decentralized applications. Macro factors, including Bitcoin’s price action and broader crypto market liquidity, also influence ETH’s trajectory. For now, traders are balancing bullish fundamentals with technical indicators hinting at near-term exhaustion.
Disclaimer
The content on MarketsFN.com is provided for educational and informational purposes only. It does not constitute financial advice or investment recommendations. All investments involve risk. Cryptocurrency markets are highly volatile. Past performance does not guarantee future results.