Tron Eyes Breakout as RSI Nears Bullish Zone at $0.3382
QuoteReporter
•3 min read
Tron Eyes Breakout as RSI Nears Bullish Zone at $0.3382
Tron (TRX/USD) | September 30, 2026 $0.3382 +1.13%
🔍 Technical Analysis
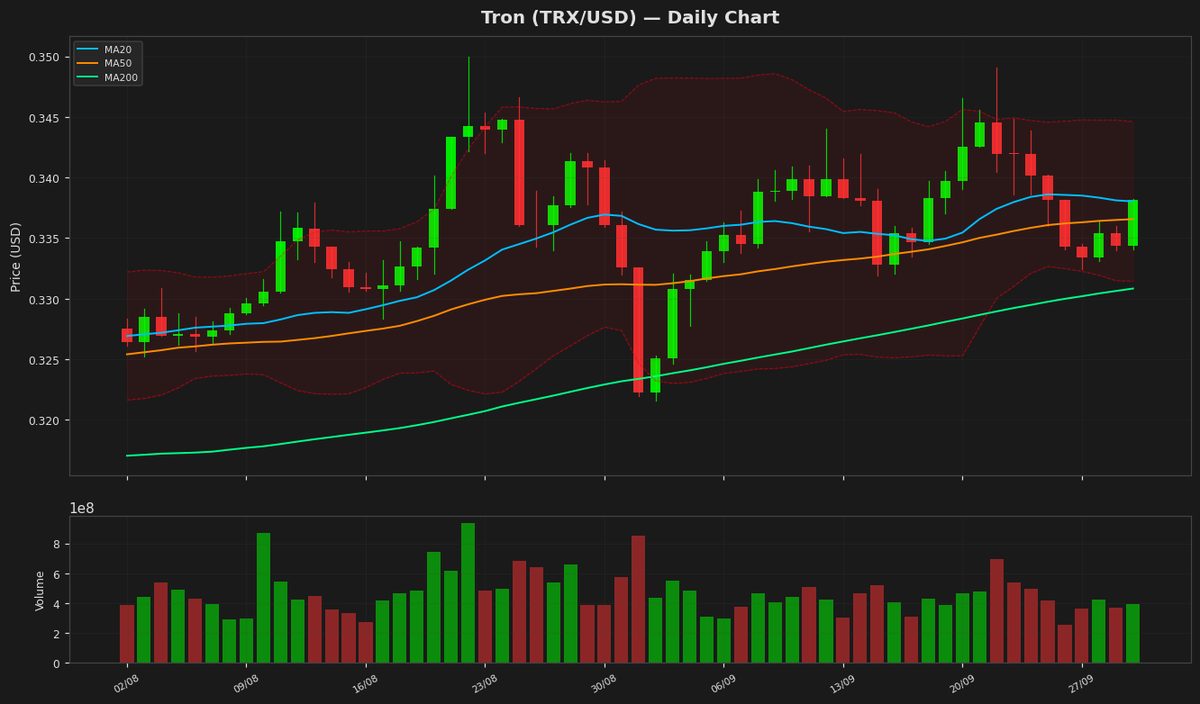
Tron (TRX) is currently trading at $0.338155, showing a modest daily gain of 1.13%. The price action remains near the 20-day moving average (MA20) at $0.338025, indicating a neutral short-term trend, while the 50-day (MA50) and 200-day (MA200) moving averages at $0.336561 and $0.330832, respectively, suggest a slightly bullish medium to long-term bias. The Bollinger Bands show a narrow range, with the upper band at $0.344608 and the lower band at $0.331442, signaling low volatility. The price hovering near the middle band suggests consolidation.
The RSI(14) at 54.79 reflects a balanced momentum, neither overbought nor oversold. The MACD histogram is marginally positive at 9.5e-05, but the signal line at 0.000674 remains above the MACD line, indicating potential bearish momentum unless a crossover occurs. The ATR(14) of 0.004398 confirms subdued price movement.
Key resistance levels to watch are the yearly high at $0.376332 and the upper Bollinger Band at $0.344608. Support lies at the MA200 ($0.330832) and the lower Bollinger Band ($0.331442), with stronger support at the 52-week low of $0.268137. A breakout above $0.344608 could signal bullish continuation, while a drop below $0.330832 may test further downside. Traders should monitor MACD convergence and RSI for directional cues.
The RSI(14) at 54.79 reflects a balanced momentum, neither overbought nor oversold. The MACD histogram is marginally positive at 9.5e-05, but the signal line at 0.000674 remains above the MACD line, indicating potential bearish momentum unless a crossover occurs. The ATR(14) of 0.004398 confirms subdued price movement.
Key resistance levels to watch are the yearly high at $0.376332 and the upper Bollinger Band at $0.344608. Support lies at the MA200 ($0.330832) and the lower Bollinger Band ($0.331442), with stronger support at the 52-week low of $0.268137. A breakout above $0.344608 could signal bullish continuation, while a drop below $0.330832 may test further downside. Traders should monitor MACD convergence and RSI for directional cues.
Technical Metrics
| Metric | Value |
|---|---|
| Current Price | $0.3382 |
| Daily Change | +1.13% |
| MA 20 | $0.3380 |
| % from MA20 | +0.04% |
| MA 50 | $0.3366 |
| % from MA50 | +0.47% |
| MA 200 | $0.3308 |
| % from MA200 | +2.21% |
| BB Upper | $0.3446 |
| % from BB Upper | -1.87% |
| BB Lower | $0.3314 |
| % from BB Lower | +2.03% |
| RSI (14) | 54.79 |
| MACD | 0.000095 |
| MACD Signal | 0.000674 |
| ATR (14) | 0.004398 |
| 3-Day High | $0.3382 |
| 3-Day Low | $0.3331 |
| 52-Week High | $0.3763 |
| % from 52W High | -10.14% |
| 52-Week Low | $0.2681 |
| % from 52W Low | +26.11% |
| YTD High | $0.3763 |
| % from YTD High | -10.14% |
| YTD Low | $0.2681 |
| % from YTD Low | +26.11% |
📊 Market Commentary
Tron (TRX) is trading at $0.3382, up 1.13% today, as the broader cryptocurrency market shows cautious optimism. The Relative Strength Index (RSI) at 54.8 suggests neutral momentum, indicating neither overbought nor oversold conditions. TRX remains within its 52-week range of $0.2681 to $0.3763, reflecting a stable but consolidative phase.
Market sentiment for TRX is mixed, with traders weighing its strong use case in decentralized applications (dApps) and stablecoin transactions against broader macroeconomic uncertainties. The recent uptick in price aligns with modest buying interest, though trading volumes remain subdued compared to earlier peaks. Key resistance levels to watch include the yearly high near $0.3763, while support sits around the $0.30 psychological level and the 52-week low of $0.2681.
Traders are closely monitoring network activity, particularly TRON’s role in stablecoin transfers and DeFi adoption, which could drive demand for TRX. Additionally, Bitcoin’s price movements continue to influence TRX, as correlation with major cryptocurrencies persists. The neutral RSI suggests a lack of strong directional bias, meaning breakout attempts could face hesitation unless accompanied by higher volume.
In summary, TRX is trading steadily within its annual range, with neutral technical indicators and cautious market participation. Traders are watching key support and resistance levels alongside broader crypto market trends for clearer signals on potential momentum shifts.
Market sentiment for TRX is mixed, with traders weighing its strong use case in decentralized applications (dApps) and stablecoin transactions against broader macroeconomic uncertainties. The recent uptick in price aligns with modest buying interest, though trading volumes remain subdued compared to earlier peaks. Key resistance levels to watch include the yearly high near $0.3763, while support sits around the $0.30 psychological level and the 52-week low of $0.2681.
Traders are closely monitoring network activity, particularly TRON’s role in stablecoin transfers and DeFi adoption, which could drive demand for TRX. Additionally, Bitcoin’s price movements continue to influence TRX, as correlation with major cryptocurrencies persists. The neutral RSI suggests a lack of strong directional bias, meaning breakout attempts could face hesitation unless accompanied by higher volume.
In summary, TRX is trading steadily within its annual range, with neutral technical indicators and cautious market participation. Traders are watching key support and resistance levels alongside broader crypto market trends for clearer signals on potential momentum shifts.
Disclaimer
The content on MarketsFN.com is provided for educational and informational purposes only. It does not constitute financial advice or investment recommendations. All investments involve risk. Cryptocurrency markets are highly volatile. Past performance does not guarantee future results.