Ethereum Eyes Rebound as RSI Nears Oversold at $2,716
QuoteReporter
•2 min read
Ethereum Eyes Rebound as RSI Nears Oversold at $2,716
Ethereum (ETH/USD) | October 06, 2026 $2,716.1101 +0.19%
🔍 Technical Analysis
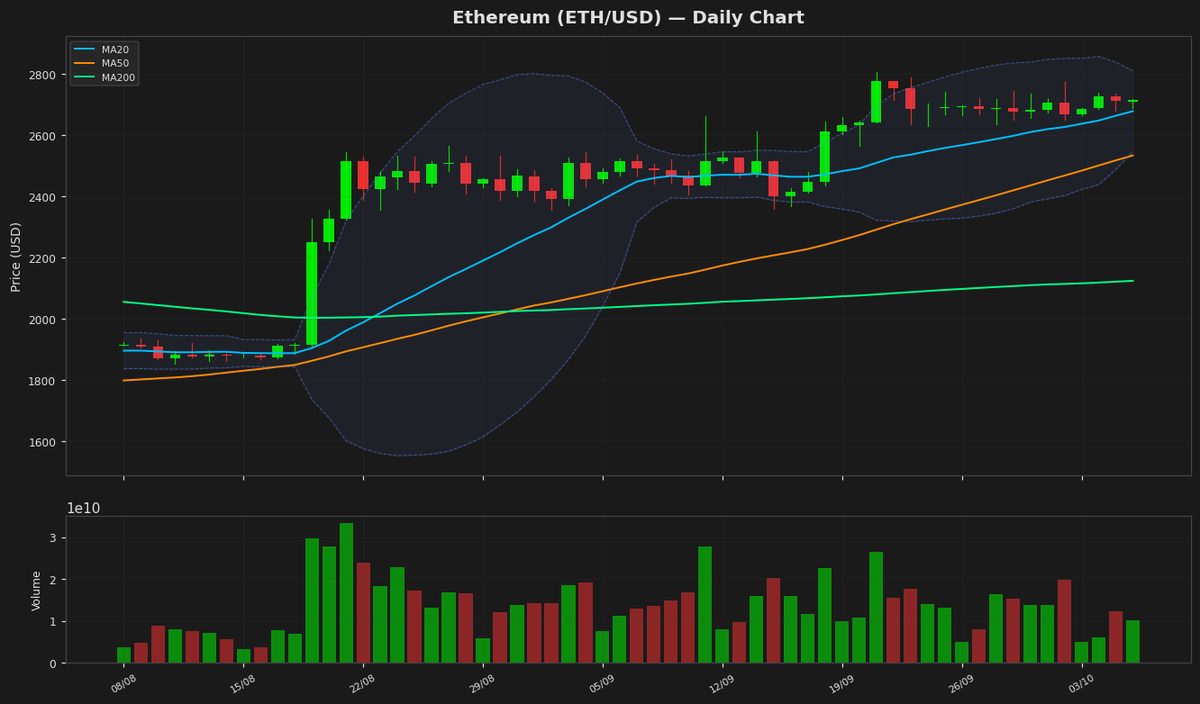
Ethereum (ETH) is currently trading at $2,716, showing a marginal daily gain of 0.19%. The price remains below the 20-day moving average (MA20) at $2,678, suggesting short-term bearish pressure, but holds above the MA50 ($2,533) and MA200 ($2,124), indicating a broader bullish trend. The Bollinger Bands show a narrowing range, with the upper band at $2,810 and the lower at $2,546, suggesting reduced volatility. The price hovering near the middle band implies consolidation. The RSI at 42.56 reflects neutral to slightly bearish momentum, as it remains below the 50 level but is not oversold. The MACD at 61.42 is below its signal line (70.89), indicating weakening bullish momentum, though the histogram shows no strong divergence yet. Key support lies at $2,546 (Bollinger lower band) and $2,500 (psychological level), while resistance is at $2,810 (Bollinger upper band) and $3,040 (52-week high). The ATR at 69.62 confirms moderate volatility. Ethereum remains in a broader uptrend but faces near-term consolidation between $2,500 and $2,800. A break above $2,810 could signal renewed bullish momentum, while a drop below $2,500 may test the MA200.
Technical Metrics
| Metric | Value |
|---|---|
| Current Price | $2,716.1101 |
| Daily Change | +0.19% |
| MA 20 | $2,678.5394 |
| % from MA20 | +1.40% |
| MA 50 | $2,533.8207 |
| % from MA50 | +7.19% |
| MA 200 | $2,124.1416 |
| % from MA200 | +27.87% |
| BB Upper | $2,810.7333 |
| % from BB Upper | -3.37% |
| BB Lower | $2,546.3455 |
| % from BB Lower | +6.67% |
| RSI (14) | 42.56 |
| MACD | 61.428149 |
| MACD Signal | 70.893412 |
| ATR (14) | 69.628174 |
| 3-Day High | $2,738.2566 |
| 3-Day Low | $2,679.3550 |
| 52-Week High | $3,040.7185 |
| % from 52W High | -10.68% |
| 52-Week Low | $1,506.5057 |
| % from 52W Low | +80.29% |
| YTD High | $3,397.8977 |
| % from YTD High | -20.06% |
| YTD Low | $1,506.5057 |
| % from YTD Low | +80.29% |
📊 Market Commentary
Ethereum (ETH) is trading at $2,716.1101, showing modest gains of 0.19% today amid mixed market sentiment. The Relative Strength Index (RSI) at 42.6 suggests ETH is neither overbought nor oversold, hovering near neutral territory. Over the past 52 weeks, Ethereum has fluctuated between $1,506.5057 and $3,040.7185, reflecting significant volatility but maintaining a strong recovery from its yearly lows.
Current market sentiment appears cautious as traders weigh macroeconomic factors, including interest rate expectations and broader crypto market trends. ETH’s price remains below its yearly high, indicating resistance near the $3,040 level, while support is forming around the $2,500-$2,600 zone. A sustained hold above $2,700 could signal renewed bullish interest, but failure to break higher may lead to further consolidation.
Traders are closely monitoring Ethereum’s network activity, including gas fees and decentralized application (dApp) usage, as well as progress toward further protocol upgrades. The upcoming Ethereum Improvement Proposals (EIPs) and institutional interest in ETH-based financial products remain key focal points. Additionally, Bitcoin’s price action continues to influence ETH’s near-term direction, given the strong correlation between the two assets. For now, ETH appears range-bound, with the market awaiting clearer signals for its next directional move.
Current market sentiment appears cautious as traders weigh macroeconomic factors, including interest rate expectations and broader crypto market trends. ETH’s price remains below its yearly high, indicating resistance near the $3,040 level, while support is forming around the $2,500-$2,600 zone. A sustained hold above $2,700 could signal renewed bullish interest, but failure to break higher may lead to further consolidation.
Traders are closely monitoring Ethereum’s network activity, including gas fees and decentralized application (dApp) usage, as well as progress toward further protocol upgrades. The upcoming Ethereum Improvement Proposals (EIPs) and institutional interest in ETH-based financial products remain key focal points. Additionally, Bitcoin’s price action continues to influence ETH’s near-term direction, given the strong correlation between the two assets. For now, ETH appears range-bound, with the market awaiting clearer signals for its next directional move.
Disclaimer
The content on MarketsFN.com is provided for educational and informational purposes only. It does not constitute financial advice or investment recommendations. All investments involve risk. Cryptocurrency markets are highly volatile. Past performance does not guarantee future results.