Ethereum Eyes Rebound as RSI Nears Oversold at $2,329
QuoteReporter
•2 min read
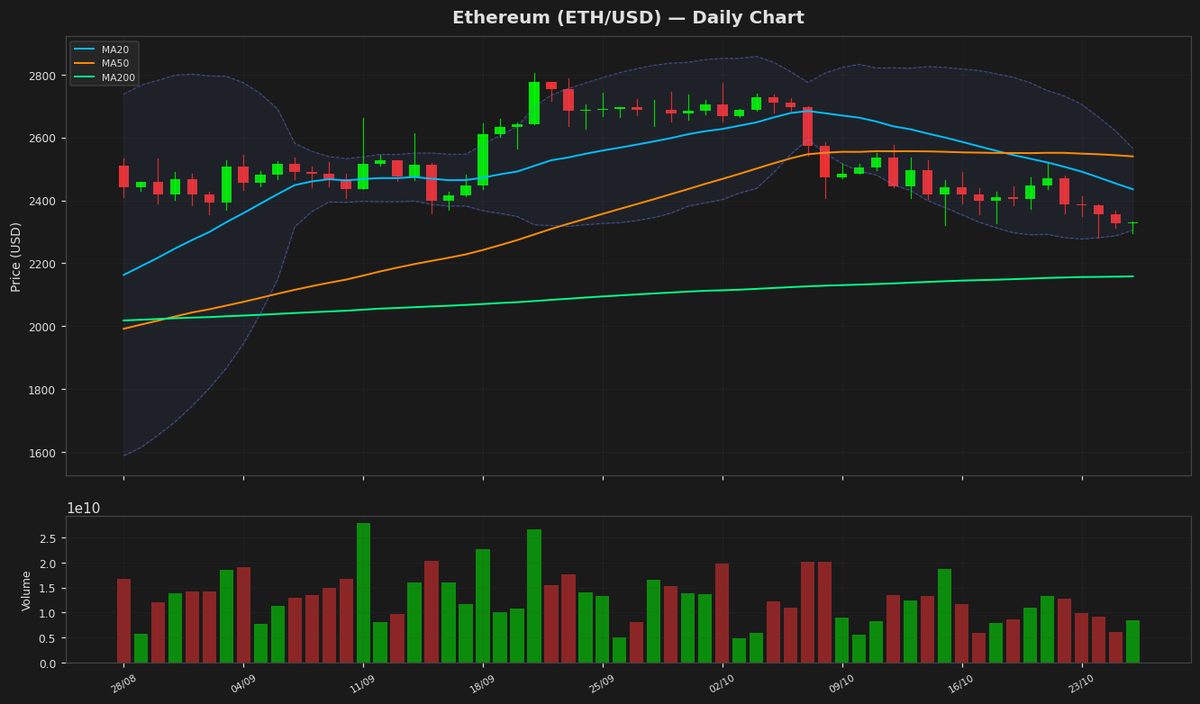
Ethereum (ETH/USD) | October 26, 2026 $2,329.5601 +0.11%
🔍 Technical Analysis
**Ethereum (ETH) Technical Analysis**
Ethereum is currently trading at $2,329, showing minimal daily movement (+0.11%) as it remains in a consolidation phase. The price is below both the 20-day MA ($2,435) and 50-day MA ($2,540), indicating short-term bearish pressure, though the 200-day MA ($2,158) still provides long-term support. Bollinger Bands show a narrowing range, with the upper band at $2,565 and the lower at $2,305, suggesting reduced volatility and potential for a breakout. The RSI at 36.3 is nearing oversold territory but hasn’t yet signaled a reversal.
The MACD remains bearish with a reading of -58, below its signal line at -46.8, reinforcing the current downtrend. Key resistance levels to watch are $2,435 (20-day MA) and $2,540 (50-day MA), while immediate support lies at $2,305 (lower Bollinger Band) and $2,158 (200-day MA). A break below $2,158 could see a test of the yearly low at $1,506, whereas reclaiming $2,540 may shift momentum bullish. The 52-week high ($2,805) and YTD high ($3,398) remain distant targets, requiring strong bullish catalysts. Traders should monitor volume and MACD convergence for trend confirmation.
Technical Metrics
| Metric | Value |
|---|---|
| Current Price | $2,329.5601 |
| Daily Change | +0.11% |
| MA 20 | $2,435.1348 |
| % from MA20 | -4.34% |
| MA 50 | $2,539.6423 |
| % from MA50 | -8.27% |
| MA 200 | $2,158.0005 |
| % from MA200 | +7.95% |
| BB Upper | $2,565.3327 |
| % from BB Upper | -9.19% |
| BB Lower | $2,304.9369 |
| % from BB Lower | +1.07% |
| RSI (14) | 36.30 |
| MACD | -58.033163 |
| MACD Signal | -46.837557 |
| ATR (14) | 93.498029 |
| 3-Day High | $2,386.8833 |
| 3-Day Low | $2,280.5522 |
| 52-Week High | $2,805.4990 |
| % from 52W High | -16.96% |
| 52-Week Low | $1,506.5057 |
| % from 52W Low | +54.63% |
| YTD High | $3,397.8977 |
| % from YTD High | -31.44% |
| YTD Low | $1,506.5057 |
| % from YTD Low | +54.63% |
📊 Market Commentary
Ethereum (ETH) is trading at $2,329.56, showing a slight gain of 0.11% today. The Relative Strength Index (RSI) at 36.3 suggests ETH is nearing oversold territory but has not yet entered it, indicating potential for further downside or consolidation before a reversal. Over the past 52 weeks, ETH has ranged between $1,506.51 and $2,805.50, with the current price sitting closer to the lower half of that range.
Market sentiment remains cautious as traders weigh macroeconomic factors, including interest rate expectations and broader crypto market trends. The recent underperformance of ETH against Bitcoin (BTC) has raised concerns about weakening altcoin demand, though Ethereum’s fundamentals—including network upgrades and institutional interest—remain strong.
Key support levels to watch include $2,250, followed by the psychological $2,000 mark. On the upside, resistance is seen near $2,400 and the more significant $2,500 zone. Traders are monitoring Ethereum’s on-chain metrics, such as exchange flows and staking activity, for signs of accumulation or distribution. Additionally, regulatory developments and Ethereum ETF progress remain focal points for institutional players.
While short-term volatility persists, ETH’s position as the leading smart contract platform continues to provide a foundation for long-term confidence. For now, traders are adopting a wait-and-see approach, looking for clearer signals in both technical and fundamental indicators before committing to stronger directional bets.
Disclaimer
The content on MarketsFN.com is provided for educational and informational purposes only. It does not constitute financial advice or investment recommendations. All investments involve risk. Cryptocurrency markets are highly volatile. Past performance does not guarantee future results.