Ethereum, Dogecoin, and Solana Lead Crypto Market Gains Today.
QuoteReporter
•5 min read
Crypto Market Report | October 12, 2026
📊 Crypto Market Overview
The cryptocurrency market is currently exhibiting a state of cautious consolidation, with overall sentiment remaining neutral as major assets trade within tight ranges. Bitcoin continues to lead the market, maintaining a strong position at 83,583.88 dollars despite recent ETF outflows and a slight daily decline of 0.11 percent. In contrast, Ethereum and Solana have shown modest positive momentum, with ETH rising 0.74 percent to 2,553.51 dollars and SOL increasing 0.59 percent to 111.90 dollars. Dogecoin and Tron also posted marginal gains, while BNB and XRP experienced slight retreats.
From a macro perspective, the landscape is shaped by increasing regulatory scrutiny and security concerns. Global watchdogs have flagged stablecoin risks and AI-driven threats ahead of the G20 summit, while French lawmakers are advancing reporting requirements for wallets exceeding 112,000 dollars. Additionally, the ecosystem is dealing with security vulnerabilities, including reports of unauthorized hardware implants in specific Ledger devices and a critical bug discovery on the XRP Ledger, which the network has since patched.
Technical signals reveal a divergence in momentum across the top assets. Bitcoin remains balanced with a Relative Strength Index of 50.4 and a positive MACD of 843.25, suggesting a stable equilibrium. Conversely, several large-cap assets are showing signs of being oversold. Ethereum, Solana, and XRP all report RSI levels between 30 and 36, indicating significant downward pressure over the recent period. While Bitcoin's MACD remains strongly positive, Ethereum and XRP are recording negative MACD values, reflecting a lack of bullish momentum in the altcoin sector. This disparity highlights a market where Bitcoin is decoupling from the broader altcoin index, maintaining its price floor while other major assets struggle to regain upward trajectory amidst a backdrop of regulatory headwinds and technical vulnerabilities.
From a macro perspective, the landscape is shaped by increasing regulatory scrutiny and security concerns. Global watchdogs have flagged stablecoin risks and AI-driven threats ahead of the G20 summit, while French lawmakers are advancing reporting requirements for wallets exceeding 112,000 dollars. Additionally, the ecosystem is dealing with security vulnerabilities, including reports of unauthorized hardware implants in specific Ledger devices and a critical bug discovery on the XRP Ledger, which the network has since patched.
Technical signals reveal a divergence in momentum across the top assets. Bitcoin remains balanced with a Relative Strength Index of 50.4 and a positive MACD of 843.25, suggesting a stable equilibrium. Conversely, several large-cap assets are showing signs of being oversold. Ethereum, Solana, and XRP all report RSI levels between 30 and 36, indicating significant downward pressure over the recent period. While Bitcoin's MACD remains strongly positive, Ethereum and XRP are recording negative MACD values, reflecting a lack of bullish momentum in the altcoin sector. This disparity highlights a market where Bitcoin is decoupling from the broader altcoin index, maintaining its price floor while other major assets struggle to regain upward trajectory amidst a backdrop of regulatory headwinds and technical vulnerabilities.
📰 Crypto News
- Global watchdog flags stablecoin risks, AI threats ahead of G20
- Here’s what happened in crypto today
- DATA Network to migrate to Sui, retire own chain
- French lawmakers back reporting rule for crypto wallets over $112K
- XRP Ledger defends emergency patch for unlimited XRP bug
- Ledger attack spreads to EU, AI finds ’18 trillion XRP’ bug: Hodler’s Digest
- Ledger says unauthorized implant found in at least one device sold by CryptoBilis
- Bitcoin shrugs off ETF outflows to trade above $84,000 as oil falls
🔍 Technical Analysis
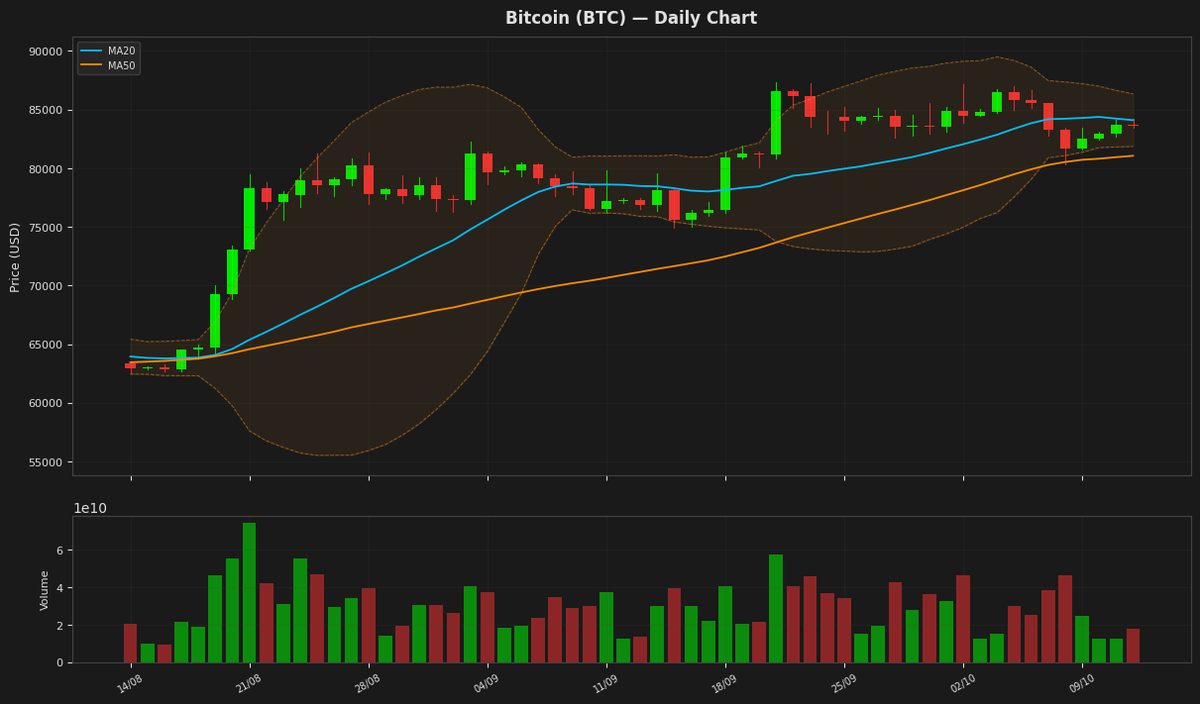
Bitcoin (BTC) — -0.11%
$83,583.88 52W: $57,747.77 — $87,363.76
Bitcoin is currently trading at $83,583.88, near its 20-day moving average of $84,097.65, indicating a lack of clear direction. The RSI is at 50.38, suggesting a neutral market sentiment, while the MACD is below its signal line, indicating a potential bearish trend. The price is also within the Bollinger Bands, with the upper and lower bands at $86,340.24 and $81,855.05 respectively.
Ethereum (ETH) — +0.74%
$2,553.51 52W: $1,506.51 — $2,805.50
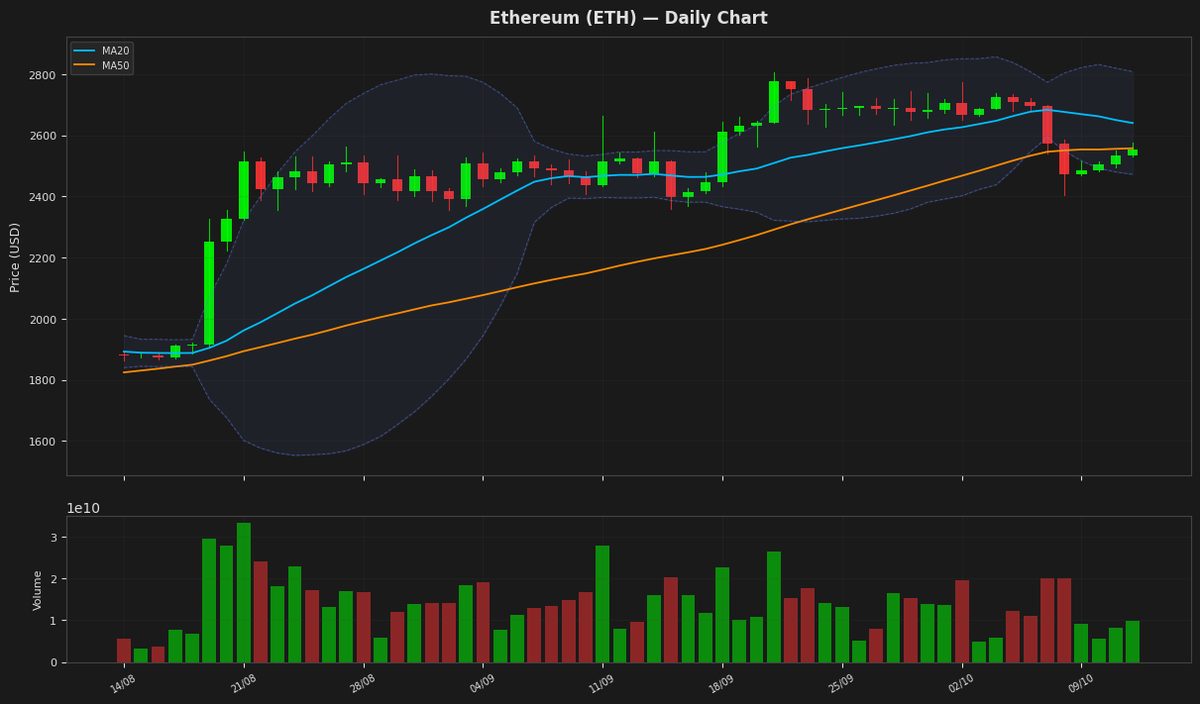
Ethereum is currently trading at $2,553.51, positioned slightly below both its 20-day and 50-day moving averages, indicating a short-term bearish trend. The RSI of 35.70 suggests the asset is approaching oversold territory, while the negative MACD and signal line gap confirm prevailing downward momentum. Price action remains contained within the Bollinger Bands, with a significant gap remaining between the current price and the upper band of $2,808.85.
Ripple (XRP) — -0.13%
$1.4074 52W: $0.988422 — $1.6838
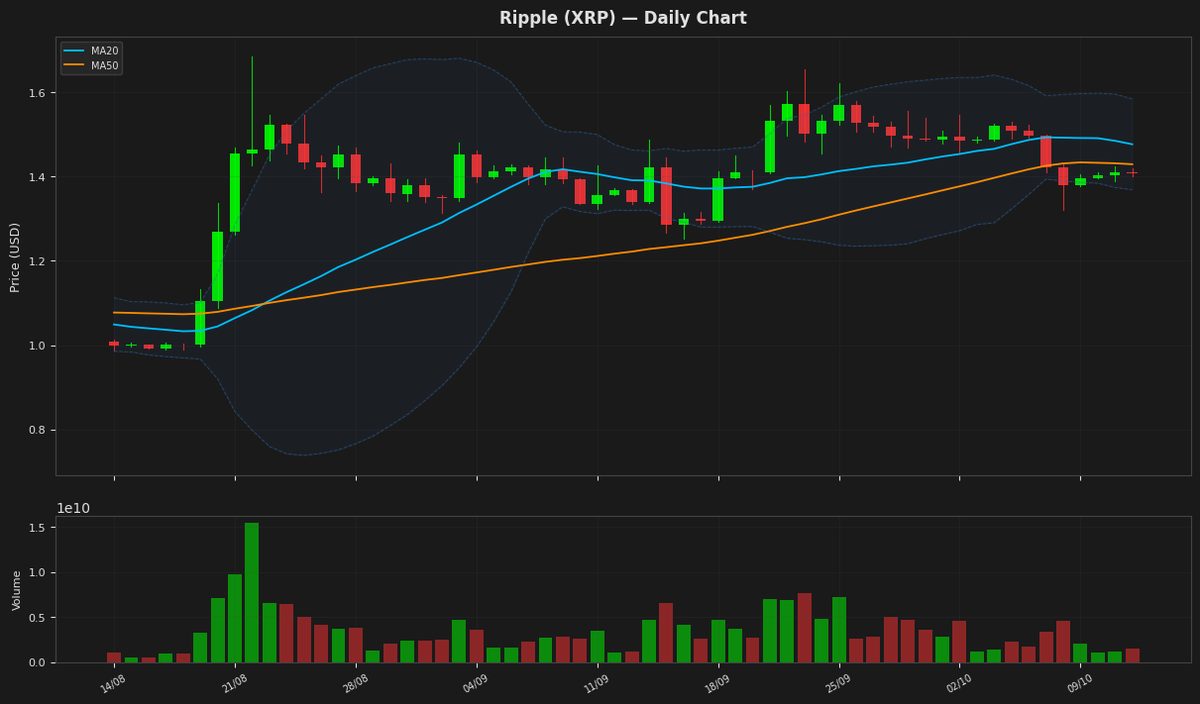
Ripple's price is currently at $1.407400, showing a slight decline, and is positioned near the lower Bollinger Band at $1.368603, indicating potential oversold conditions as the RSI(14) is at 30.759547. The MACD is below its signal line, suggesting a bearish trend. The Average True Range indicates moderate volatility, with a value of 0.04856.
Solana (SOL) — +0.59%
$111.9000 52W: $60.4147 — $124.6174
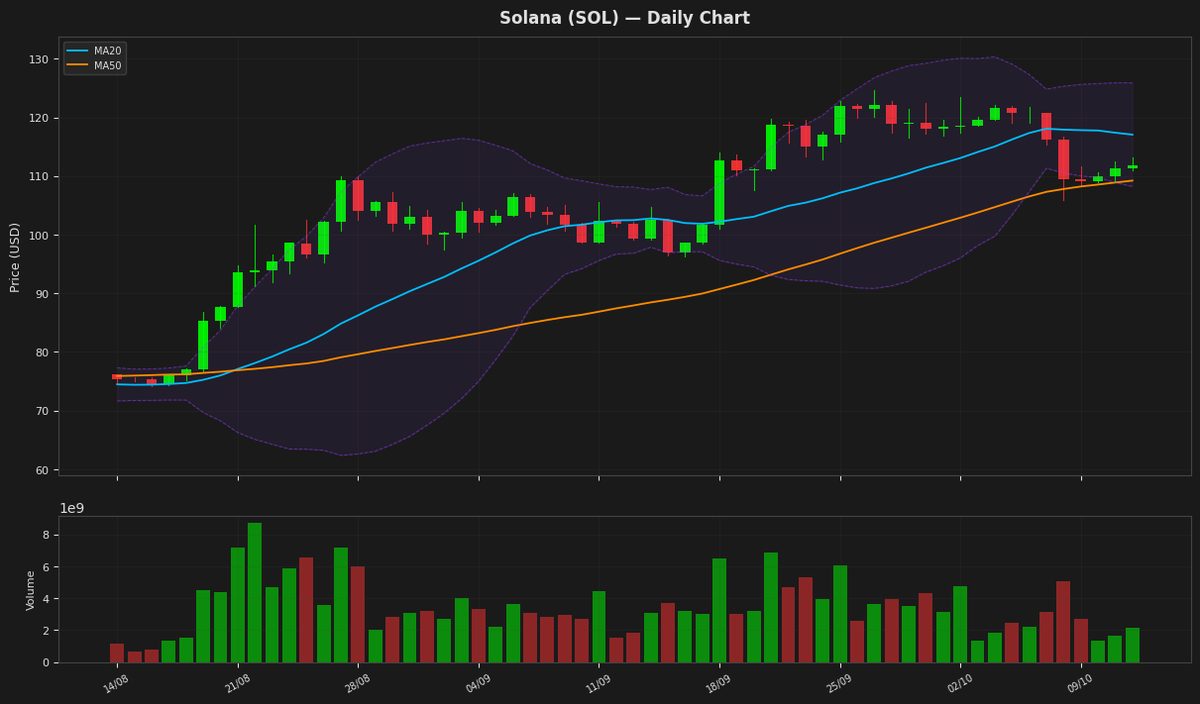
Solana is currently trading at $111.90, positioned between its 50-day moving average of $109.21 and the 20-day moving average of $117.05. The RSI of 32.69 indicates the asset is approaching oversold territory, while the MACD remains bearish as it sits below the signal line. Price action is currently consolidating near the lower Bollinger Band of $108.22, suggesting limited immediate upward momentum despite a slight daily gain of 0.59%.
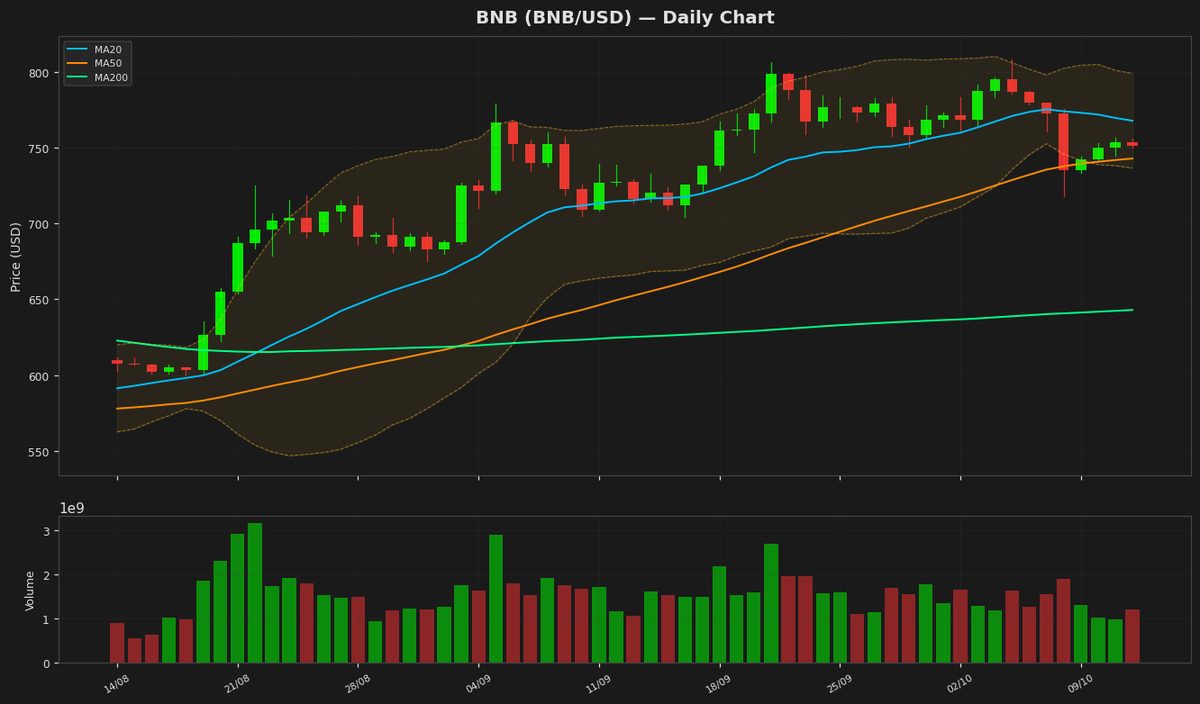
BNB (BNB) — -0.21%
$751.9800 52W: $538.5992 — $808.4329
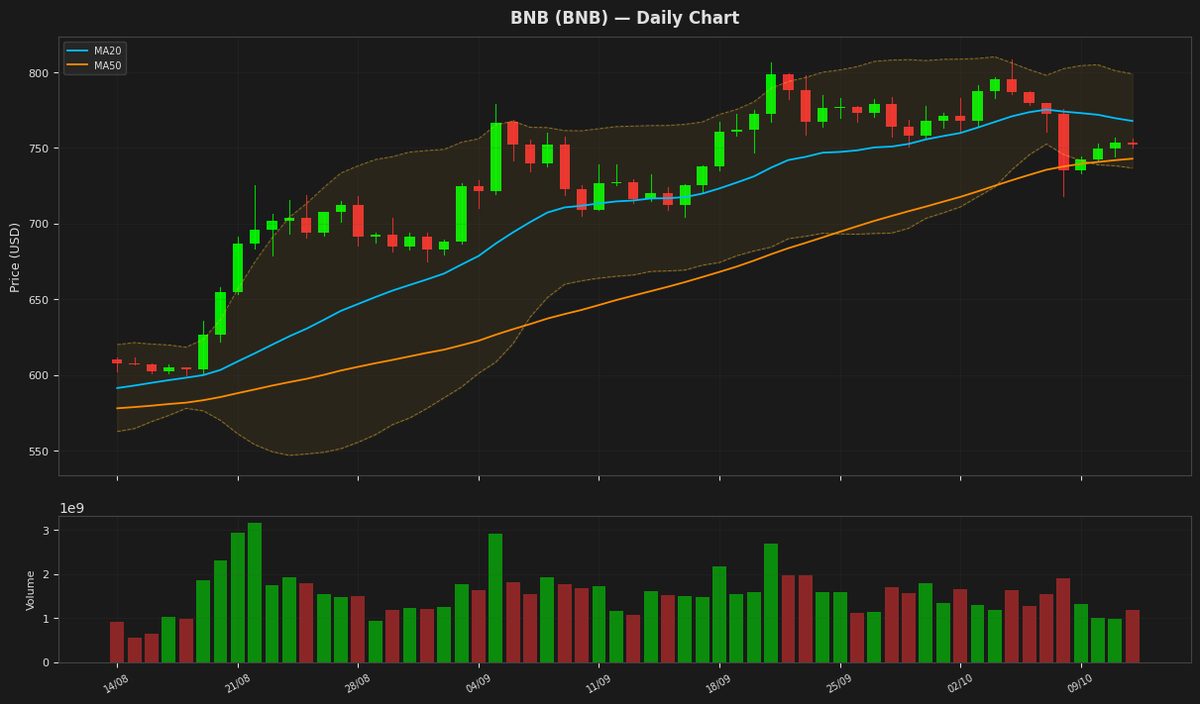
BNB is currently trading at 751.98, positioned between its MA50 of 742.86 and MA20 of 767.79, indicating a short-term bearish trend. The asset remains within its Bollinger Bands, while an RSI of 45.42 suggests neutral momentum with no immediate overbought or oversold conditions. A bearish MACD signal is evident as the MACD line of 3.06 sits below the signal line of 8.96, suggesting downward pressure persists despite the price remaining well above its 52-week low.
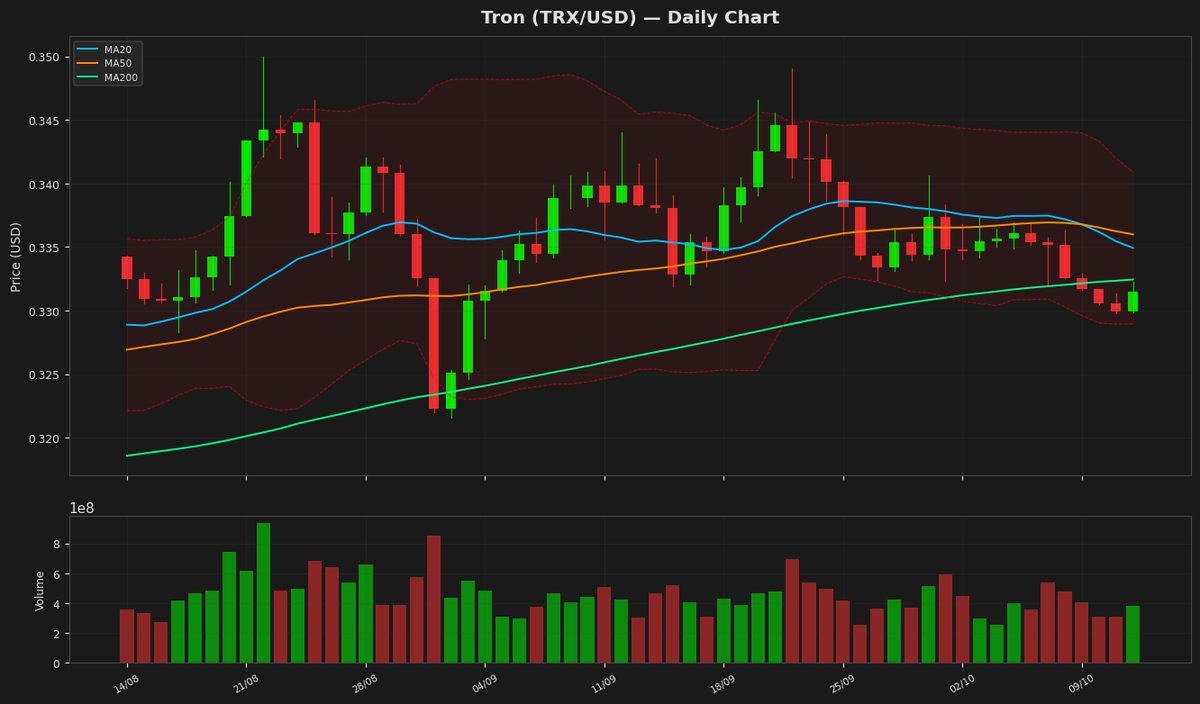
Tron (TRX) — +0.40%
$0.331233 52W: $0.268138 — $0.376332
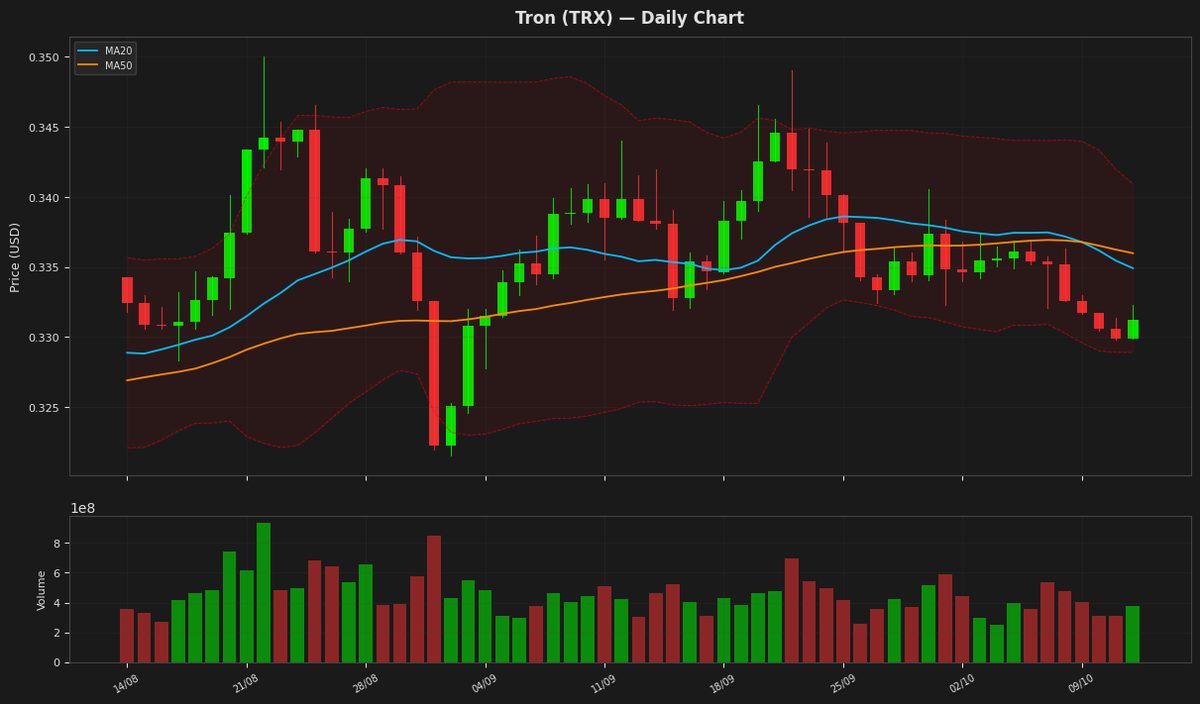
Tron is currently trading at $0.331233, remaining below both its 20-day and 50-day moving averages, which indicates a short-term bearish trend. The RSI of 36.69 suggests the asset is approaching oversold territory, while the MACD remains negative and below the signal line, confirming continued downward momentum. Price action is currently consolidating within the Bollinger Bands, with immediate support found at the lower band of $0.328902.
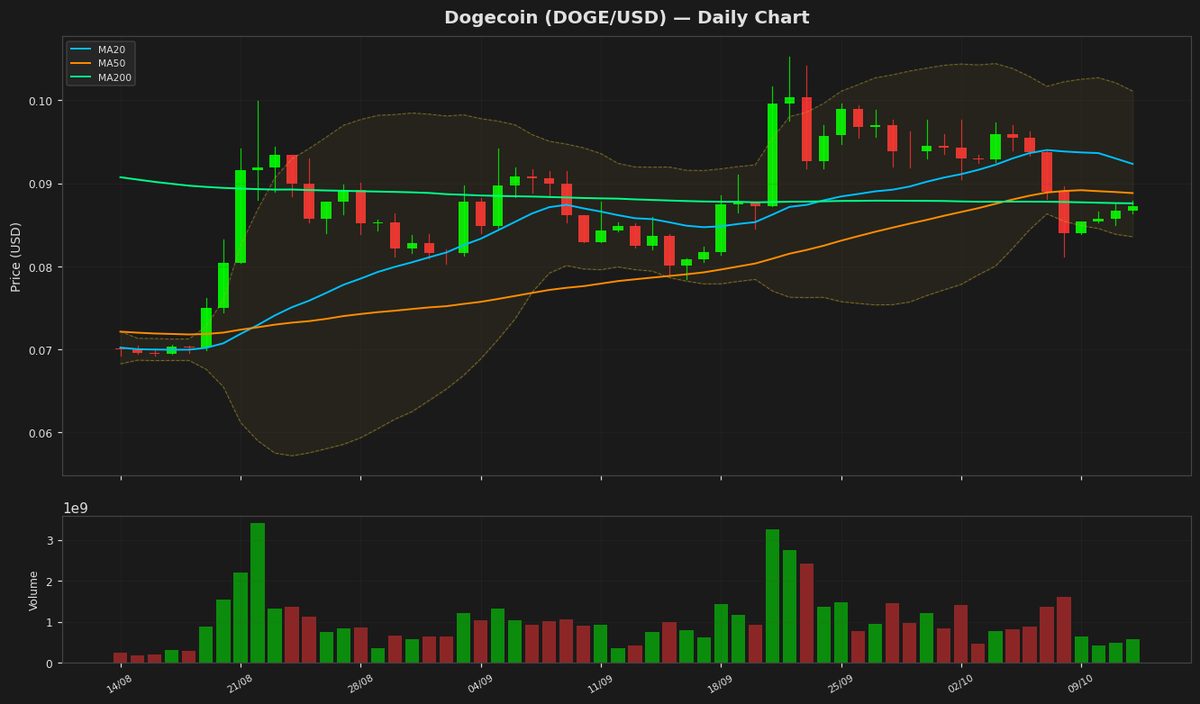
Dogecoin (DOGE) — +0.73%
$0.087350 52W: $0.067973 — $0.118255
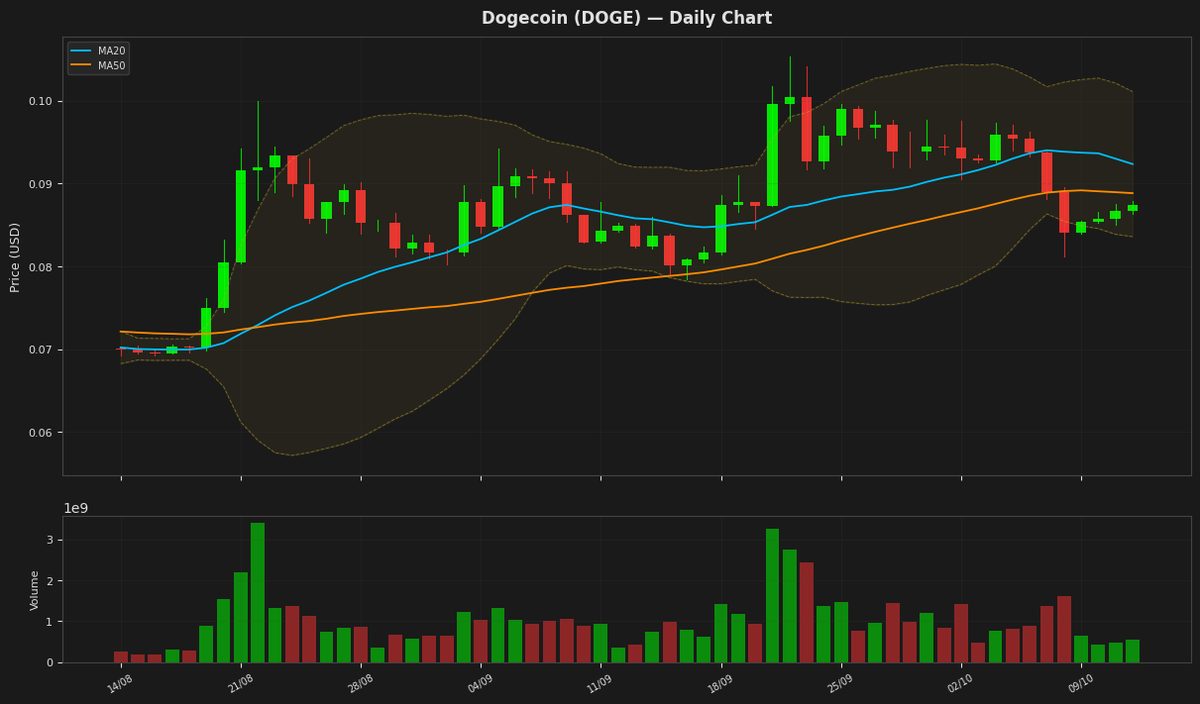
Dogecoin is currently trading at $0.087350, remaining below both its 20-day and 50-day moving averages, which indicates a prevailing bearish trend. The RSI of 34.08 suggests the asset is approaching oversold territory, while the negative MACD and signal line crossover confirm downward momentum. Price action remains contained within the Bollinger Bands, with the lower band at $0.083576 serving as immediate support.
Disclaimer
The content on MarketsFN.com is provided for educational and informational purposes only. It does not constitute financial advice or investment recommendations. All investments involve risk. Past performance does not guarantee future results.