Ethereum Dips to $2,474 as RSI Holds Neutral at 55.2
QuoteReporter
•2 min read
Ethereum Dips to $2,474 as RSI Holds Neutral at 55.2
Ethereum (ETH/USD) | September 15, 2026 $2,474.1499 -1.60%
🔍 Technical Analysis
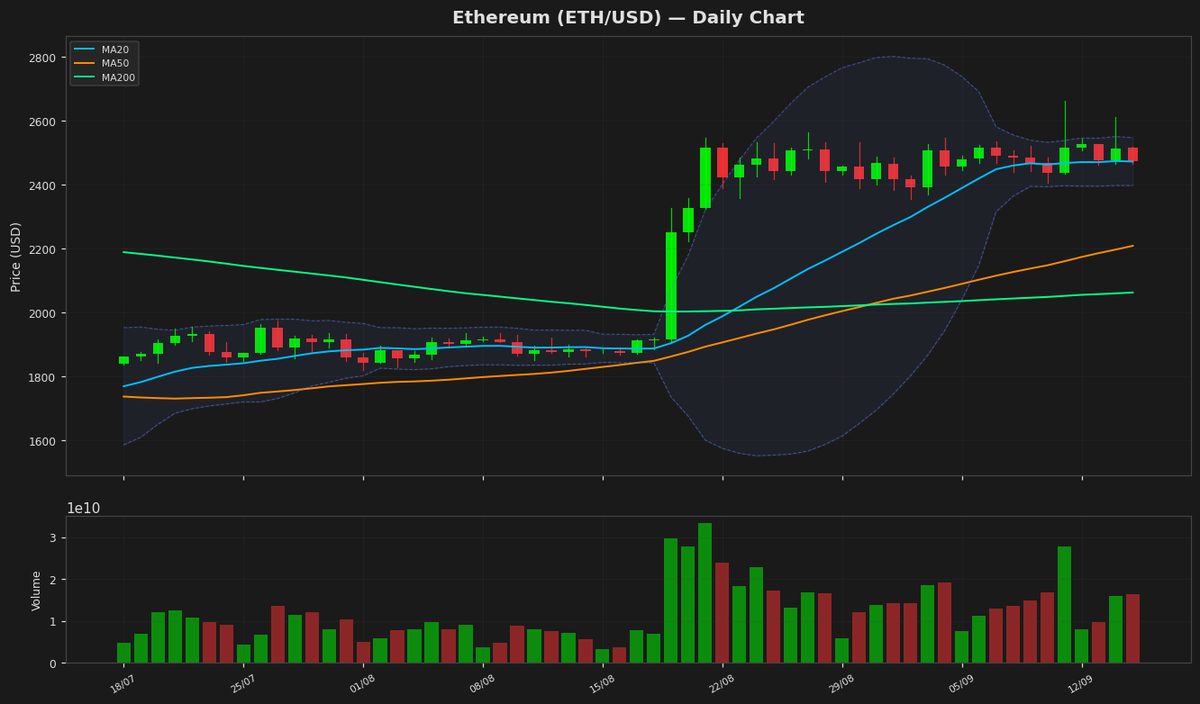
Ethereum (ETH) is currently trading at $2,474.15, down 1.60% on the day, showing mild bearish pressure after recent gains. The price is hovering near the 20-day moving average (MA20) at $2,472.51, indicating a critical juncture where a break below could signal short-term weakness. The 50-day MA ($2,208.93) and 200-day MA ($2,062.96) remain below the current price, suggesting the broader trend remains bullish, with the MA50 acting as a key support level. Bollinger Bands show the upper band at $2,547.46 and the lower band at $2,397.57, with ETH trading near the midline, reflecting neutral volatility. The Relative Strength Index (RSI) at 55.15 is in neutral territory, neither overbought nor oversold, leaving room for directional momentum. The MACD at 72.89 is below the signal line (91.05), indicating weakening bullish momentum but not yet a confirmed downtrend. Key resistance lies near the yearly high of $3,397.90, while immediate support is at the MA20, followed by $2,397.57 (lower Bollinger Band). A break below $2,397.57 could test the MA50, while a push above $2,547.46 may target higher resistance levels. The Average True Range (ATR) of 90.07 suggests moderate volatility, warranting caution in near-term trades.
Technical Metrics
| Metric | Value |
|---|---|
| Current Price | $2,474.1499 |
| Daily Change | -1.60% |
| MA 20 | $2,472.5143 |
| % from MA20 | +0.07% |
| MA 50 | $2,208.9304 |
| % from MA50 | +12.01% |
| MA 200 | $2,062.9613 |
| % from MA200 | +19.93% |
| BB Upper | $2,547.4580 |
| % from BB Upper | -2.88% |
| BB Lower | $2,397.5706 |
| % from BB Lower | +3.19% |
| RSI (14) | 55.16 |
| MACD | 72.885500 |
| MACD Signal | 91.050938 |
| ATR (14) | 90.065377 |
| 3-Day High | $2,612.4033 |
| 3-Day Low | $2,462.8396 |
| 52-Week High | $3,397.8977 |
| % from 52W High | -27.19% |
| 52-Week Low | $1,506.5057 |
| % from 52W Low | +64.23% |
| YTD High | $3,397.8977 |
| % from YTD High | -27.19% |
| YTD Low | $1,506.5057 |
| % from YTD Low | +64.23% |
📊 Market Commentary
Ethereum (ETH) is currently trading at $2,474.1499, down 1.60% on the day, as the broader cryptocurrency market experiences mild bearish pressure. The Relative Strength Index (RSI) sits at 55.2, indicating neutral momentum with neither overbought nor oversold conditions. Over the past 52 weeks, ETH has traded between $1,506.5057 and $3,397.8977, reflecting significant volatility but maintaining a strong base above $1,500.
Market sentiment for Ethereum remains cautiously optimistic, supported by ongoing network upgrades and institutional interest in its ecosystem. However, short-term price action is influenced by macroeconomic factors, including shifting expectations around Federal Reserve policy and risk appetite in traditional markets. Traders are closely watching the $2,400 support level, which has held firm in recent weeks. A break below this zone could signal further downside toward $2,200, while a rebound above $2,500 may reignite bullish momentum.
Key resistance levels to monitor include $2,600 and the psychological $3,000 mark, last tested in early 2024. On-chain metrics, such as exchange inflows and active addresses, are being scrutinized for signs of accumulation or distribution. With Ethereum’s fundamentals remaining robust—driven by Layer 2 adoption and staking activity—long-term holders appear unfazed by short-term fluctuations. For now, ETH remains range-bound, awaiting a catalyst for its next decisive move.
Market sentiment for Ethereum remains cautiously optimistic, supported by ongoing network upgrades and institutional interest in its ecosystem. However, short-term price action is influenced by macroeconomic factors, including shifting expectations around Federal Reserve policy and risk appetite in traditional markets. Traders are closely watching the $2,400 support level, which has held firm in recent weeks. A break below this zone could signal further downside toward $2,200, while a rebound above $2,500 may reignite bullish momentum.
Key resistance levels to monitor include $2,600 and the psychological $3,000 mark, last tested in early 2024. On-chain metrics, such as exchange inflows and active addresses, are being scrutinized for signs of accumulation or distribution. With Ethereum’s fundamentals remaining robust—driven by Layer 2 adoption and staking activity—long-term holders appear unfazed by short-term fluctuations. For now, ETH remains range-bound, awaiting a catalyst for its next decisive move.
Disclaimer
The content on MarketsFN.com is provided for educational and informational purposes only. It does not constitute financial advice or investment recommendations. All investments involve risk. Cryptocurrency markets are highly volatile. Past performance does not guarantee future results.