Ethereum and Altcoins Surge as Market Momentum Builds
QuoteReporter
•5 min read
Crypto Market Report | October 13, 2026
📊 Crypto Market Overview
The cryptocurrency market is currently displaying a positive overall sentiment, with most major assets experiencing gains. Bitcoin is trading at $83,835.3516, up 2.54% today, and its RSI stands at 50.7, indicating a neutral position. The MACD is at 685.4457, suggesting a bullish trend. Other major cryptocurrencies, such as Ethereum, Ripple, Solana, and Dogecoin, are also in the green, with gains ranging from 2.69% to 3.48%.
Ethereum's RSI is currently at 38.1, indicating it is approaching oversold territory, while its MACD is negative. Similarly, Ripple, Solana, and Dogecoin are also in oversold territory according to their RSI values. BNB is trading positively, with an RSI of 45.7 and a positive MACD. Tron is the laggard among the major assets, with a modest gain of 0.28%.
The macro context is influenced by various news headlines. Binance's decision to shut down its crypto mining pool services in November and South Korea's move to block 27 crypto websites are significant developments. The NFT market is also experiencing notable changes, with Blur shutting down its website. Meanwhile, technological advancements are being made, such as Aptos' rollout of Encrypted Mempool to curb frontrunning and sandwich attacks. FTX's crypto mining venture is now being utilized to advance AI. A significant on-chain transaction occurred as a Bitcoin whale that had remained dormant since the March 2020 crash moved $378 million.
Notable technical signals include the RSI values of Ethereum, Ripple, Solana, and Dogecoin indicating they are nearing oversold territory, while Bitcoin's RSI remains neutral. The MACD values for most assets are either positive or showing signs of a potential reversal. Overall, the market is currently driven by a mix of positive and negative factors, with various assets displaying different technical signals.
Ethereum's RSI is currently at 38.1, indicating it is approaching oversold territory, while its MACD is negative. Similarly, Ripple, Solana, and Dogecoin are also in oversold territory according to their RSI values. BNB is trading positively, with an RSI of 45.7 and a positive MACD. Tron is the laggard among the major assets, with a modest gain of 0.28%.
The macro context is influenced by various news headlines. Binance's decision to shut down its crypto mining pool services in November and South Korea's move to block 27 crypto websites are significant developments. The NFT market is also experiencing notable changes, with Blur shutting down its website. Meanwhile, technological advancements are being made, such as Aptos' rollout of Encrypted Mempool to curb frontrunning and sandwich attacks. FTX's crypto mining venture is now being utilized to advance AI. A significant on-chain transaction occurred as a Bitcoin whale that had remained dormant since the March 2020 crash moved $378 million.
Notable technical signals include the RSI values of Ethereum, Ripple, Solana, and Dogecoin indicating they are nearing oversold territory, while Bitcoin's RSI remains neutral. The MACD values for most assets are either positive or showing signs of a potential reversal. Overall, the market is currently driven by a mix of positive and negative factors, with various assets displaying different technical signals.
📰 Crypto News
- Here’s what happened in crypto today
- Blur is shutting down its website, so why are NFT collectors cheering?
- Binance to shut down crypto mining pool services in November
- South Korea moves to block 27 crypto websites, including KuCoin, MEXC
- Meta claims new Muse Wonder AI models rival OpenAI, Anthropic
- Aptos rolls out Encrypted Mempool to curb frontrunning, sandwich attacks
- FTX’s crypto mining venture is now used to advance AI
- Bitcoin whale that sat through the March 2020 crash moves $378 million
- Tokenized SanDisk bets saw more liquidations than XRP as Asia’s chip rout wipes out $800 million
- Once-largest Ethereum NFT marketplace Blur is shutting down after volumes collapse 99%
- Bitcoin rebounds above $83,000 as it decouples from tumbling Korean stocks and Nasdaq futures
- AI Will Hit 40% of Jobs, IMF Warns. Young People Are First in Line
- Standard Chartered Will Hold Ripple's Stablecoin in Dubai—And Let Clients Trade With It Without Moving It
- Meta's New Muse Wonder Finally Puts Zuckerberg in the Frontier AI Race
🔍 Technical Analysis
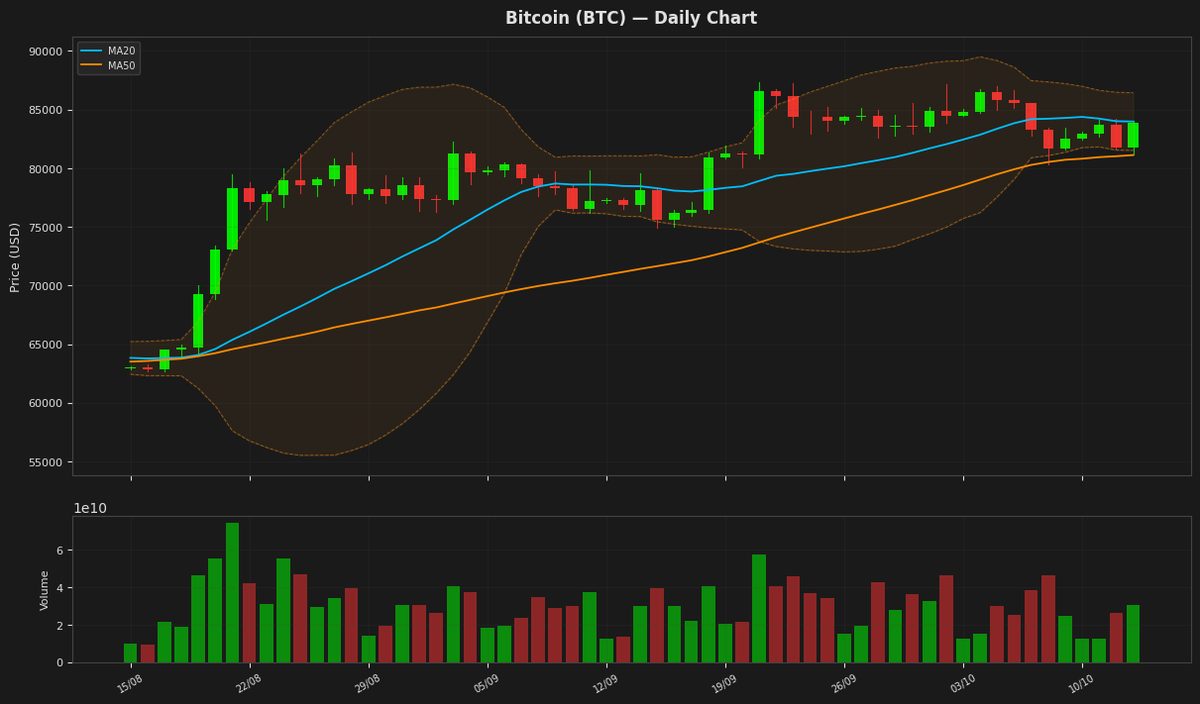
Bitcoin (BTC) — +2.54%
$83,835.35 52W: $57,747.77 — $87,363.76
Bitcoin's price is currently trading near its 20-day moving average at $83,979, indicating a balance between buyers and sellers. The RSI reading of 50.73 suggests a neutral market sentiment. The MACD line is below its signal line, indicating a potential bearish signal, while the Bollinger Bands suggest that the price is still within a relatively normal range. The ATR indicates moderate volatility.
Ethereum (ETH) — +3.48%
$2,529.53 52W: $1,506.51 — $2,805.50
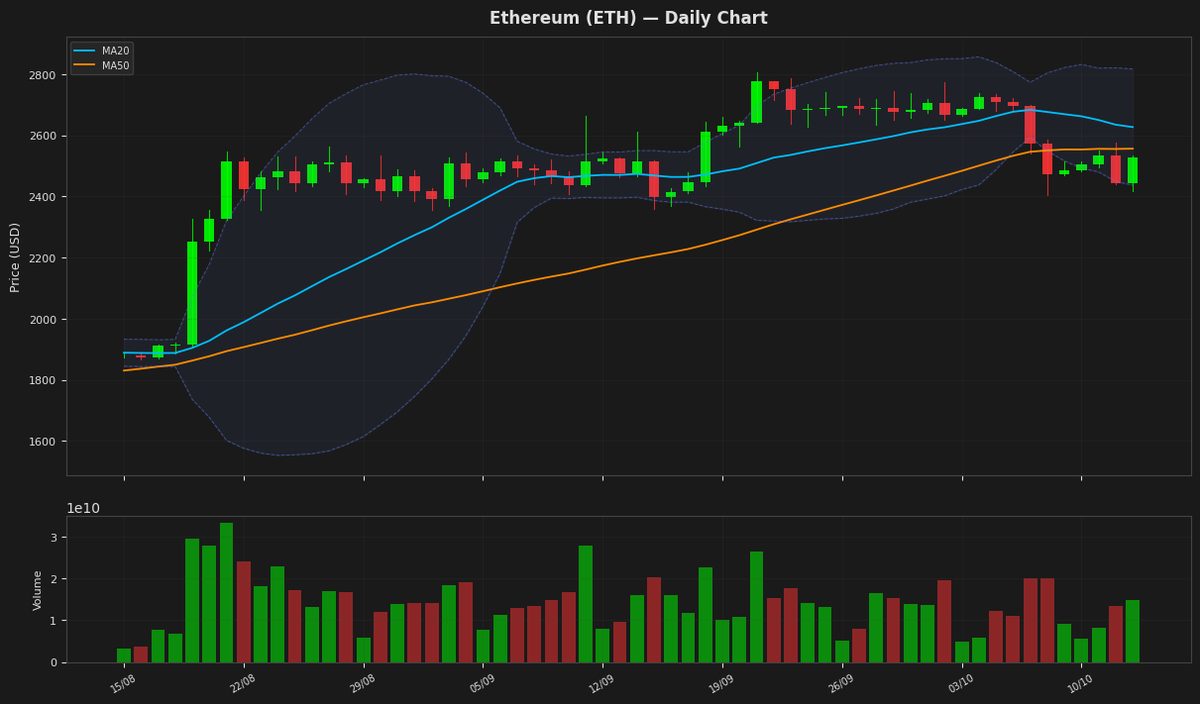
Ethereum's price is currently at $2,529.53, showing a daily increase of 3.48%, and is positioned near the middle of its Bollinger Bands, with the upper band at $2,817.86 and the lower band at $2,437.00. The RSI is at 38.08, indicating that the asset is approaching oversold territory, while the MACD is below its signal line, suggesting a potential for a bullish crossover. The ATR indicates moderate volatility.
Ripple (XRP) — +2.77%
$1.3766 52W: $0.988422 — $1.6838
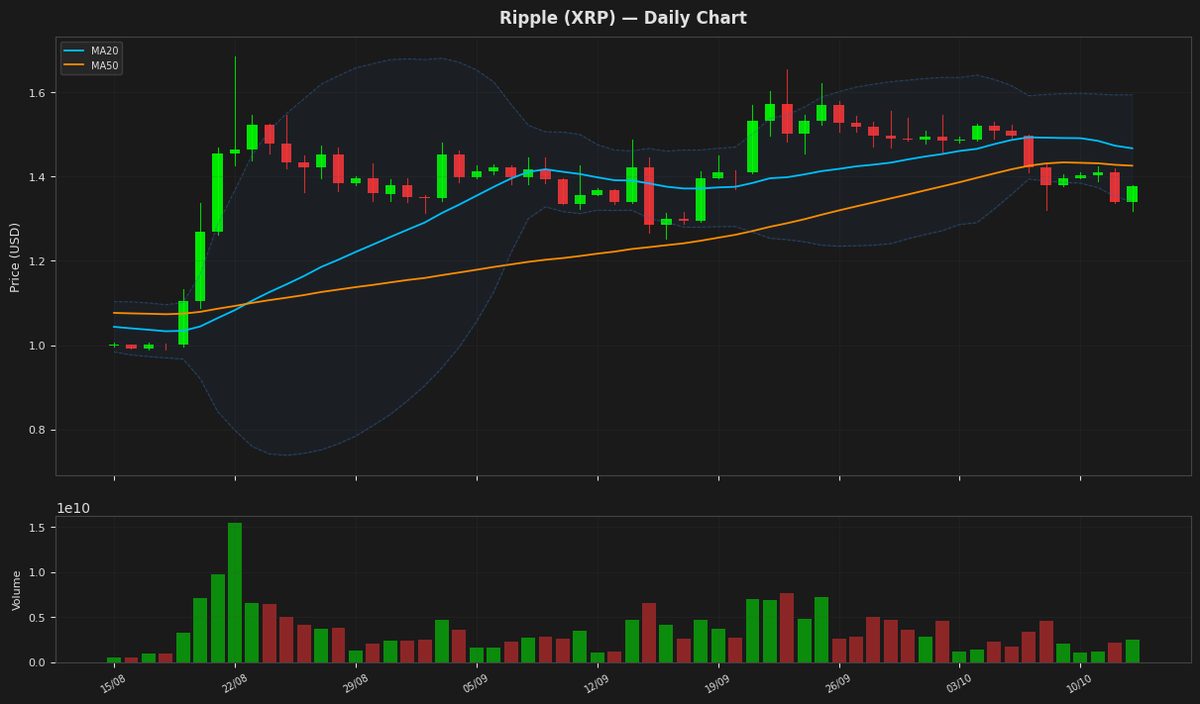
Ripple's price is currently at $1.376600, showing a daily gain of 2.77%, and is positioned near the lower band of the Bollinger Bands at 1.339729, indicating potential support. The RSI is at 32.798016, suggesting the asset is oversold and may be due for a rebound. The MACD is below the signal line, indicating a bearish trend, but the gap is narrowing. The price is also below both the MA20 and MA50, indicating a short-term downtrend.
Solana (SOL) — +2.69%
$108.4000 52W: $60.4147 — $124.6174
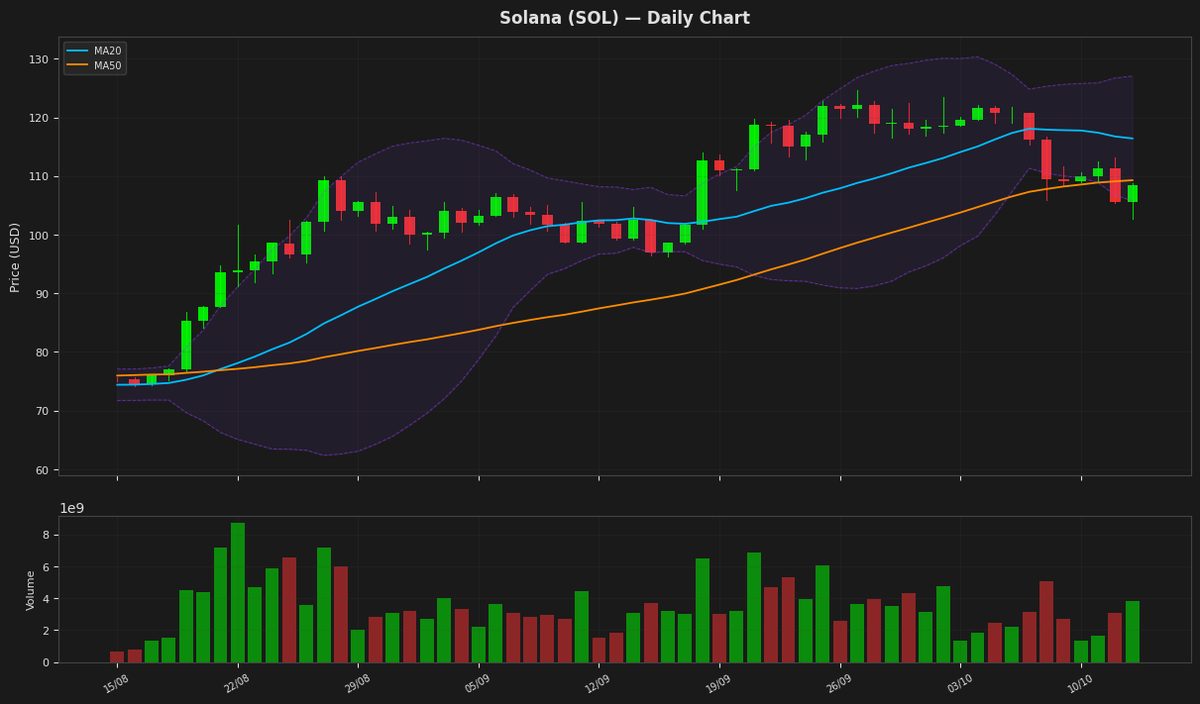
Solana's price is currently at $108.40, showing a daily gain of 2.69%, and is positioned near the lower Bollinger Band at $105.76, indicating potential support. The RSI at 30.75 suggests the asset is oversold, potentially setting up for a rebound. The MACD is below its signal line, indicating a bearish trend, but the proximity to the oversold territory may signal a reversal. The price is also below both MA20 and MA50, indicating a bearish short to medium term trend.
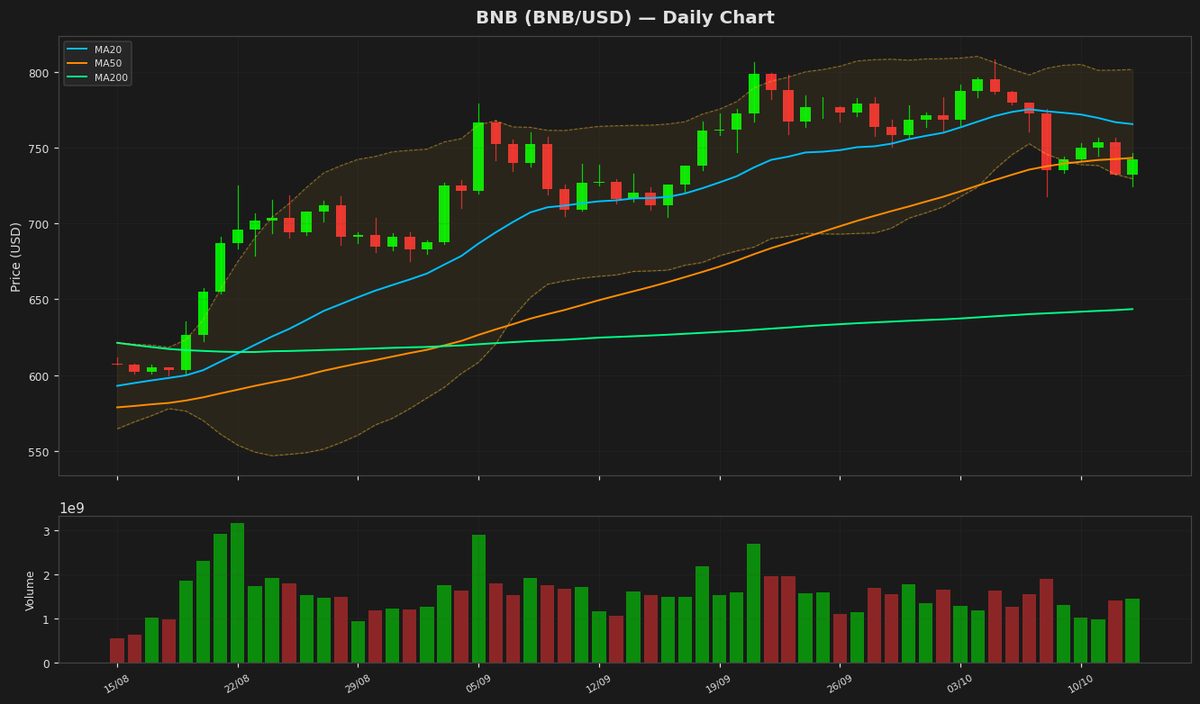
BNB (BNB) — +1.73%
$744.7800 52W: $538.5992 — $808.4329
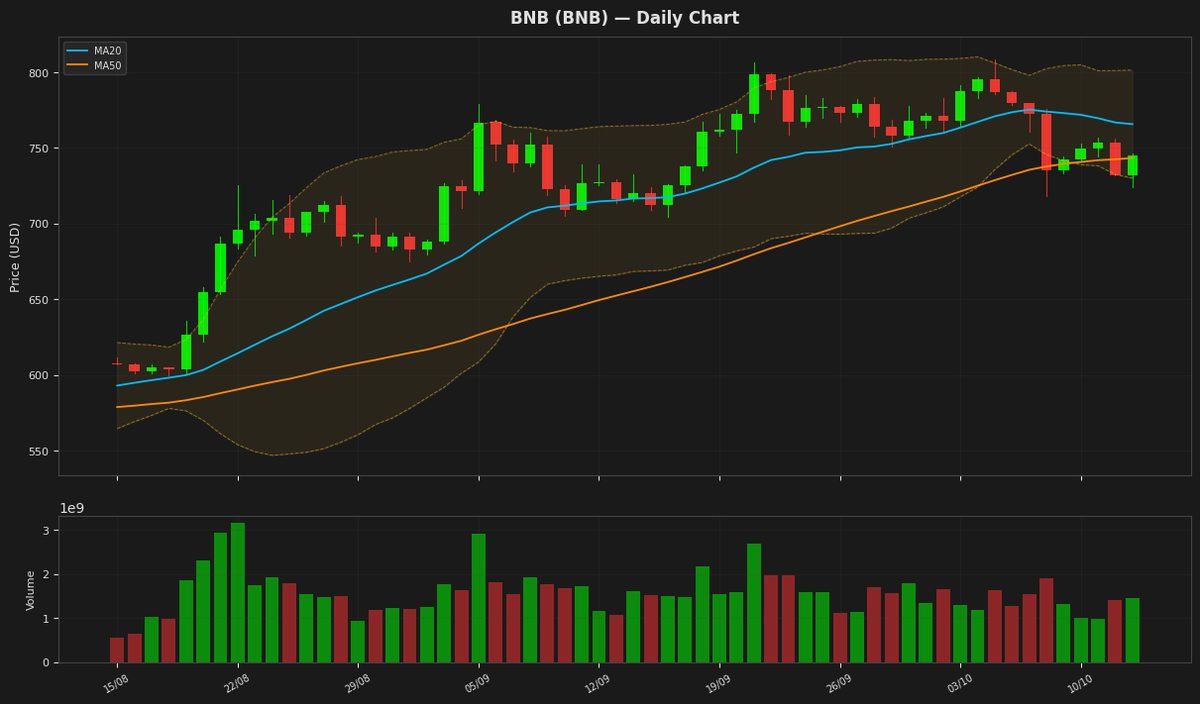
BNB is currently trading at $744.78, showing a slight daily increase of 1.73% while remaining positioned between the MA50 and MA20. The RSI of 45.73 indicates a neutral momentum, while the price stays within the Bollinger Band range of $729.97 to $801.38. Despite a positive MACD, the asset remains below its 20-day moving average and is trading approximately 7.5% below its 52-week high.
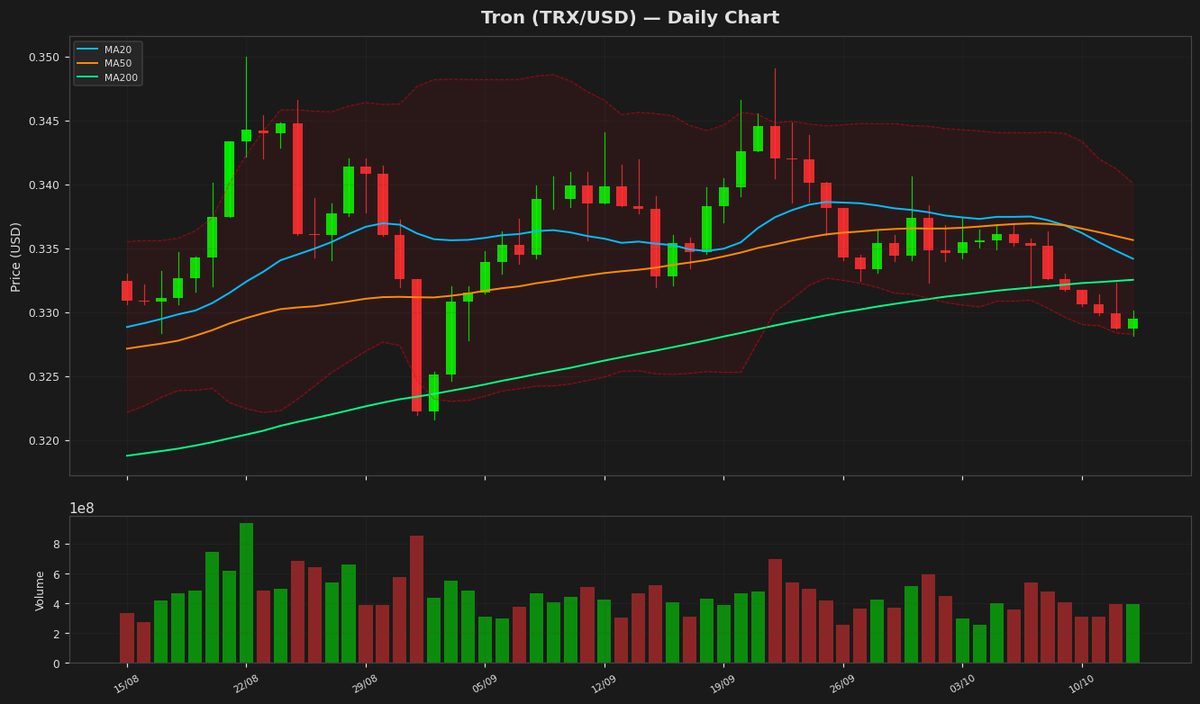
Tron (TRX) — +0.28%
$0.329660 52W: $0.268138 — $0.376332
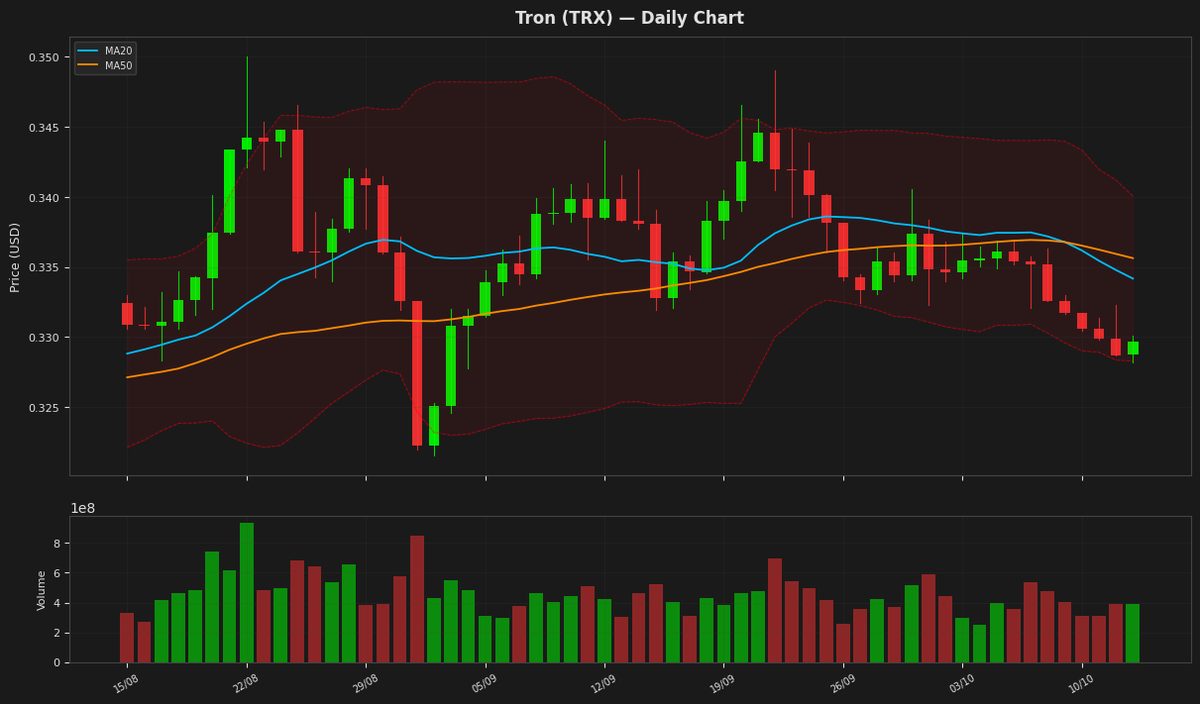
Tron is currently trading at 0.329660, remaining below both the 20-day and 50-day moving averages, which indicates a prevailing short-term bearish trend. The RSI of 34.71 suggests the asset is approaching oversold territory, while the price is hovering near the lower Bollinger Band of 0.328298. Negative MACD and signal values further confirm downward momentum, though the low ATR indicates minimal volatility at current levels.
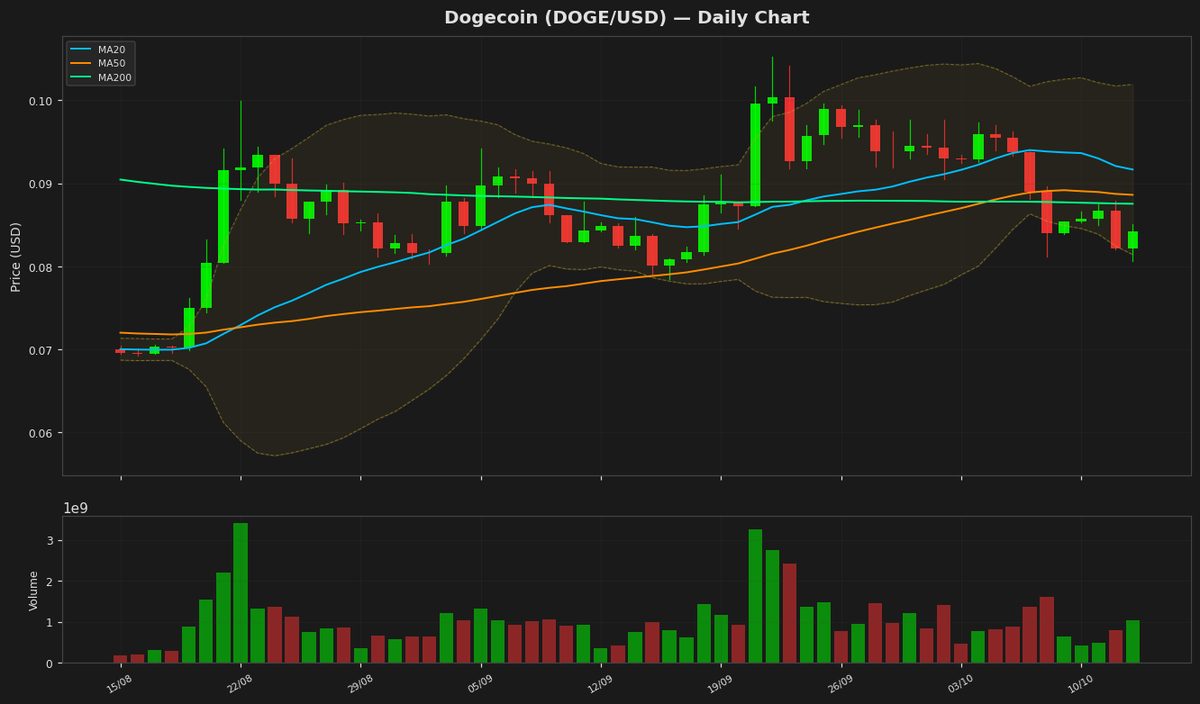
Dogecoin (DOGE) — +3.11%
$0.084730 52W: $0.067973 — $0.118255
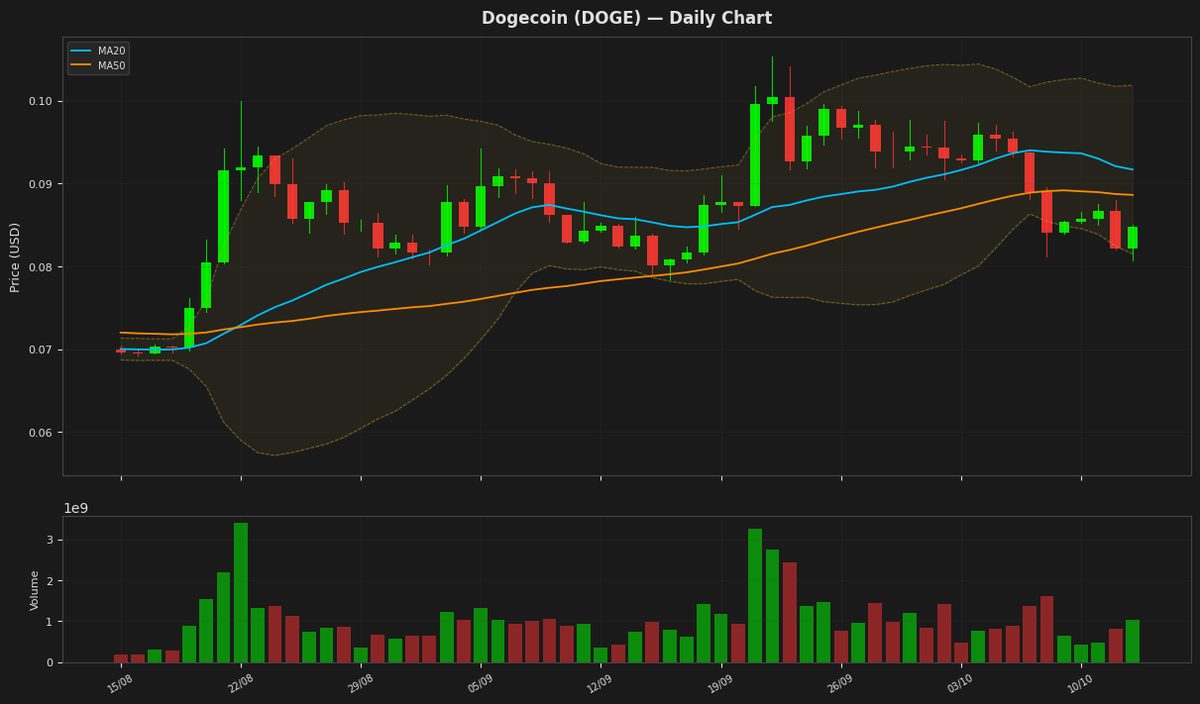
Dogecoin is currently trading at $0.084730, showing a modest daily gain of 3.11% while remaining below both the 20-day and 50-day moving averages. The RSI of 33.07 indicates the asset is approaching oversold territory, though the negative MACD suggests that bearish momentum persists. Price action is currently contained within the Bollinger Bands, sitting closer to the lower support level of $0.081502.
Disclaimer
The content on MarketsFN.com is provided for educational and informational purposes only. It does not constitute financial advice or investment recommendations. All investments involve risk. Past performance does not guarantee future results.