Crypto Surge: Solana Leads Gains as Major Coins Climb
QuoteReporter
•5 min read
Crypto Market Report | October 19, 2026
📊 Crypto Market Overview
The cryptocurrency market is currently exhibiting a cautious but positive short-term recovery, with most major assets posting modest gains. Bitcoin leads the market at 82,703.70 dollars, up 0.84 percent, while Solana emerges as a key mover among large-cap assets with a 1.54 percent increase to 105.63 dollars. This upward movement is occurring against a complex macro backdrop, where positive GDP data from China has provided a tailwind for global risk assets, including the Nasdaq and Bitcoin. However, institutional sentiment remains mixed, as evidenced by 549 million dollars in combined outflows from Bitcoin and Ether ETFs, with Ethereum outflows specifically nearing 1 billion dollars for October.
Technical signals across the board suggest significant oversold conditions. The Relative Strength Index for several top assets is notably low, with Dogecoin at 19.8, Ripple at 22.5, and Solana at 23.8, indicating a potential exhaustion of selling pressure. While Bitcoin maintains a positive MACD of 58.65, most other major assets, including Ethereum and BNB, are reporting negative MACD values, reflecting a lingering bearish momentum despite the daily price increases.
Fundamental developments continue to shape the landscape, ranging from security concerns, such as the Qubic chain freeze following a wallet drain, to regulatory discussions in South Korea regarding potential tax delays. Additionally, the movement of 34 million dollars in Bitcoin from a 2013-era whale highlights the continued activity of long-term holders. Meanwhile, the industry is addressing future-proofing measures, with Zcash developers working on quantum-resistant swaps and Zoom introducing proof of human badges to combat deepfakes. Overall, the market is navigating a period of technical fragility balanced by supportive global macroeconomic data, as investors weigh institutional outflows against the ability of major assets to maintain their current support levels.
📰 Crypto News
- Bitcoin, Ether ETFs shed $549M as October ETH outflows near $1B
- Zoom adds ‘proof of human’ badges to show you’re not a deepfake
- Here’s what happened in crypto today
- South Korea to meet crypto exchanges amid calls for tax delay
- Qubic freezes chain after attacker drains 1.4K wallets with weak seeds
- Richard Heart caught ‘off-guard,’ QDay gets even closer: Hodler’s Digest
- Bitcoin whale moves $34 million in BTC it got in 2013 when coins traded at $131
- Zcash developers plan a fix to keep ZEC swaps private from future quantum computers
- XRP Ledger is set to fix its lending code before anyone can use it
- Bitcoin, Korea’s Kospi and Nasdaq futures rally as China GDP beats estimates
- Deutsche Bank targets Asia crypto custody expansion in 2027 as German launch nears
- SEC tokenized stock framework faces issuer pushback as Broadcom, Verizon object to OKX-ICE listing
🔍 Technical Analysis
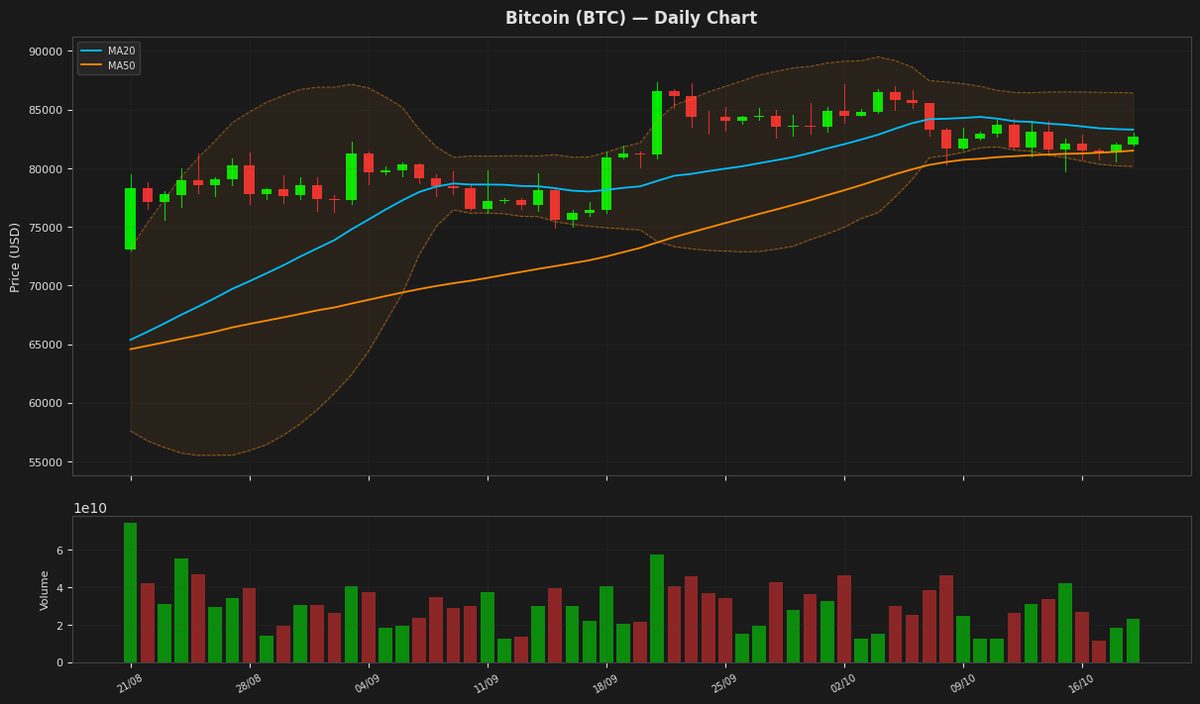
Bitcoin (BTC) — +0.84%
$82,703.70 52W: $57,747.77 — $87,363.76
Bitcoin is currently trading at $82,703.70, positioned slightly below its 20-day moving average of $83,287.42 but remaining above the 50-day average of $81,499.05. The RSI of 38.63 indicates bearish momentum or an oversold condition, while the price remains contained within the Bollinger Bands. With a MACD below its signal line and the price trading below the 20-day MA, the short-term outlook suggests a consolidation phase beneath the 52-week high of $87,363.76.
Ethereum (ETH) — +0.96%
$2,431.90 52W: $1,506.51 — $2,805.50
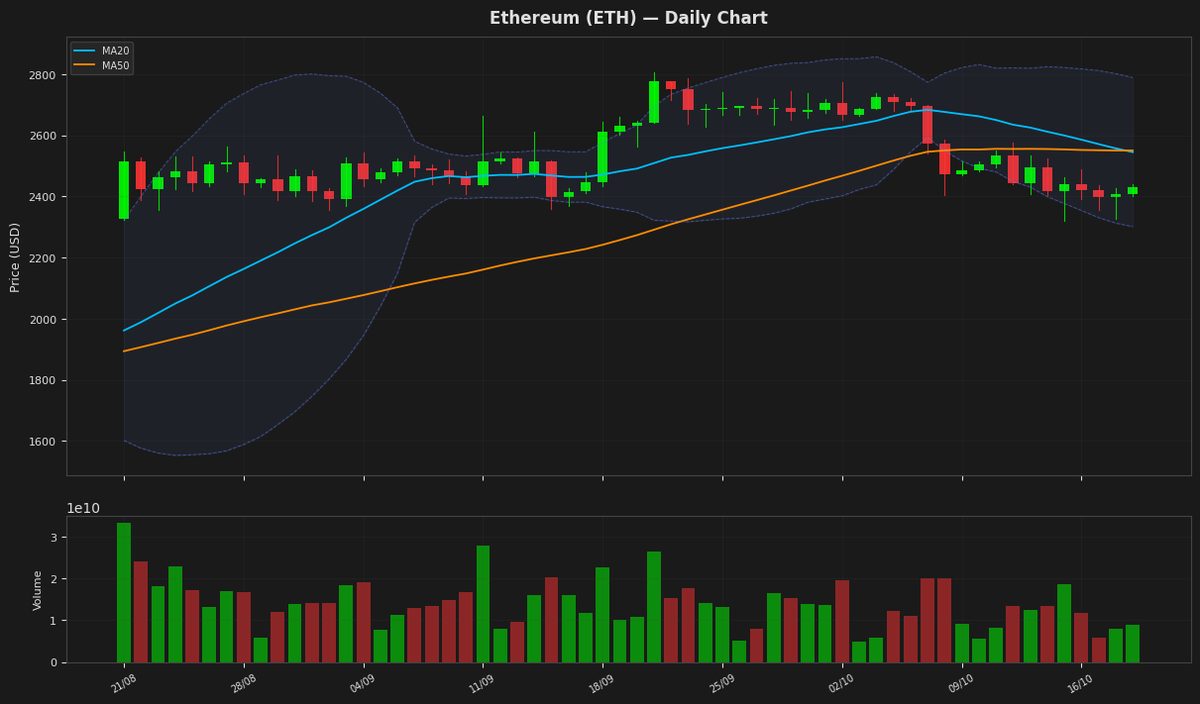
Ethereum is currently trading at $2,431.90, remaining below both the 20-day and 50-day moving averages, which indicates a prevailing bearish trend. The RSI of 27.42 suggests the asset is in oversold territory, although the negative MACD and signal line confirm strong downward momentum. Price action remains contained within the Bollinger Bands, with the lower boundary at $2,301.27 serving as immediate critical support.
Ripple (XRP) — +0.65%
$1.3135 52W: $0.988422 — $1.6838
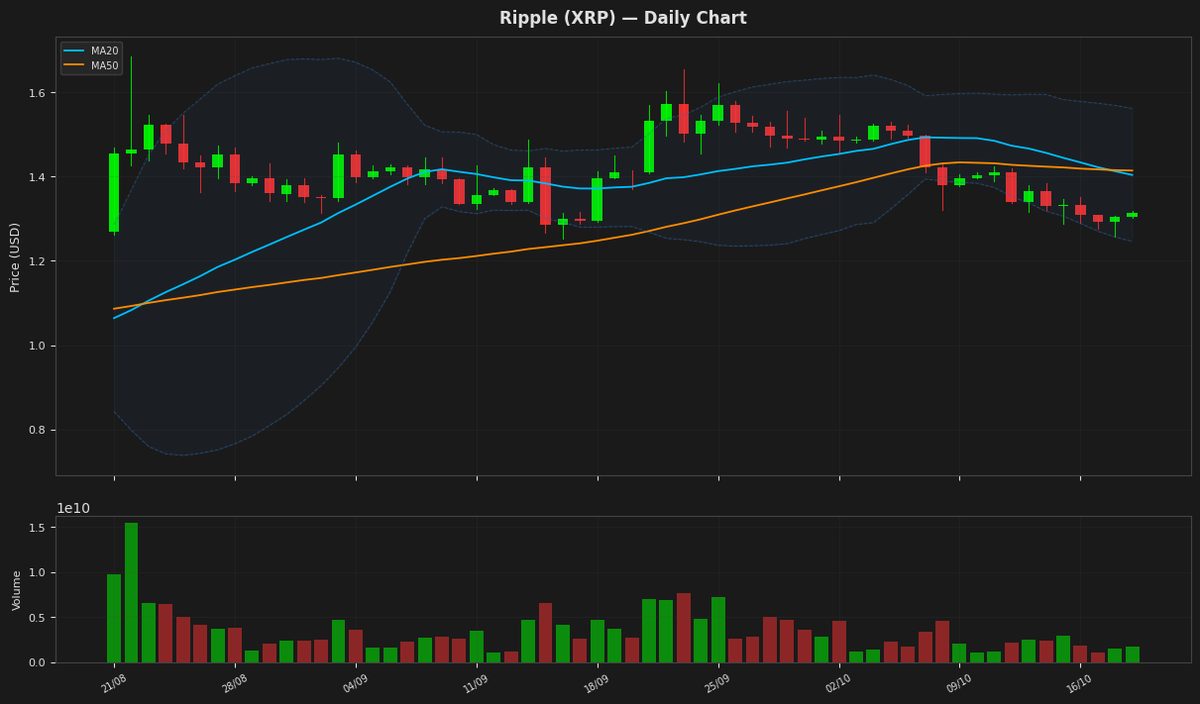
XRP is currently trading at $1.3135, remaining below both the 20-day and 50-day moving averages, which indicates a sustained bearish trend. The RSI of 22.55 suggests the asset is in oversold territory, while the MACD remains negative and below the signal line, confirming downward momentum. Price action is currently contained within the Bollinger Bands, sitting closer to the lower support level of $1.2461.
Solana (SOL) — +1.54%
$105.6300 52W: $60.4147 — $124.6174
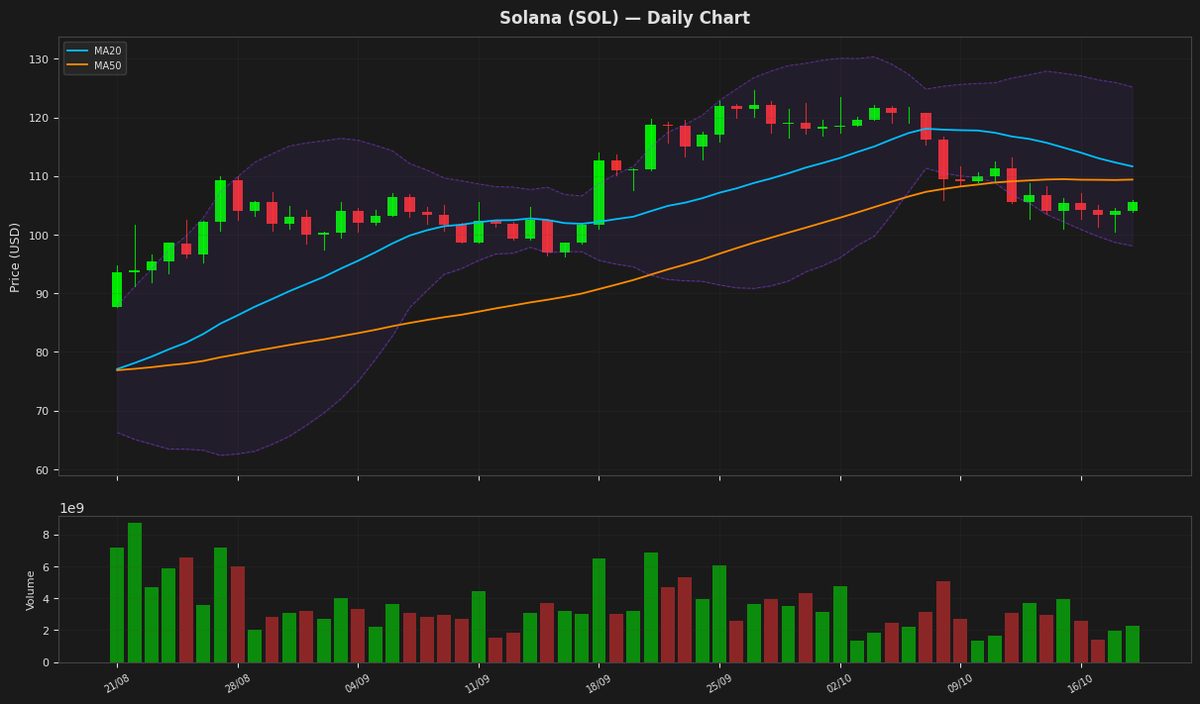
Solana is currently trading at 105.63, remaining below both the 20-day and 50-day moving averages, which indicates a prevailing bearish trend. The RSI of 23.83 suggests the asset is in oversold territory, while the negative MACD and signal line confirm downward momentum. Despite a slight daily gain of 1.54%, the price remains positioned between the lower Bollinger Band at 98.08 and the 52-week high of 124.62.
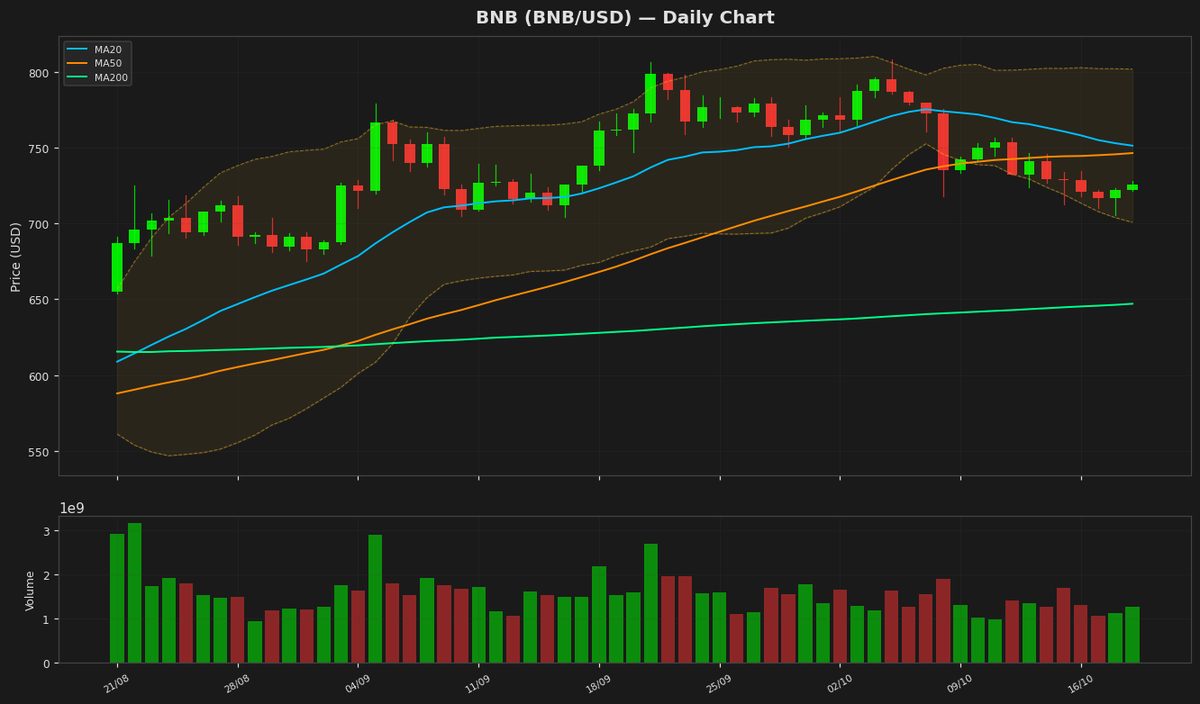
BNB (BNB) — +0.43%
$725.3900 52W: $538.5992 — $808.4329
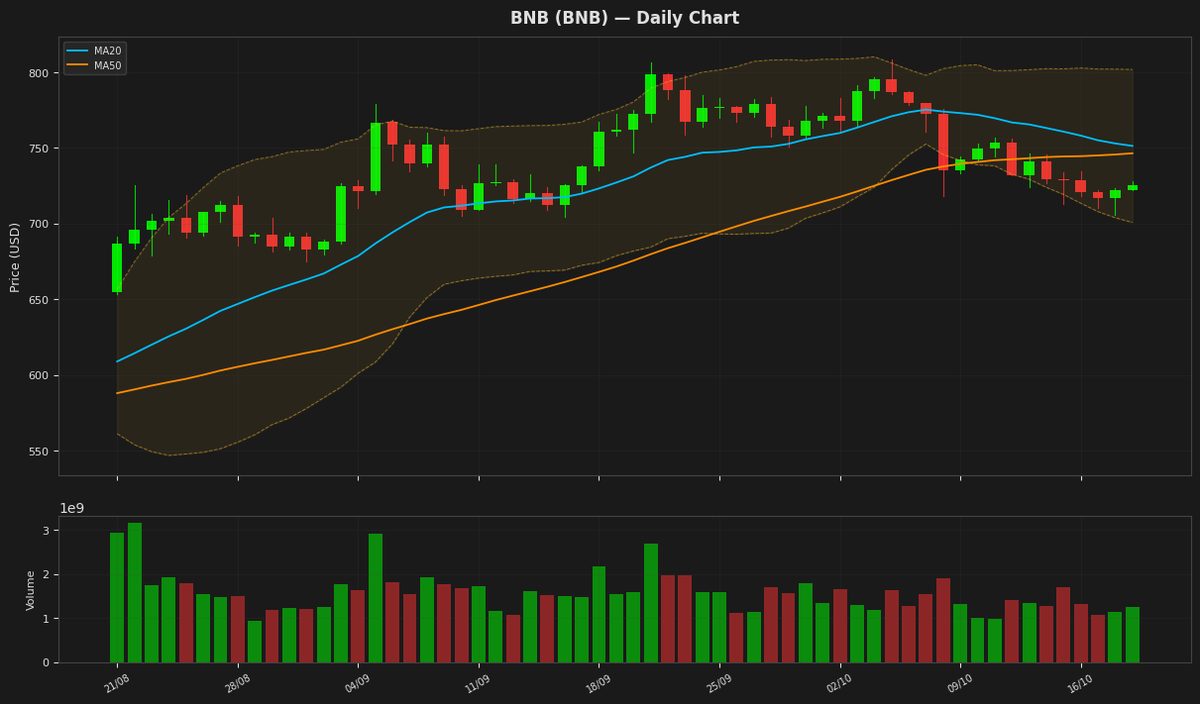
BNB is currently trading at 725.39, positioned below both the 20-day and 50-day moving averages, indicating a short-term bearish trend. The RSI of 26.87 suggests the asset is in oversold territory, while the MACD remains negative at -8.18, confirming continued downward momentum. Price action remains contained within the Bollinger Bands, with a lower support level established at 700.76.
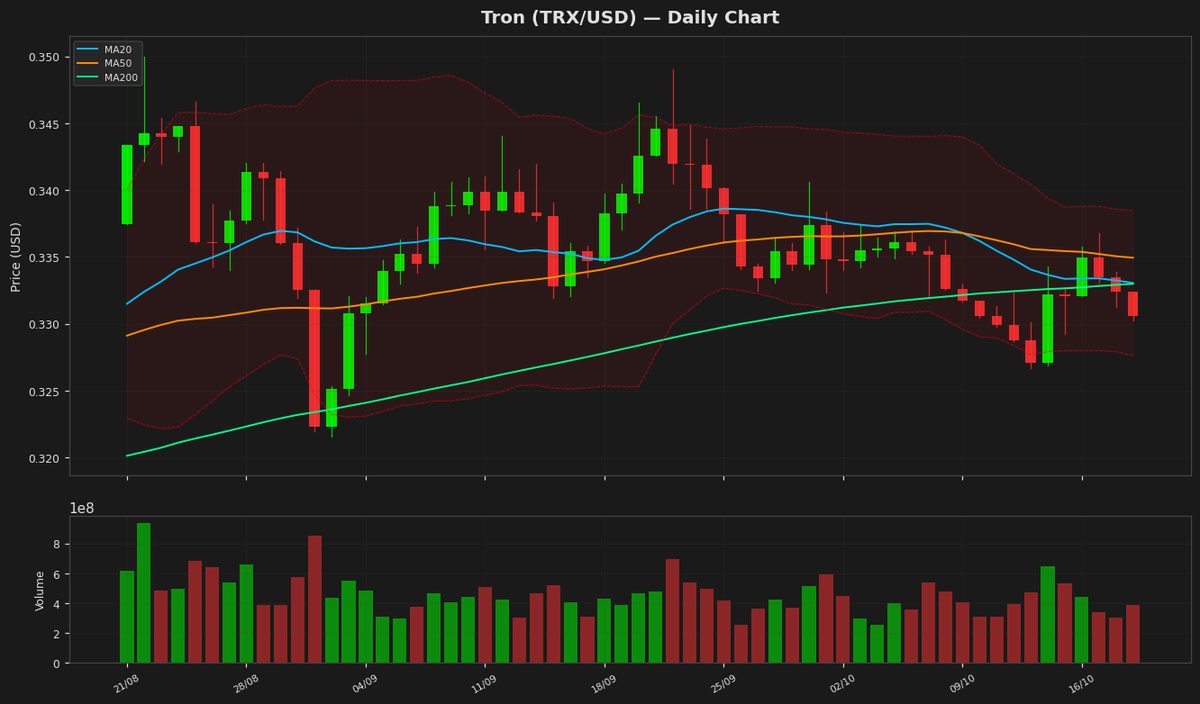
Tron (TRX) — -0.48%
$0.330788 52W: $0.273827 — $0.376332
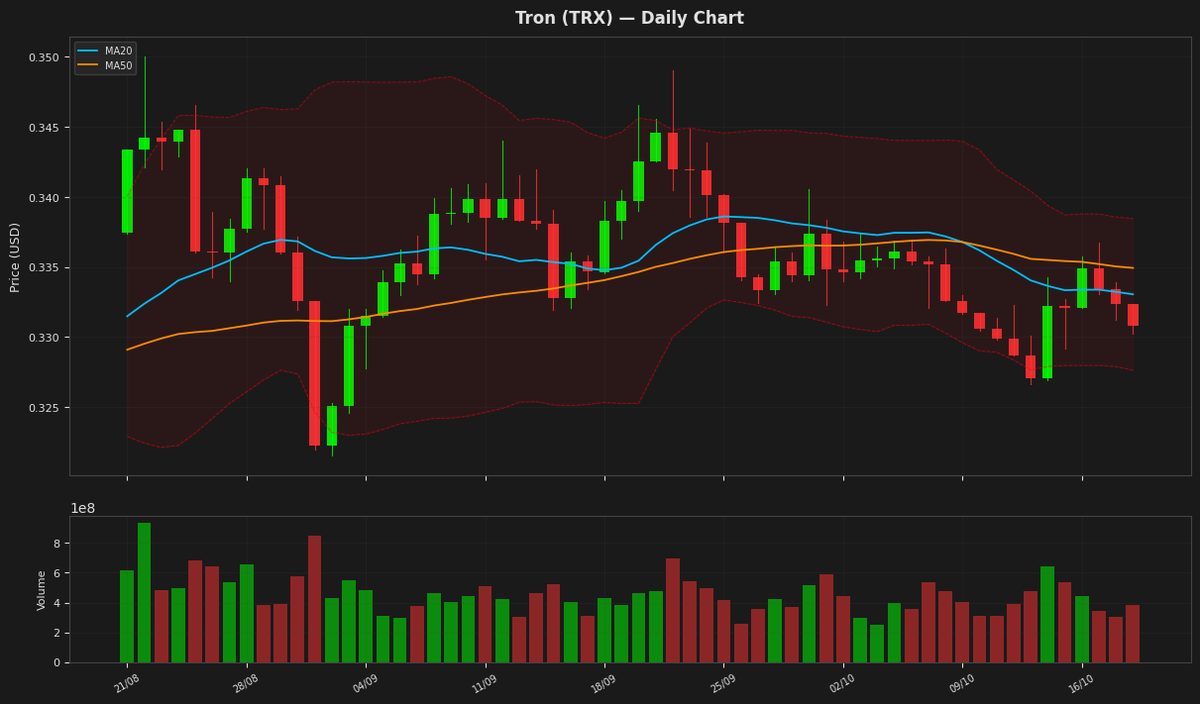
Tron is currently trading at $0.330788, showing a slight bearish trend as it remains below both the 20-day and 50-day moving averages. The RSI of 37.49 indicates weak momentum approaching oversold territory, while the MACD is slightly negative but showing a potential bullish crossover above the signal line. Price action is contained within the Bollinger Bands, with immediate support found at the lower band of $0.327642.
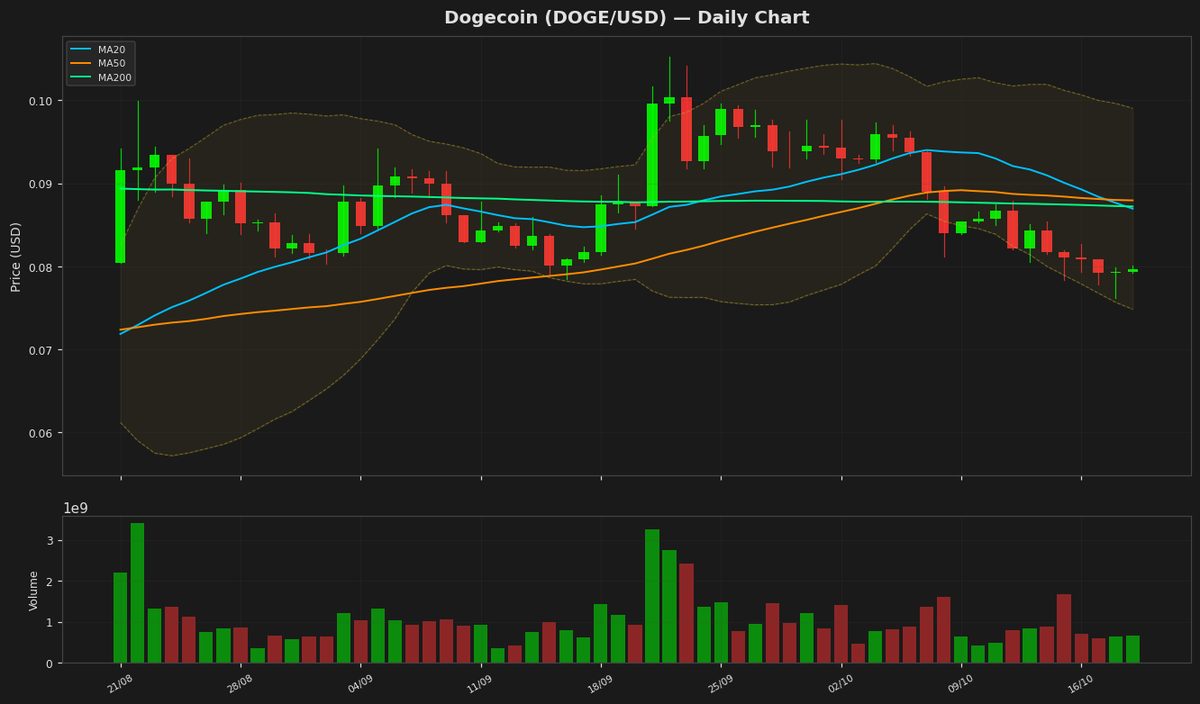
Dogecoin (DOGE) — +0.37%
$0.079620 52W: $0.067973 — $0.118255
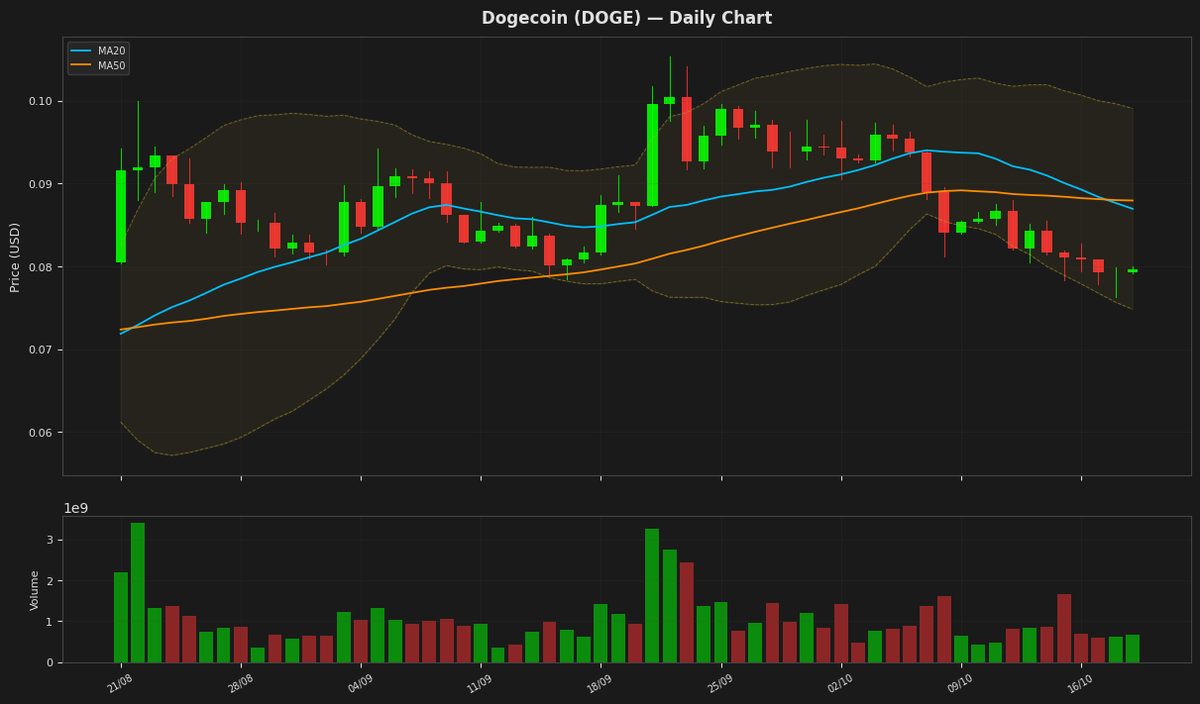
Dogecoin is currently trading at 0.079620, remaining below both its MA20 and MA50, which indicates a sustained bearish trend. The RSI of 19.78 signals that the asset is deeply oversold, though the MACD remains negative and below the signal line, suggesting downward momentum persists. Price action is currently contained within the Bollinger Bands, positioned closer to the lower boundary of 0.074816.
Disclaimer
The content on MarketsFN.com is provided for educational and informational purposes only. It does not constitute financial advice or investment recommendations. All investments involve risk. Past performance does not guarantee future results.