Crypto Market Update: Tron Surges as Bitcoin and Solana Decline Slightly Today
QuoteReporter
•5 min read
Crypto Market Update: Tron Surges as Bitcoin and Solana Decline Slightly Today
Crypto Market Report | September 30, 2026
📊 Crypto Market Overview
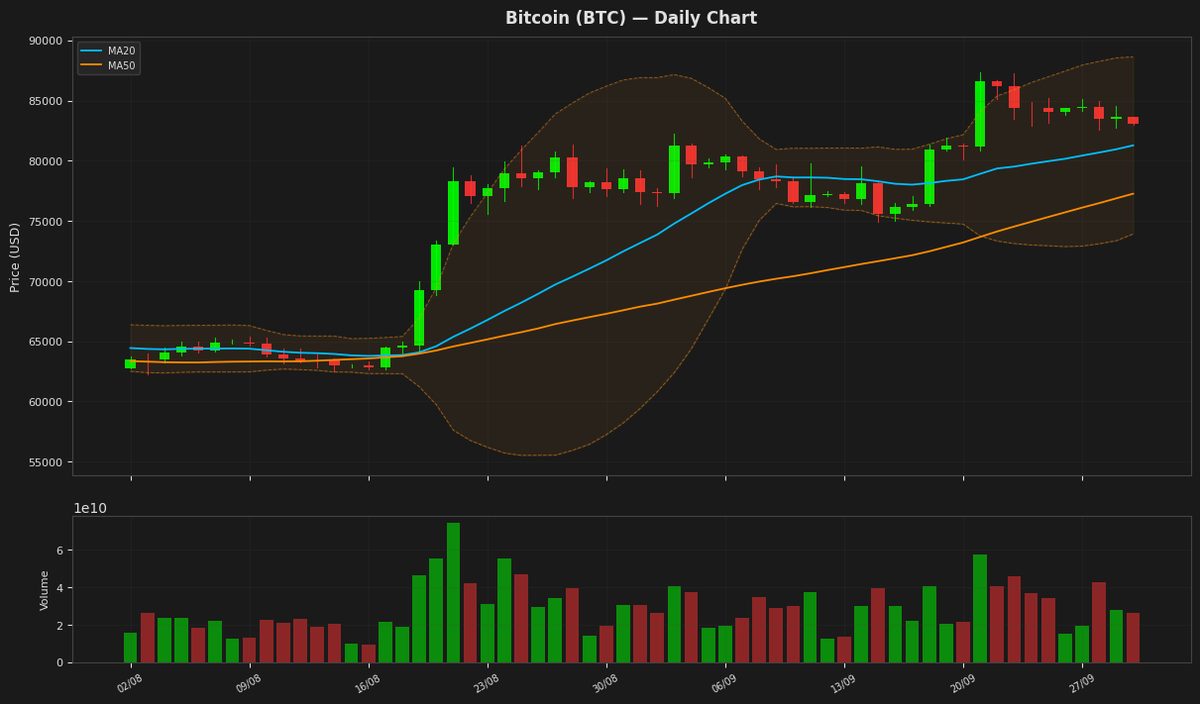
The cryptocurrency market is currently characterized by a mixed sentiment, with some assets experiencing minor gains while others see slight declines. Bitcoin, the largest cryptocurrency by market capitalization, is trading at $83,070.96, down 0.66% on the day, with its Relative Strength Index (RSI) standing at 72.7, indicating it is in overbought territory. The MACD indicator is at 2032.0159, suggesting a strong bullish momentum. Ethereum follows a similar trend, down 0.39% to $2,666.21, with an RSI of 75.3, also indicating overbought conditions.
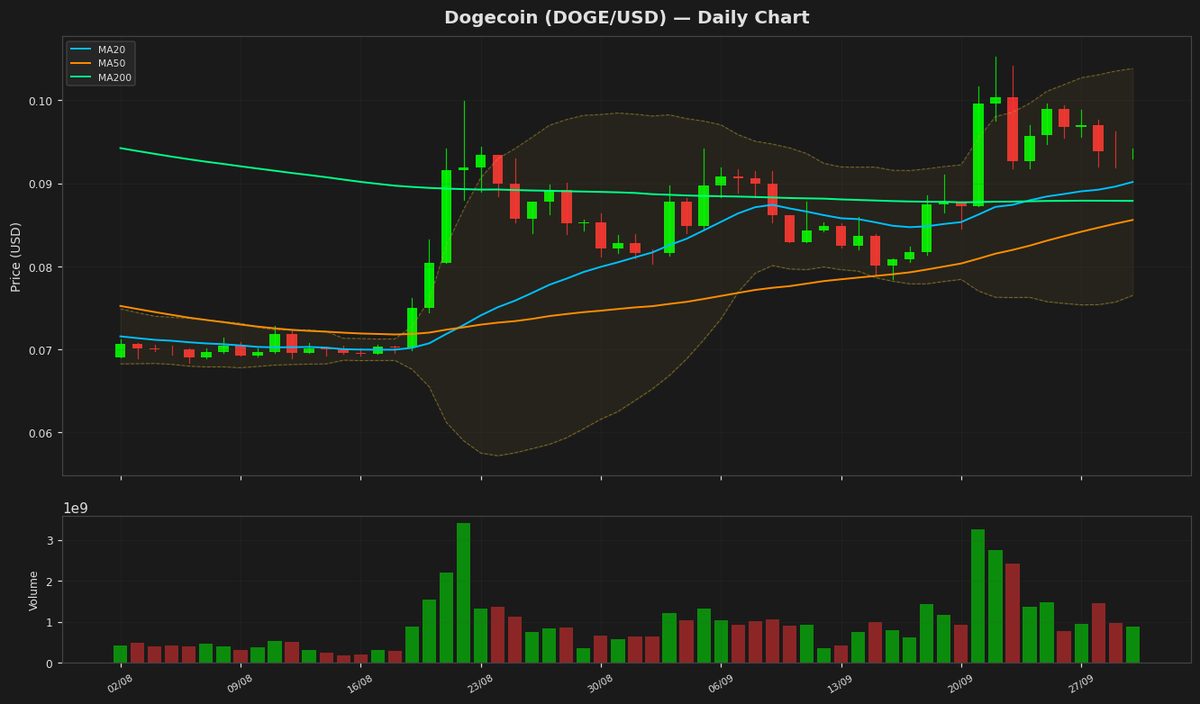
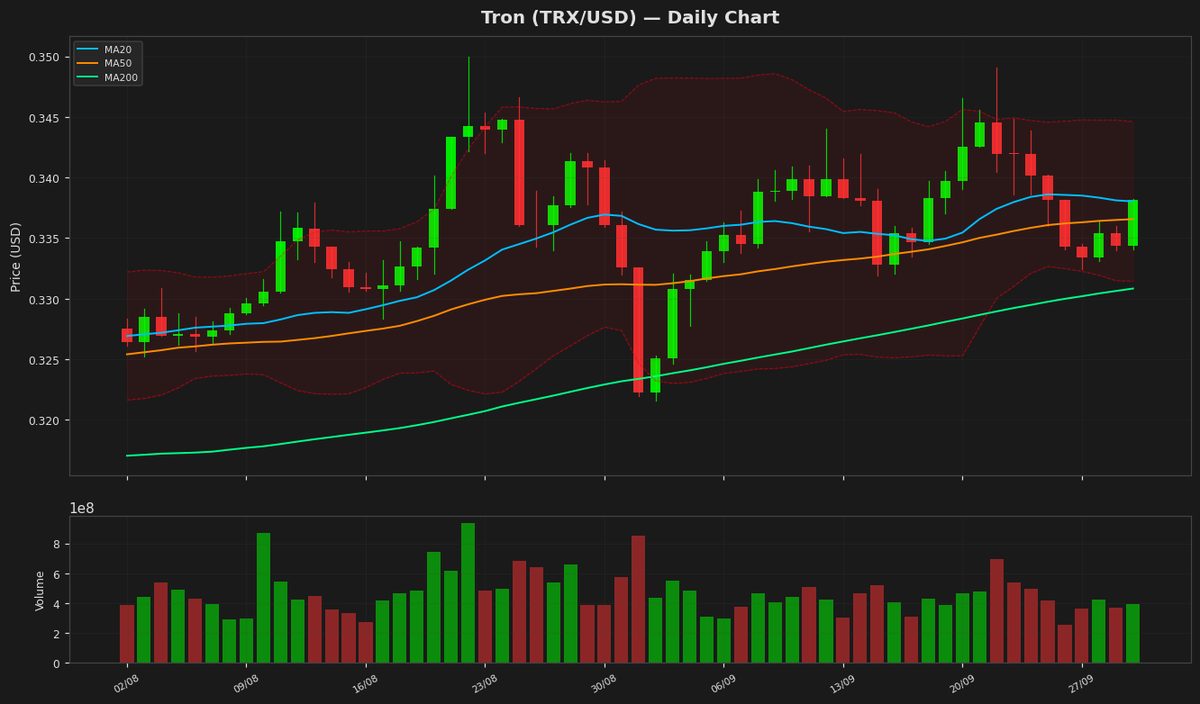
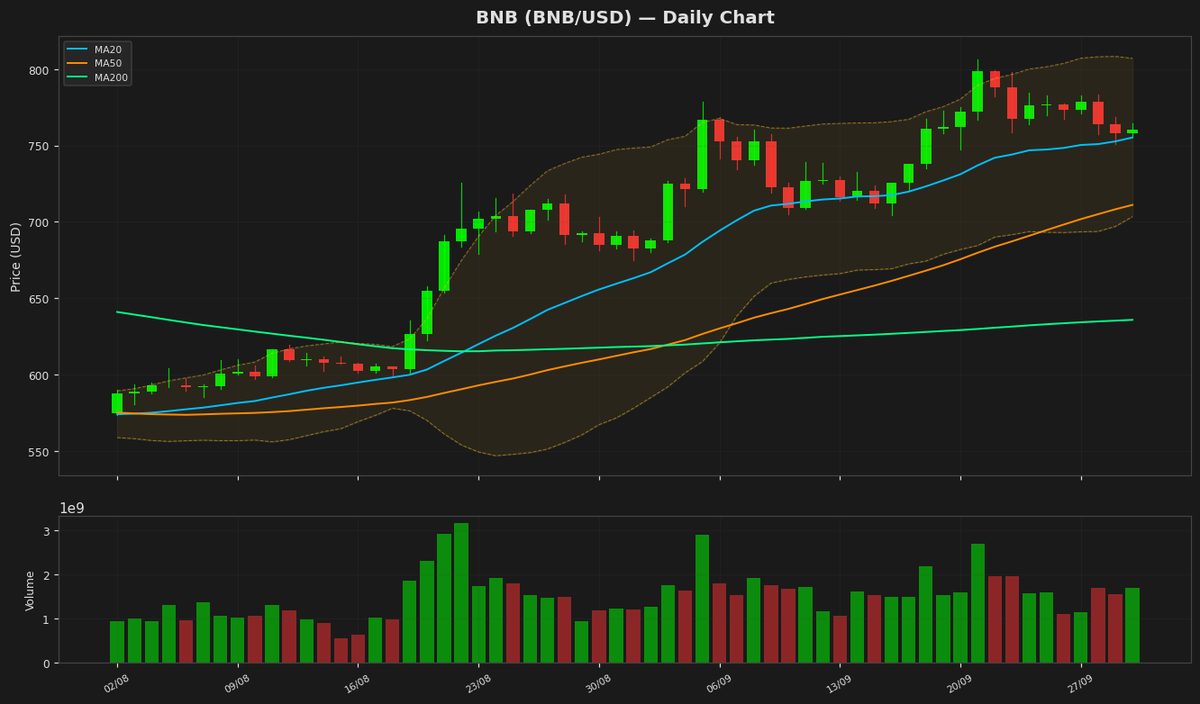
Among the other major cryptocurrencies, Ripple is up 0.32% to $1.4948, with an RSI of 69.4, while Solana is down 0.87% to $118.02, with an RSI of 74.4. BNB is trading at $758.87, up 0.10%, with a relatively lower RSI of 61.5. Tron and Dogecoin are trading at $0.3379 and $0.0935, respectively, with Tron seeing a 1.06% gain and Dogecoin a 0.36% loss.
The macro context is influenced by various developments, including the launch of new stablecoins and advancements in cryptocurrency adoption. For instance, AllUnity has launched a USD stablecoin, USDAU, and Binance Pay has expanded its services to allow spending crypto at PayPay merchants in Japan. Regulatory discussions are also ongoing, with Illinois drafting crypto tax rules that detail the treatment of DeFi and stablecoins.
From a technical standpoint, several major cryptocurrencies are showing signs of being overbought, as indicated by their RSI values. Bitcoin, Ethereum, and Solana all have RSI values above 70, suggesting a potential for consolidation or correction. However, their MACD indicators are still positive, indicating a prevailing bullish trend. Overall, the market is experiencing a period of consolidation, with investors closely watching key price levels and awaiting further developments in the regulatory and technological landscape.
Among the other major cryptocurrencies, Ripple is up 0.32% to $1.4948, with an RSI of 69.4, while Solana is down 0.87% to $118.02, with an RSI of 74.4. BNB is trading at $758.87, up 0.10%, with a relatively lower RSI of 61.5. Tron and Dogecoin are trading at $0.3379 and $0.0935, respectively, with Tron seeing a 1.06% gain and Dogecoin a 0.36% loss.
The macro context is influenced by various developments, including the launch of new stablecoins and advancements in cryptocurrency adoption. For instance, AllUnity has launched a USD stablecoin, USDAU, and Binance Pay has expanded its services to allow spending crypto at PayPay merchants in Japan. Regulatory discussions are also ongoing, with Illinois drafting crypto tax rules that detail the treatment of DeFi and stablecoins.
From a technical standpoint, several major cryptocurrencies are showing signs of being overbought, as indicated by their RSI values. Bitcoin, Ethereum, and Solana all have RSI values above 70, suggesting a potential for consolidation or correction. However, their MACD indicators are still positive, indicating a prevailing bullish trend. Overall, the market is experiencing a period of consolidation, with investors closely watching key price levels and awaiting further developments in the regulatory and technological landscape.
📰 Crypto News
- European stablecoin issuer AllUnity launches USD stablecoin USDAU
- Here’s what happened in crypto today
- Kalshi in advanced talks to raise new funding at $40B valuation: Reuters
- Illinois draft crypto tax rules detail DeFi, stablecoin treatment
- Crypto.com AI agent still in ‘stealth mode’ nearly 8 months after Super Bowl debut
- Binance Pay lets visitors spend crypto at PayPay merchants in Japan
- Trump accord calls for tech firms to ‘self police’ their own frontier AI
- Winklevoss-owned Gemini switches Zcash software ahead of faster 25-second blocks
- How European investors can now buy bitcoin without taking on U.S. dollar risk
- Bitcoin bulls have one price level to defend
- Robinhood unveils an AI that trades your money 24/7, and you carry all the risk
- XRP Ledger starts carrying fund records from Brazil operator overseeing $4 trillion
- Bitcoin rally shows signs of cooling even as a 'bull score' gauge nears its perfect score
- Robinhood adds AI agents, perps and weekend trading in push to win active traders
- Ethereum Gets Another Privacy Boost as Aztec Brings Back zk.money
🔍 Technical Analysis
Bitcoin (BTC) — -0.66%
$83,070.96 52W: $57,747.77 — $91,100.25
Bitcoin's price is currently at $83,070.96, showing a minor decline of 0.66% and is positioned near the upper end of the Bollinger Bands, with the RSI indicating overbought conditions at 72.69. The MACD is below its signal line, suggesting a potential bearish crossover. The ATR indicates high volatility, supporting the possibility of significant price movements.
Ethereum (ETH) — -0.39%
$2,666.21 52W: $1,506.51 — $3,040.72
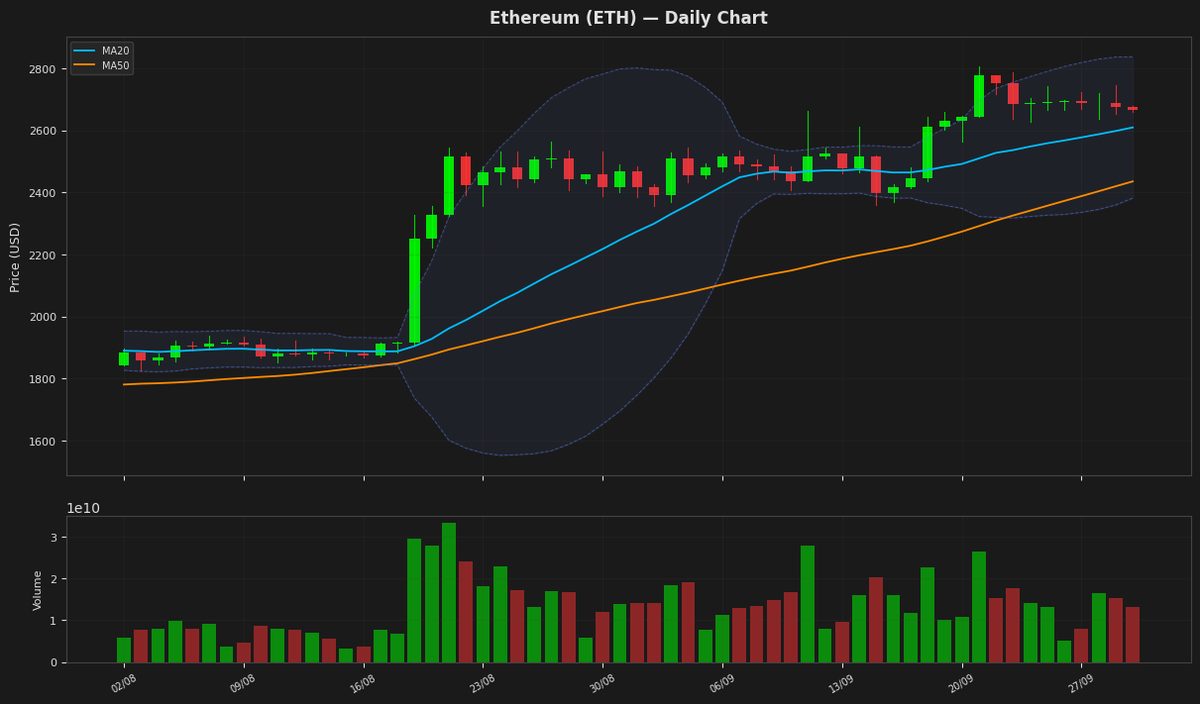
Ethereum is currently trading at $2,666.21, near its 20-day moving average of $2,609.30, and above its 50-day moving average of $2,435.38, indicating a short-term consolidation. The RSI at 75.25 suggests that Ethereum is in overbought territory, while the MACD below its signal line indicates a potential reversal. The price is also near the upper Bollinger Band at $2,836.97, further indicating a possible pullback.
Ripple (XRP) — +0.32%
$1.4948 52W: $0.988422 — $1.9641
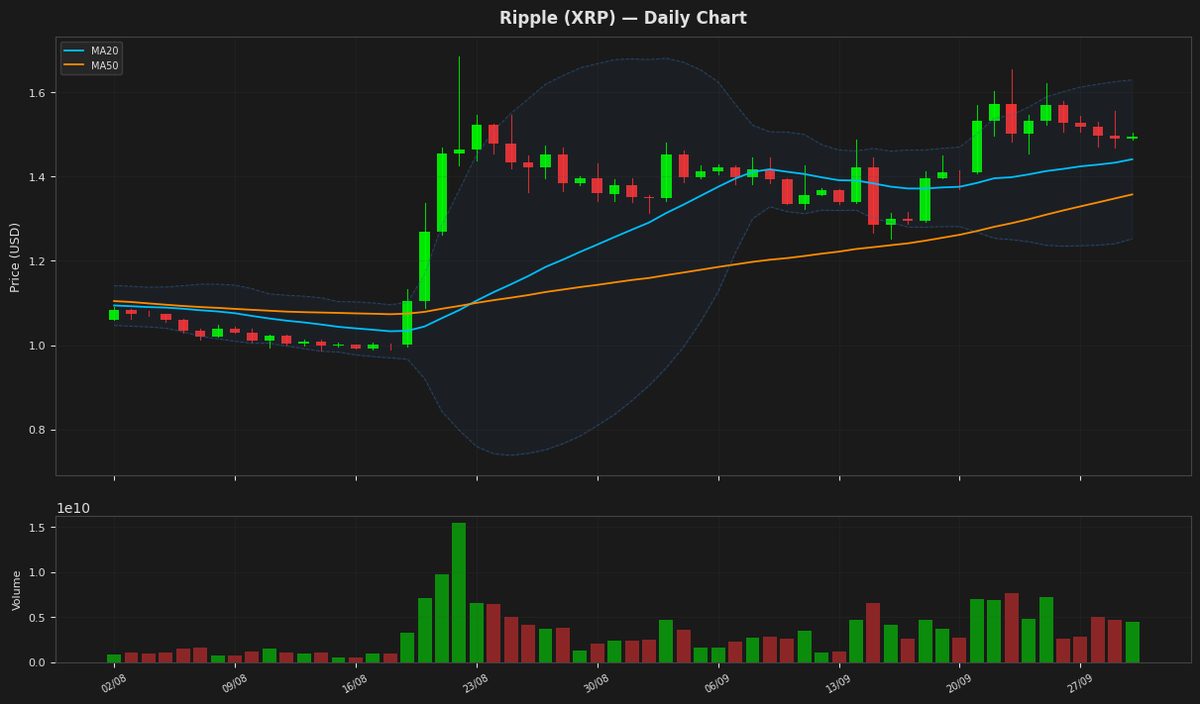
Ripple's price is currently trading above its 20-day and 50-day moving averages, indicating a bullish trend. The RSI is nearing overbought territory at 69.44, suggesting potential for a pullback. The Bollinger Bands indicate a relatively tight trading range, with the upper band at $1.629075 and lower band at $1.252442. The MACD is slightly below its signal line, indicating a potential loss of momentum.
Solana (SOL) — -0.87%
$118.0200 52W: $60.4147 — $130.4916
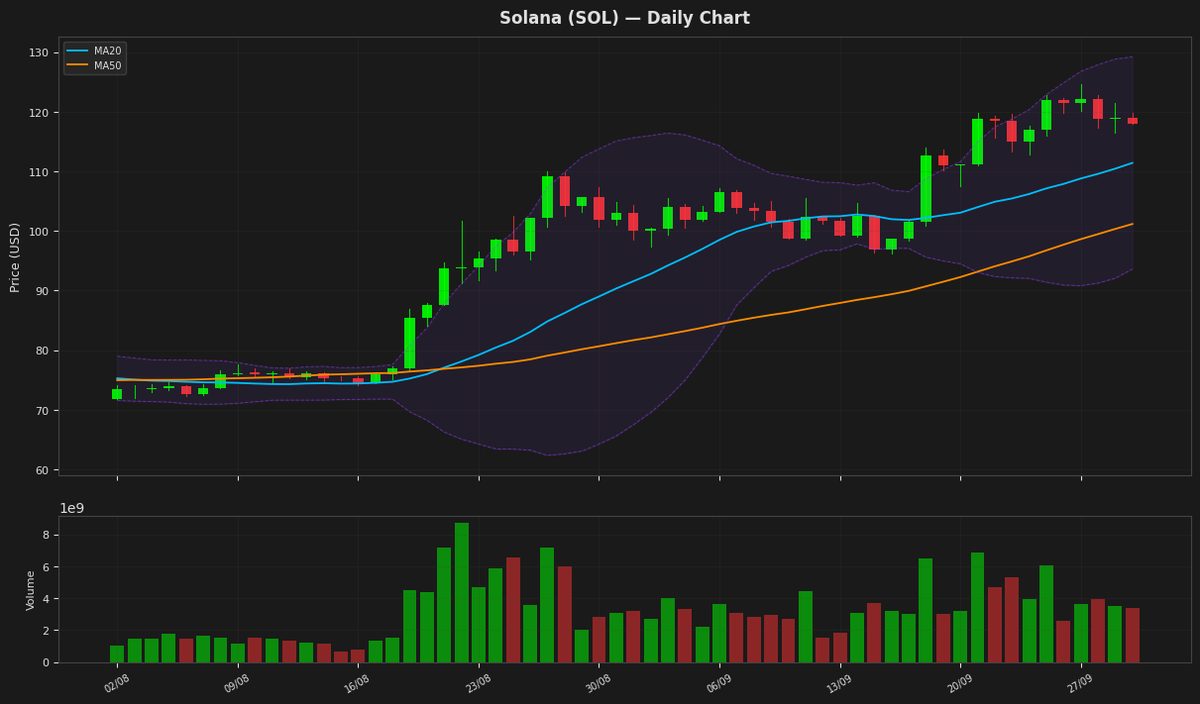
Solana's price is currently at $118, showing a slight decline of 0.87% and is positioned near the upper Bollinger Band at $129.22, indicating potential resistance. The RSI is at 74.36, suggesting the asset is nearing overbought territory. The MACD is above its signal line, indicating a bullish signal, while the Average True Range indicates moderate volatility.
BNB (BNB) — +0.10%
$758.8700 52W: $538.5992 — $907.3658
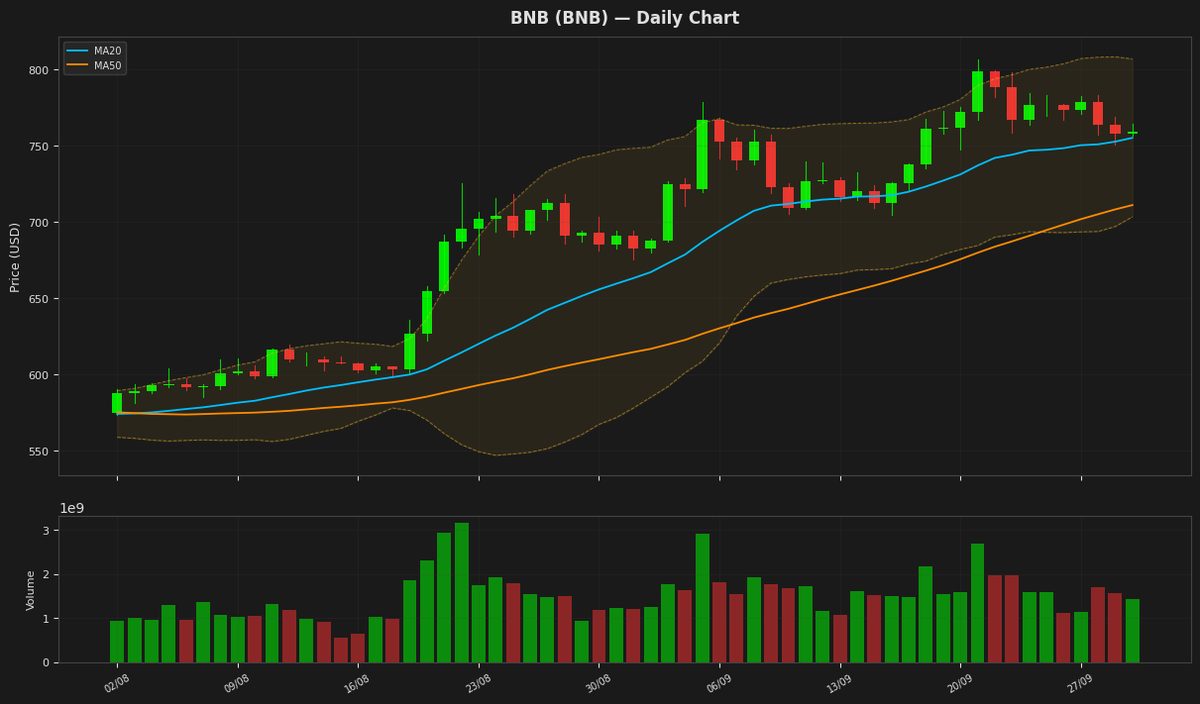
BNB is trading at $758.87, slightly above its 20-day moving average of $755.13, indicating a neutral to slightly bullish short-term trend. The Relative Strength Index (RSI) at 61.46 suggests the asset is not overbought, leaving room for further potential upside. The Moving Average Convergence Divergence (MACD) is below its signal line, indicating a potential bearish crossover.
Tron (TRX) — +1.06%
$0.337941 52W: $0.268138 — $0.376332
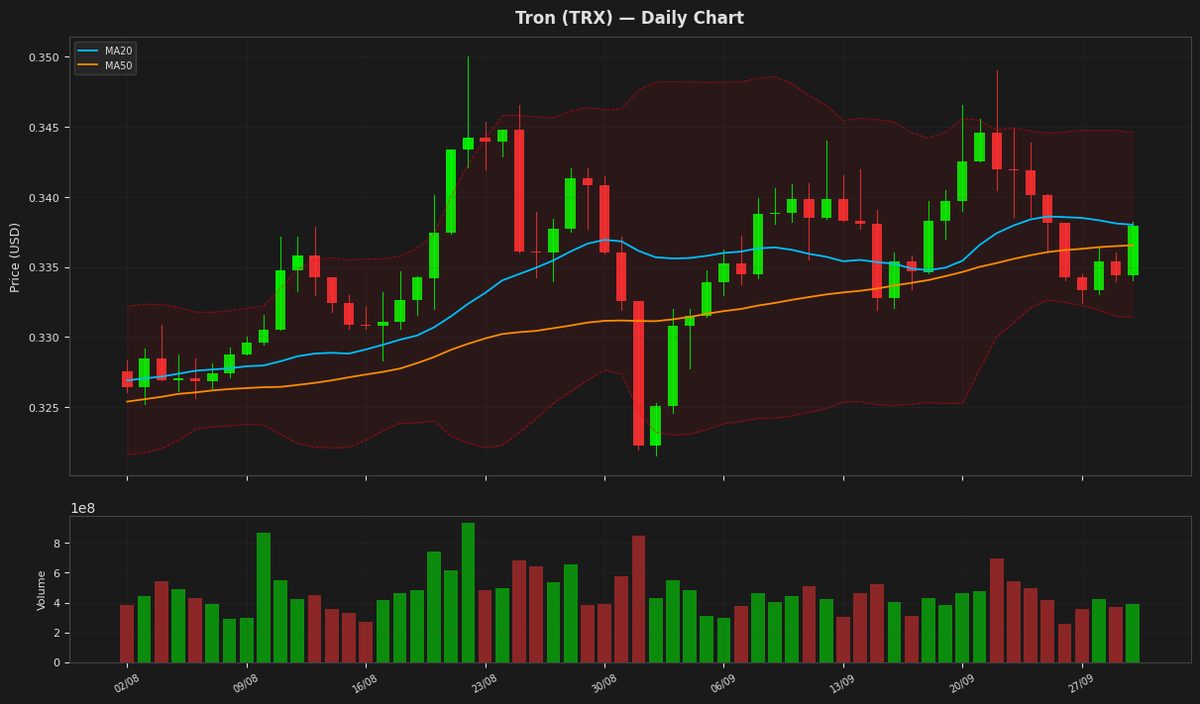
Tron's price is currently at $0.337941, showing a slight increase of 1.06% and is hovering around its MA20 at 0.338014, indicating a neutral trend. The RSI at 54.454178 suggests a balanced market with no extreme buying or selling pressure. The Bollinger Bands indicate that the price is near the upper band at 0.344597, suggesting potential resistance at this level. The MACD is below its signal line, indicating a potential sell signal.
Dogecoin (DOGE) — -0.36%
$0.093520 52W: $0.067973 — $0.127742
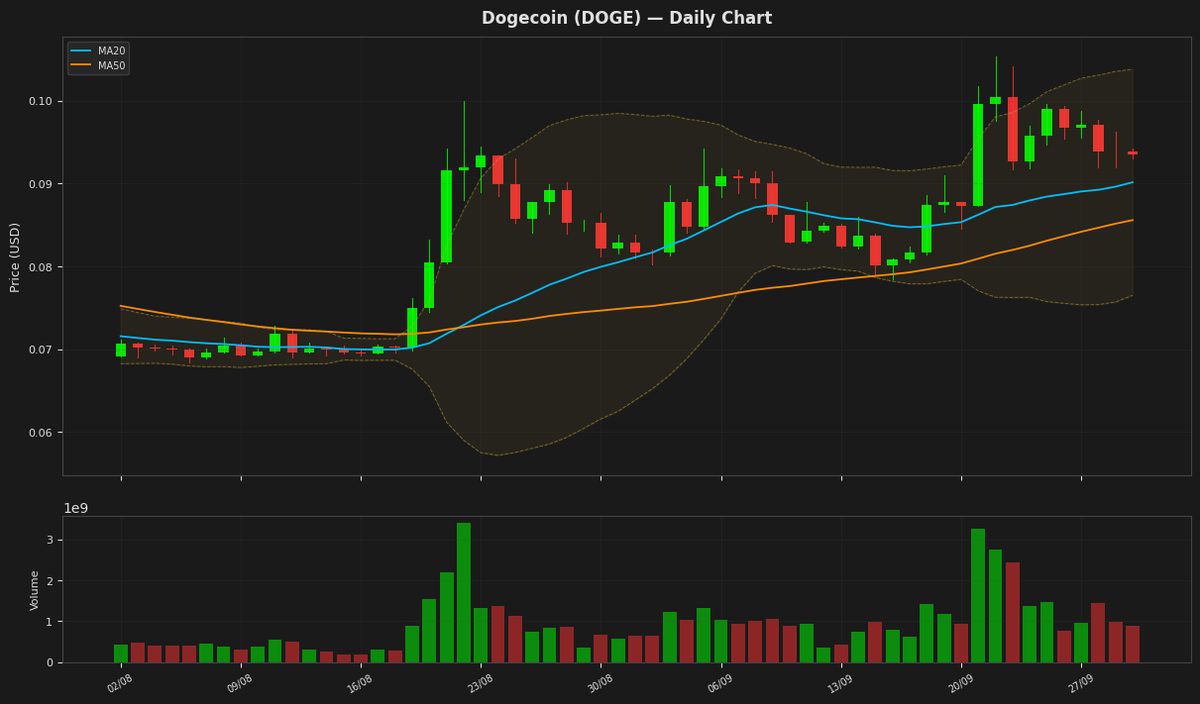
Dogecoin is currently trading at $0.093520, slightly above its 20-day moving average of 0.090135, indicating a short-term uptrend. The Relative Strength Index (RSI) at 65.708322 suggests the cryptocurrency is nearing overbought territory. The Moving Average Convergence Divergence (MACD) is below its signal line, indicating a potential sell signal. The price is also near the upper Bollinger Band at 0.103781, which could act as resistance.
Disclaimer
The content on MarketsFN.com is provided for educational and informational purposes only. It does not constitute financial advice or investment recommendations. All investments involve risk. Past performance does not guarantee future results.