Crypto Market Update: Tron Plummets, Ripple and Solana See Gains Today
QuoteReporter
•5 min read
Crypto Market Report | October 30, 2026
📊 Crypto Market Overview
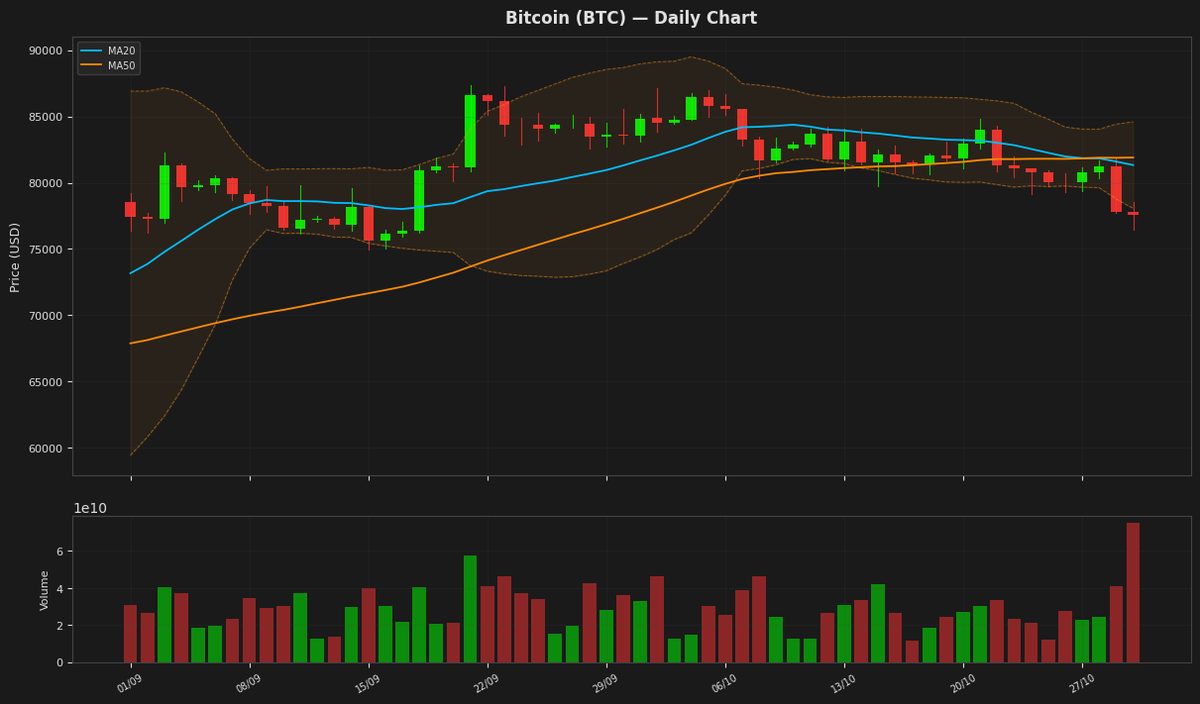
The cryptocurrency market is currently exhibiting a mixed sentiment, with some assets experiencing gains while others decline. Bitcoin is trading at $77,605.78, down 0.22% on the day, as its Relative Strength Index (RSI) stands at 33.8, indicating a neutral territory, and its Moving Average Convergence Divergence (MACD) is negative at -886.0034. Ethereum is also in the red, down 1.19% to $2,222.62, with an RSI of 26.6, suggesting it is oversold, and a negative MACD of -70.0383.
Among the key movers, Ripple and Solana are in the green, with gains of 1.71% and 1.29%, respectively. Ripple's RSI is at 41.6, while its MACD is slightly negative. Solana's RSI is 31.2, and its MACD is also negative. BNB is up 0.72%, with an RSI of 43.7 and a negative MACD. In contrast, Tron is down 5.78%, despite its RSI being near neutral at 45.8, and its MACD being slightly positive.
The recent news surrounding the $6.3 billion Binance hack continues to unfold, with Binance pointing to a hacked laptop of an engineer as a potential breach point. The incident has rattled markets, with some speculating it could accelerate a shift towards decentralized exchanges (DEXs). The broader market context remains influenced by such significant events, alongside concerns over AI spending.
From a technical standpoint, several major cryptocurrencies are displaying negative MACD values, indicating a bearish trend. Bitcoin and Ethereum, in particular, are showing negative MACD values, while their RSI values suggest they are not yet oversold. The mixed performance across different assets reflects the complex and dynamic nature of the cryptocurrency market, with various factors influencing price movements. Overall, the market is navigating through a challenging period, with the impact of significant events like the Binance hack being closely monitored by investors.
📰 Crypto News
- Live updates: Binance uncovers more breach points in $6.3B hack
- Here’s what happened in crypto today
- Strategy eyes more Bitcoin buys as Saylor touts $30B credit capacity
- North Korea’s TraderTraitor linked to $6.3B Binance hack
- Binance hack could accelerate shift to DEXs: Standard Chartered
- Binance points to engineer’s hacked laptop in $6.3B breach
- Binance hack rattles markets as BNB falls 8%, Bitcoin nears $77K
- Tampered Ledger reported in Singapore a month before news broke: Asia Express
- Live updates: Binance finds more breaches in $6.3 billion hack; AI spending fears hit tech
- Binance hacker dumps a little-known 2017 token and it crashes 90%
- Bitcoin, ether and XRP selloff wipes out $1.5 billion in leveraged crypto bets
- XRP Ledger developers tighten the rules for who can hold 'restricted' tokens
- Binance hack bites India's largest crypto exchange as it curbs futures trading
- Binance hacker splits $1.4 billion of bitcoin into 19 wallets that no one can freeze
- $6 billion Binance hack sends bitcoin, ether tumbling; Standard Chartered expects more pain
🔍 Technical Analysis
Bitcoin (BTC) — -0.22%
$77,605.78 52W: $57,747.77 — $87,363.76
Bitcoin's price is currently at $77,605.78, showing a minor decline, and is positioned near the lower band of the Bollinger Bands at $78,063.33, indicating potential support. The RSI is at 33.78, suggesting oversold conditions, while the MACD is below its signal line, indicating a bearish signal. The ATR remains high at $1,958.03, indicating significant price volatility.
Ethereum (ETH) — -1.19%
$2,222.62 52W: $1,506.51 — $2,805.50
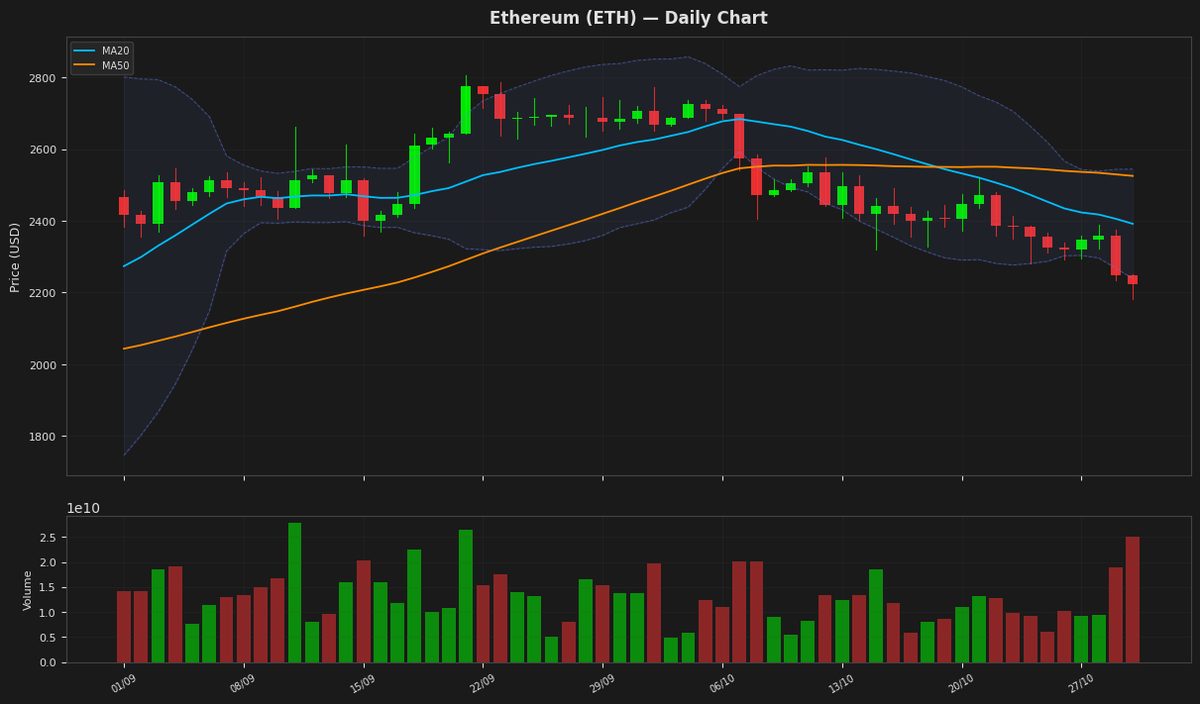
Ethereum's price is currently at $2,222.62, showing a slight decline, and is nearing the lower Bollinger Band at $2,239.29, indicating potential support. The RSI is at 26.62, suggesting oversold conditions, which could lead to a bounce. The MACD is below the signal line, indicating a bearish trend, but the histogram is not extreme, suggesting a possible stabilization. The price is also near the lower end of its recent trading range.
Ripple (XRP) — +1.71%
$1.2560 52W: $0.988422 — $1.6838
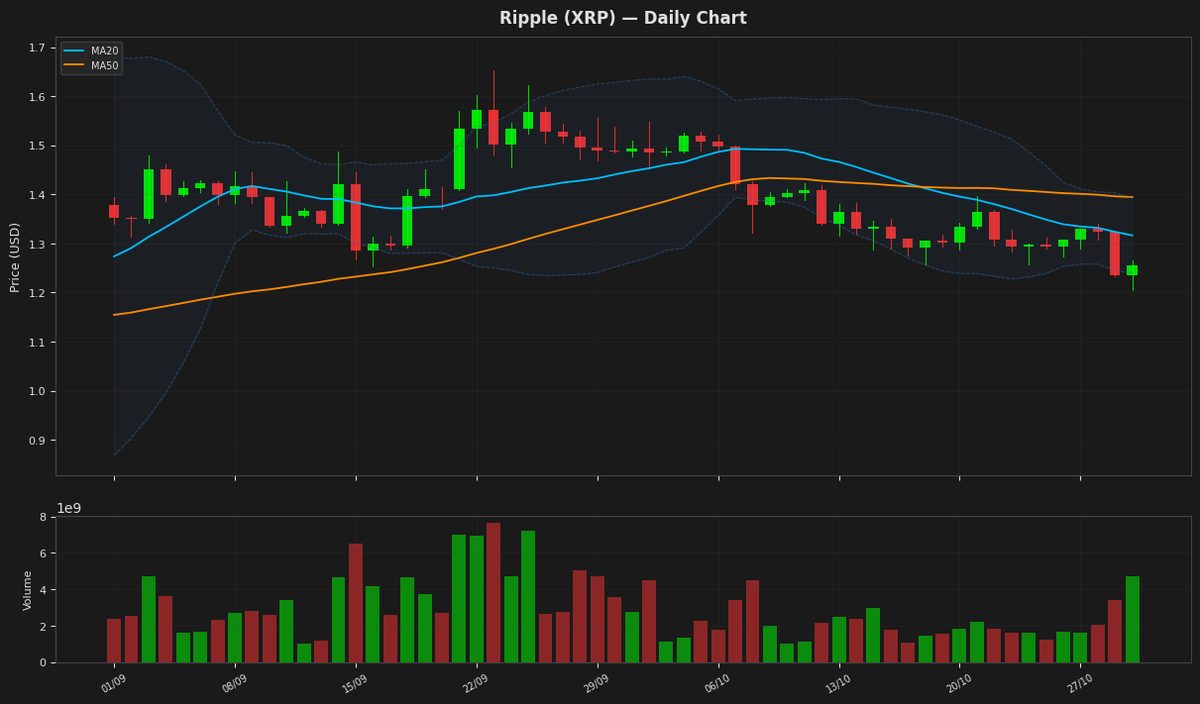
Ripple's price is currently at $1.256, showing a slight increase, and is positioned near the lower Bollinger Band at $1.240555, indicating potential support. The RSI is at 41.618237, suggesting the asset is not deeply oversold. The MACD is below the signal line, indicating a bearish signal, and the price is below both the MA20 and MA50, further reinforcing the bearish trend. The ATR indicates moderate volatility.
Solana (SOL) — +1.29%
$96.7300 52W: $60.4147 — $124.6174
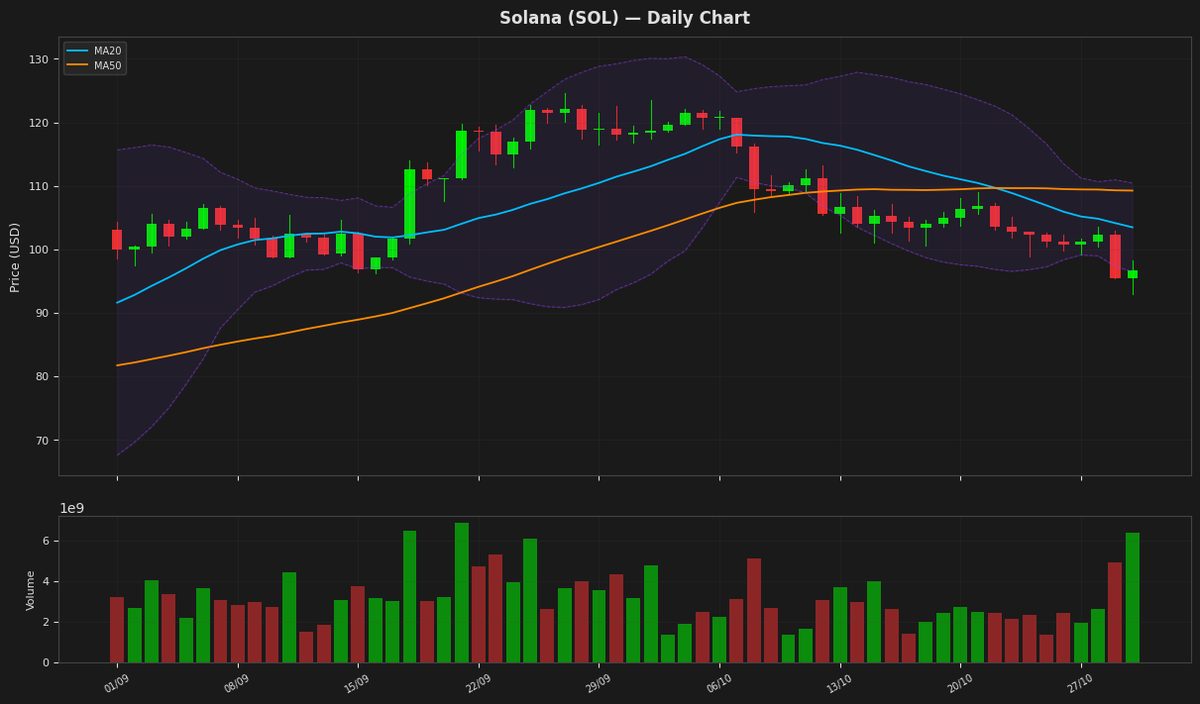
Solana's price is currently at $96.73, near the lower Bollinger Band at $96.47, indicating a potential support level. The RSI is at 31.18, suggesting oversold conditions, while the MACD is below its signal line, indicating a bearish trend. The price is below both MA20 and MA50, further reinforcing the bearish sentiment. The ATR indicates moderate volatility.
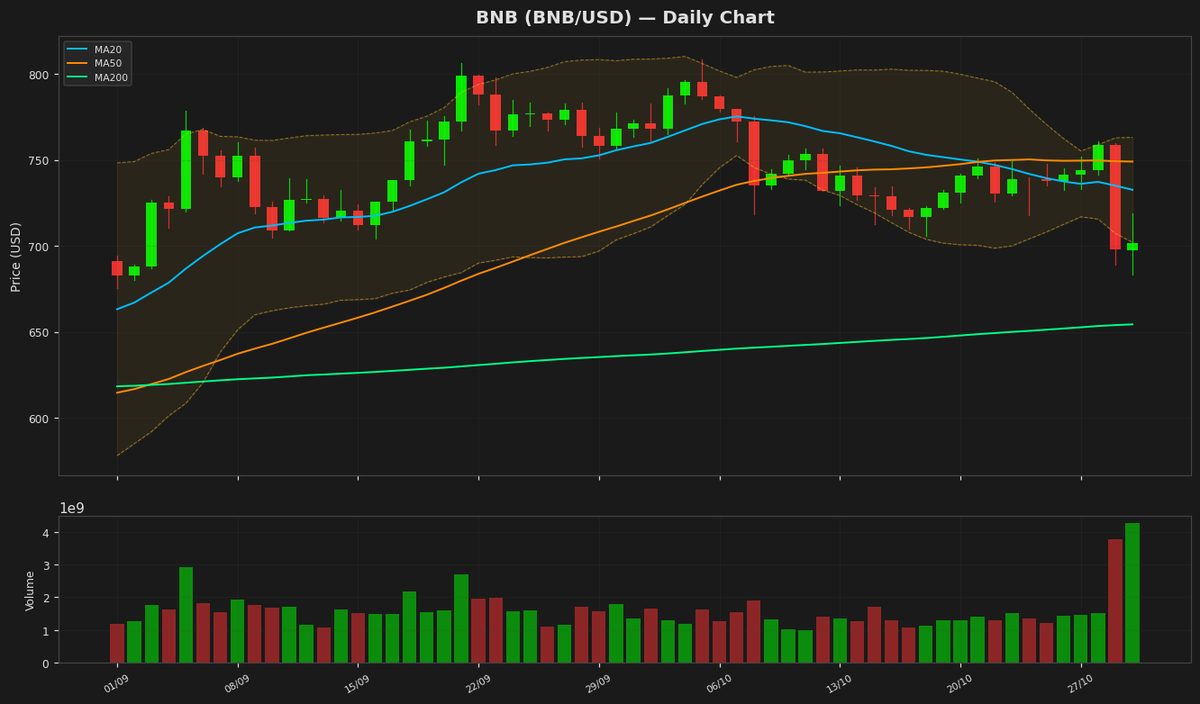
BNB (BNB) — +0.72%
$702.7400 52W: $538.5992 — $808.4329
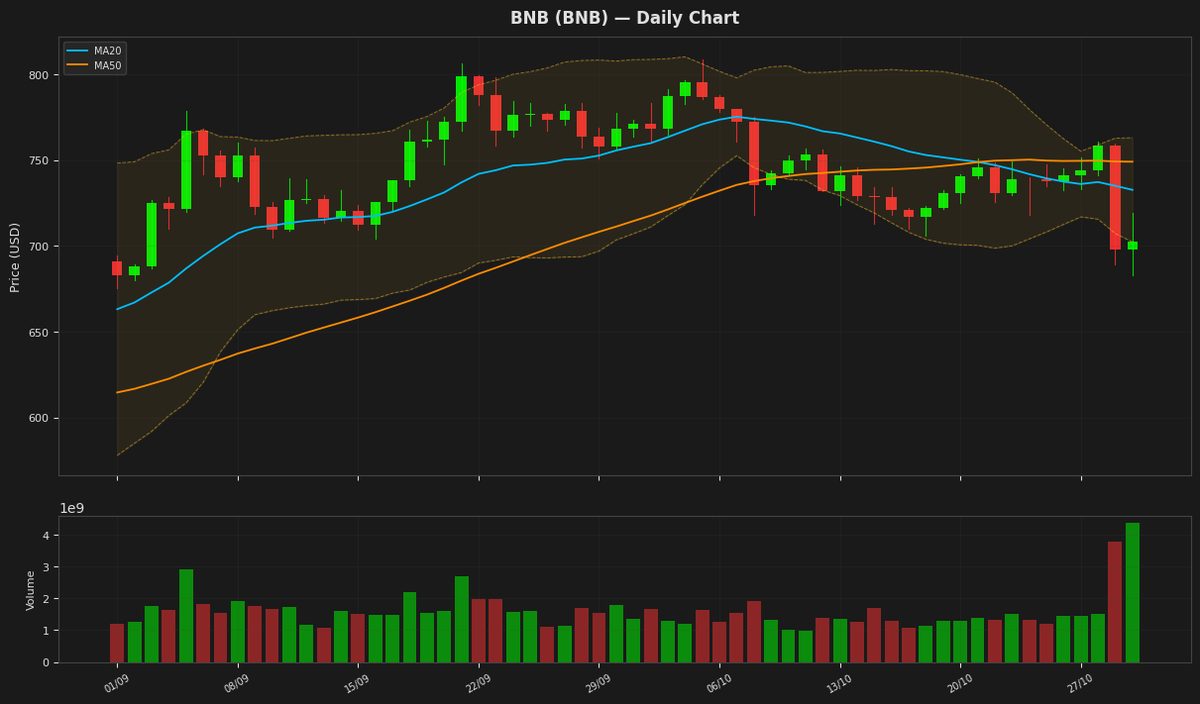
BNB is currently trading at $702.74, near the lower band of the Bollinger Bands at $702.29, indicating potential support. The RSI is at 43.72, suggesting the asset is not oversold but has room to decline further. The MACD is below the signal line, indicating a bearish signal, and the price is below both the MA20 and MA50, reinforcing the bearish trend. The ATR indicates moderate volatility.
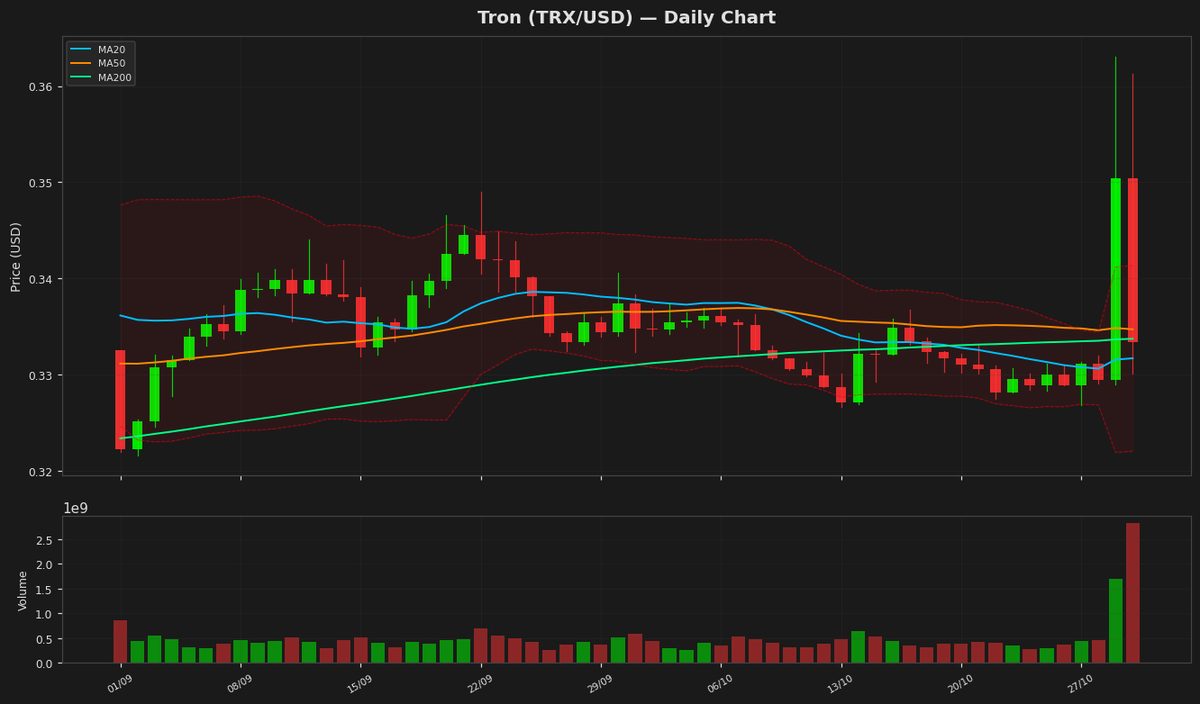
Tron (TRX) — -5.78%
$0.330175 52W: $0.278604 — $0.376332
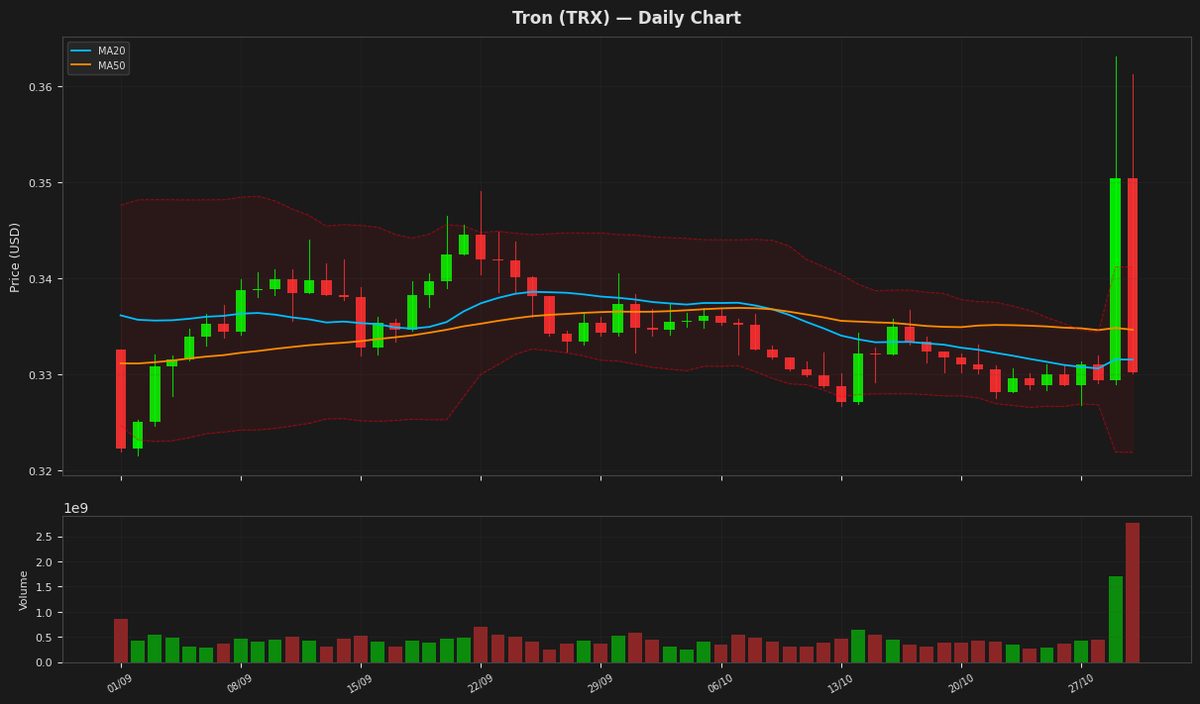
Tron's price is currently at $0.330175, showing a decline of 5.78% for the day, and is positioned near the middle of its Bollinger Bands, with the upper and lower bands at $0.341198 and $0.321885 respectively. The RSI is at 45.770554, indicating a neutral territory, while the MACD is below its signal line, suggesting a potential bearish trend. The ATR is at 0.007049, indicating relatively low volatility.
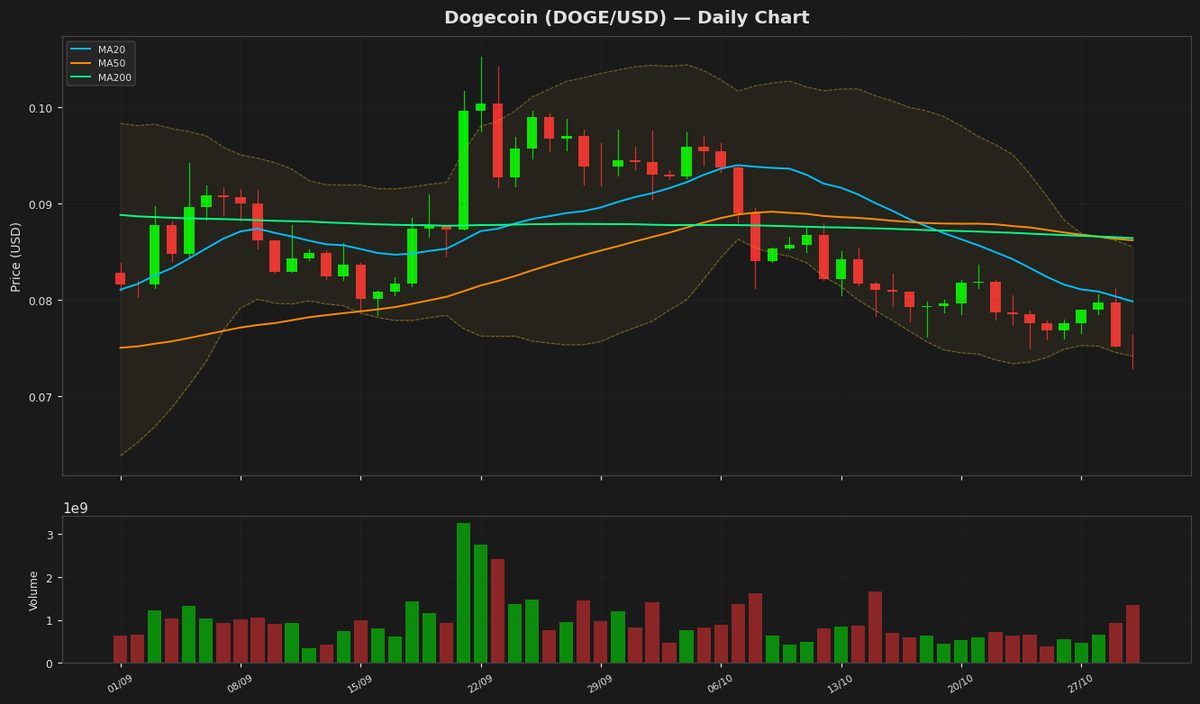
Dogecoin (DOGE) — +0.20%
$0.075350 52W: $0.067973 — $0.118255
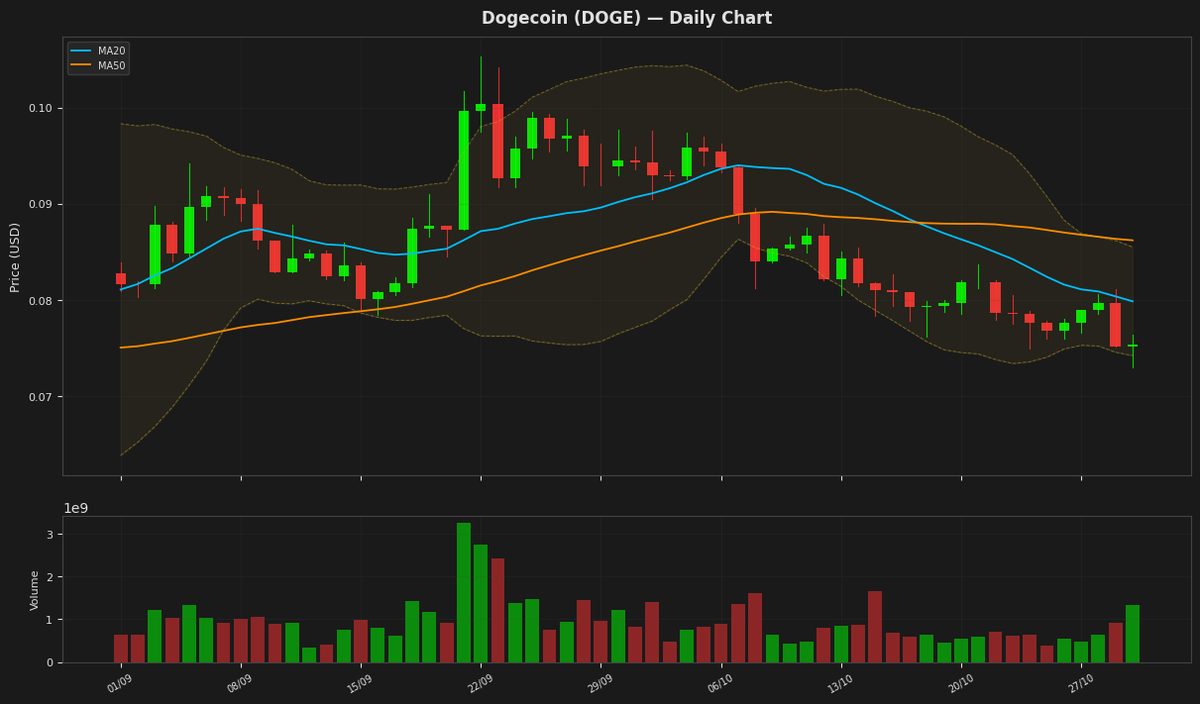
Dogecoin's price is currently at $0.075350, near the lower Bollinger Band at $0.074209, indicating a potential oversold condition supported by the RSI(14) value of 33.641339. The MACD is below the signal line, suggesting a bearish trend. The price is also below both MA20 and MA50, further indicating a downtrend. The ATR(14) suggests moderate volatility.
Disclaimer
The content on MarketsFN.com is provided for educational and informational purposes only. It does not constitute financial advice or investment recommendations. All investments involve risk. Past performance does not guarantee future results.