Crypto Market Update: Ripple and Solana Lead Today's Losses Briefly
QuoteReporter
•5 min read
Crypto Market Update: Ripple and Solana Lead Today's Losses Briefly
Crypto Market Report | September 02, 2026
📊 Crypto Market Overview
The cryptocurrency market is currently characterized by a mixed sentiment, with some assets experiencing minor losses while others show slight gains. Bitcoin, the largest cryptocurrency by market capitalization, is trading at $77,214.4766, down 0.24% on the day, with its Relative Strength Index (RSI) standing at 69.9, indicating a near-overbought condition. The MACD indicator is at 3371.8581, suggesting a continued bullish trend.
Other major cryptocurrencies, such as Ethereum, Ripple, and Solana, are also experiencing minor declines, with losses ranging from 0.21% to 0.83%. Ethereum's RSI is at 60.8, while Solana's is at 66.8, indicating a relatively stable condition for both assets. In contrast, BNB is bucking the trend, rising 0.48% on the day, with its RSI at 69.5, similar to Bitcoin's.
The macro context is influencing the market, with a recent risk selloff triggered by Iran strikes contributing to the minor declines in major cryptocurrencies. Despite this, some positive news has emerged, such as the strong performance of Bitcoin ETFs in August, which notched their best month of 2026, and the expansion of Binance's TradFi push with options on 1,000 US stocks and ETFs. Additionally, XRP ETFs have attracted $170 million in investments over eleven days, with Goldman topping institutional holders. Technical signals are mixed, with some assets displaying bullish MACD indicators, while others, such as Tron, are showing negative MACD values. Overall, the market is experiencing a period of consolidation, with investors reacting to a combination of macroeconomic factors and asset-specific news.
Other major cryptocurrencies, such as Ethereum, Ripple, and Solana, are also experiencing minor declines, with losses ranging from 0.21% to 0.83%. Ethereum's RSI is at 60.8, while Solana's is at 66.8, indicating a relatively stable condition for both assets. In contrast, BNB is bucking the trend, rising 0.48% on the day, with its RSI at 69.5, similar to Bitcoin's.
The macro context is influencing the market, with a recent risk selloff triggered by Iran strikes contributing to the minor declines in major cryptocurrencies. Despite this, some positive news has emerged, such as the strong performance of Bitcoin ETFs in August, which notched their best month of 2026, and the expansion of Binance's TradFi push with options on 1,000 US stocks and ETFs. Additionally, XRP ETFs have attracted $170 million in investments over eleven days, with Goldman topping institutional holders. Technical signals are mixed, with some assets displaying bullish MACD indicators, while others, such as Tron, are showing negative MACD values. Overall, the market is experiencing a period of consolidation, with investors reacting to a combination of macroeconomic factors and asset-specific news.
📰 Crypto News
- Bitcoin ETFs notch best month of 2026 as BTC gains 25% in August
- Here’s what happened in crypto today
- HYPE treasury firm Hyperliquid Strategies boosts equity facility to $2.5B
- Core DAO plans emergency hard fork after validators drew excess rewards
- Crypto-backed PAC scales back ad spending in Massachusetts primary
- Binance expands TradFi push with options on 1,000 US stocks, ETFs
- XRP ETFs pull in $170 million over eleven days. Goldman tops institutional holders
- A China indicator that supports risk-taking in stocks and bitcoin is flashing red
- OpenAI says its new 'Astra' AI can build attacks without human help
- Solana, ether, xrp lead majors slide as Iran strikes drive a broad risk selloff
- Bitcoin withstands $90 oil and rising yields while gold slides. A firm dollar is the catch
- SEC proposes transfer agent rule, sets event to figure out round-the-clock U.S. trading
- OpenClaw 2.0 Is Here: What Changed, Why It Took Two Months, and How It Stacks Up Against Hermes
- Nvidia Invests $3.5 Billion in MediaTek to Expand Beyond GPUs
- Robinhood Chain DEX Volume Jumps to $1.6 billion
🔍 Technical Analysis
Bitcoin (BTC) — -0.24%
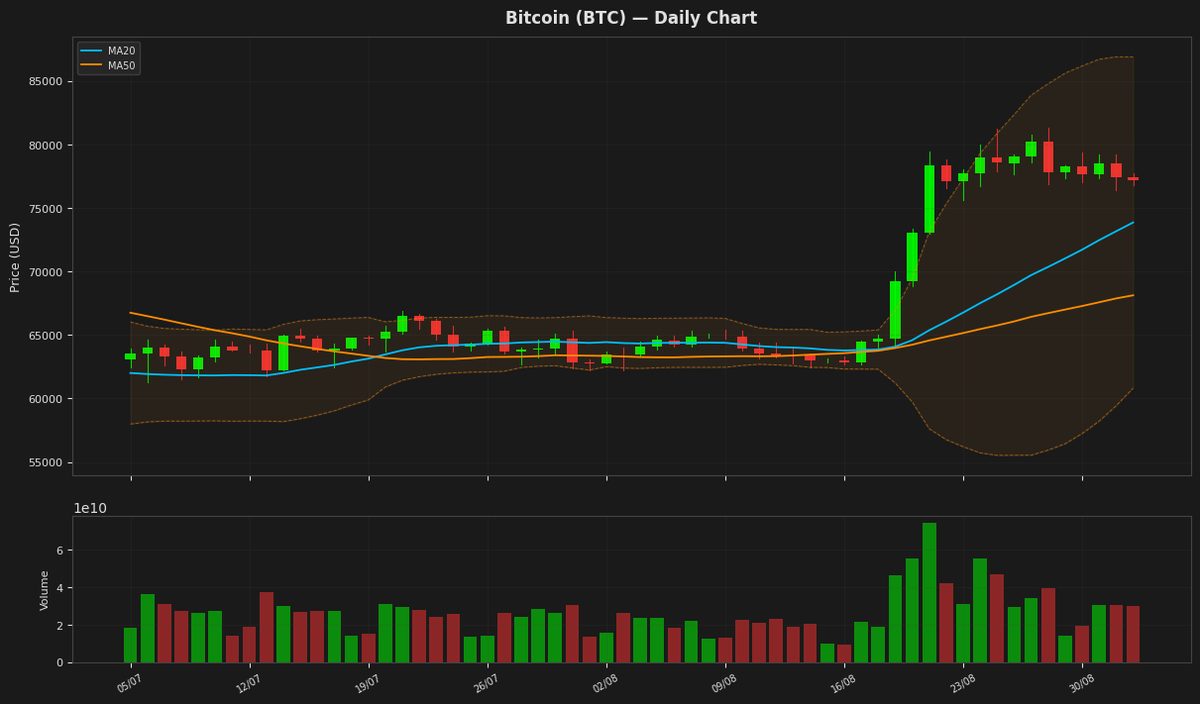
$77,214.48 52W: $57,747.77 — $97,860.60
Bitcoin's price is currently at $77,214, showing a minor decline of 0.24% and is positioned above both its 20-day and 50-day moving averages, indicating an overall uptrend. The Relative Strength Index is at 69.94, nearing overbought territory, while the MACD is below its signal line, suggesting a potential short-term pullback. The price is also within the upper half of the Bollinger Bands, with the upper band at $86,902 and the lower band at $60,817.
Ethereum (ETH) — -0.21%
$2,412.72 52W: $1,506.51 — $3,397.90
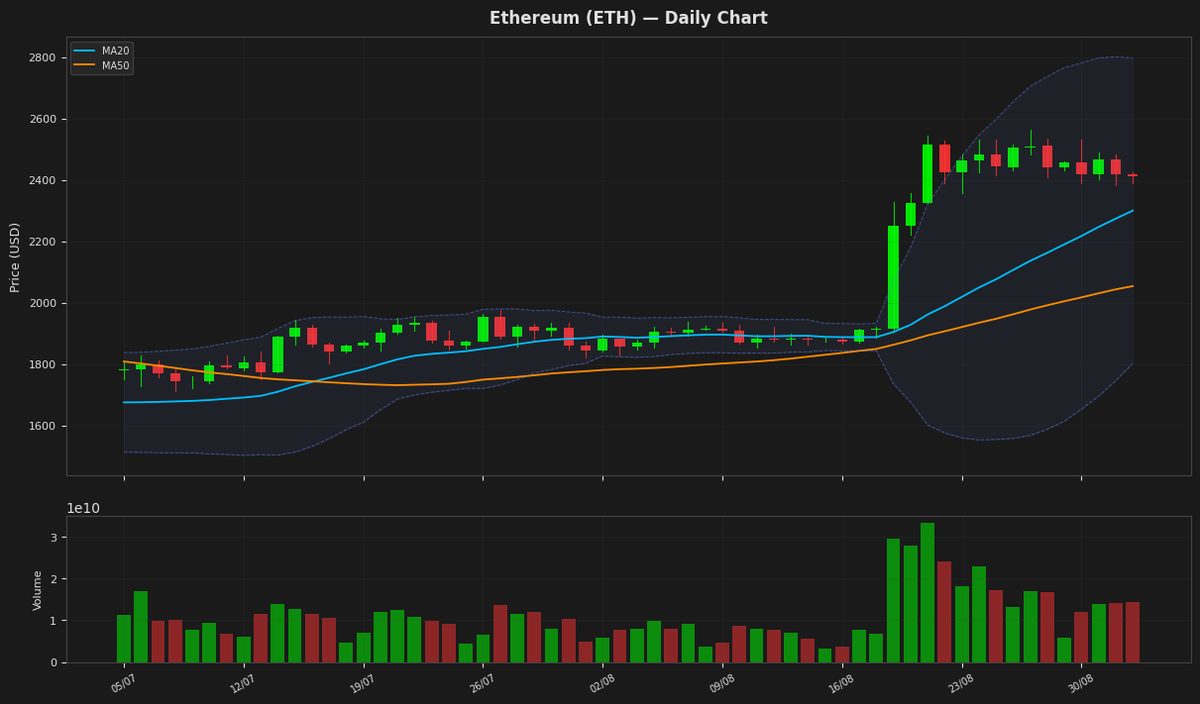
Ethereum is currently trading at $2,412.72, slightly below its 20-day moving average of $2,300.13, indicating a potential resistance at this level. The Relative Strength Index (RSI) at 60.83588 suggests that Ethereum is nearing overbought territory, while the MACD line being below the signal line may indicate a potential reversal. The price is also within the upper half of the Bollinger Bands, indicating relatively high volatility.
Ripple (XRP) — -0.83%
$1.3404 52W: $0.988422 — $2.4103
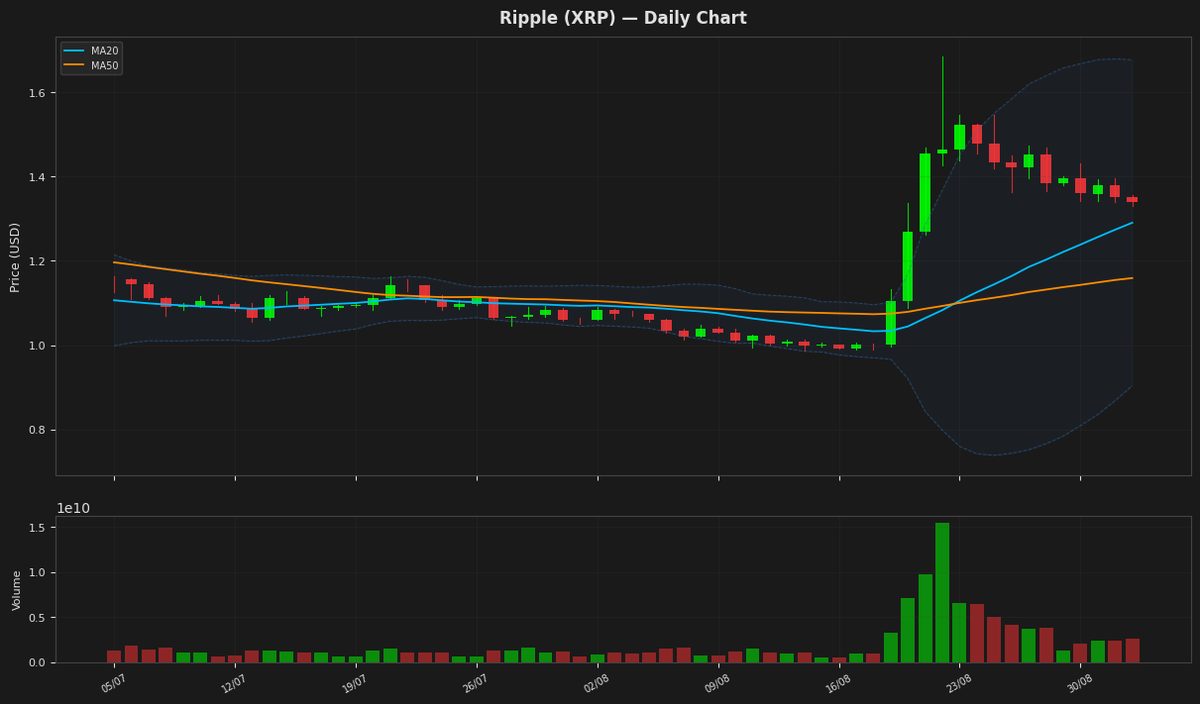
Ripple's price is currently at $1.340400, above both its MA20 and MA50, indicating a bullish trend. The RSI is at 66.23, nearing overbought territory, while the MACD is below its signal line, suggesting a potential reversal. The price is still below the upper Bollinger Band at $1.676557, indicating some room for upward movement. The ATR indicates moderate volatility.
Solana (SOL) — -0.31%
$99.6800 52W: $60.4147 — $148.2160
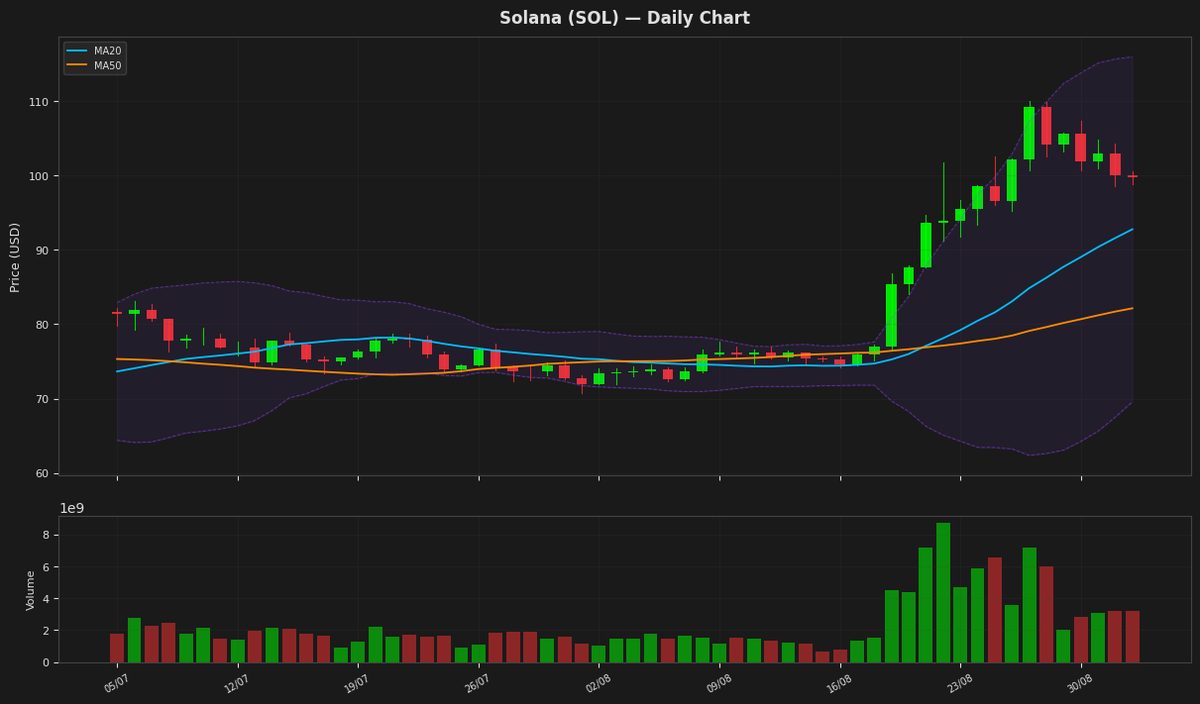
Solana's price is currently at $99.68, showing a minor decline of 0.31% and trading above both its MA20 at $92.75 and MA50 at $82.13, indicating an overall uptrend. The RSI at 66.80 suggests the asset is nearing overbought territory but hasn't reached it yet. The MACD is above its signal line, reinforcing the positive momentum.
BNB (BNB) — +0.48%
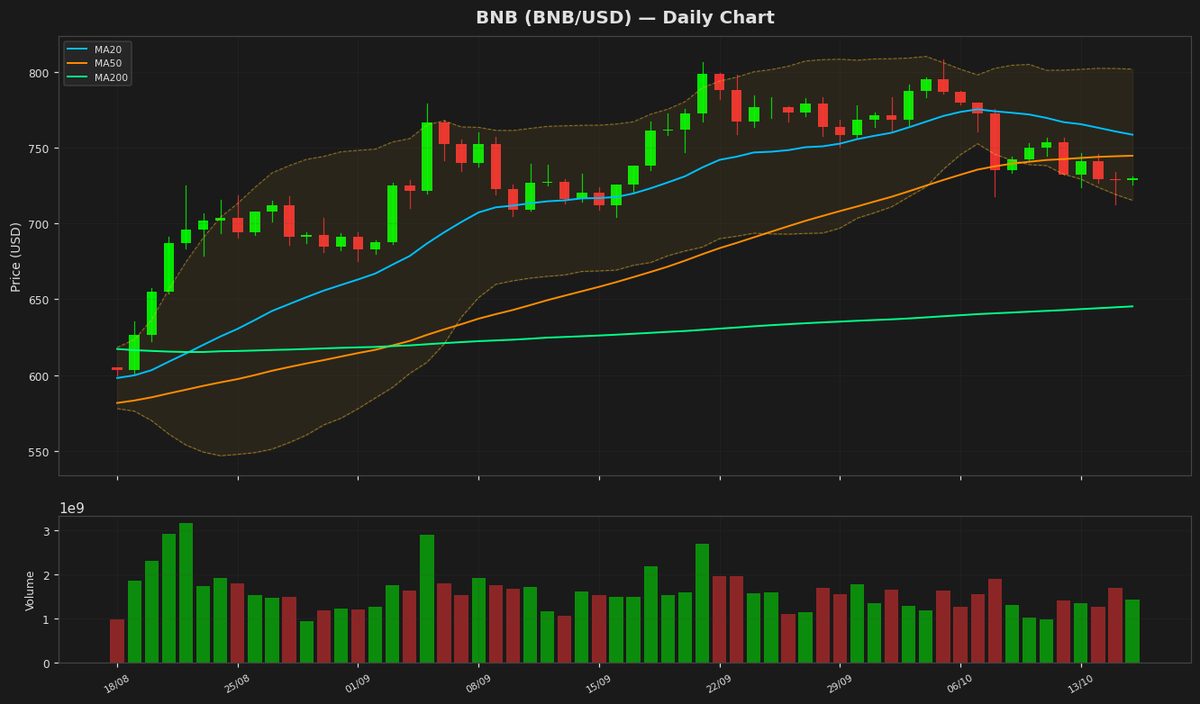
$686.0100 52W: $538.5992 — $954.8583
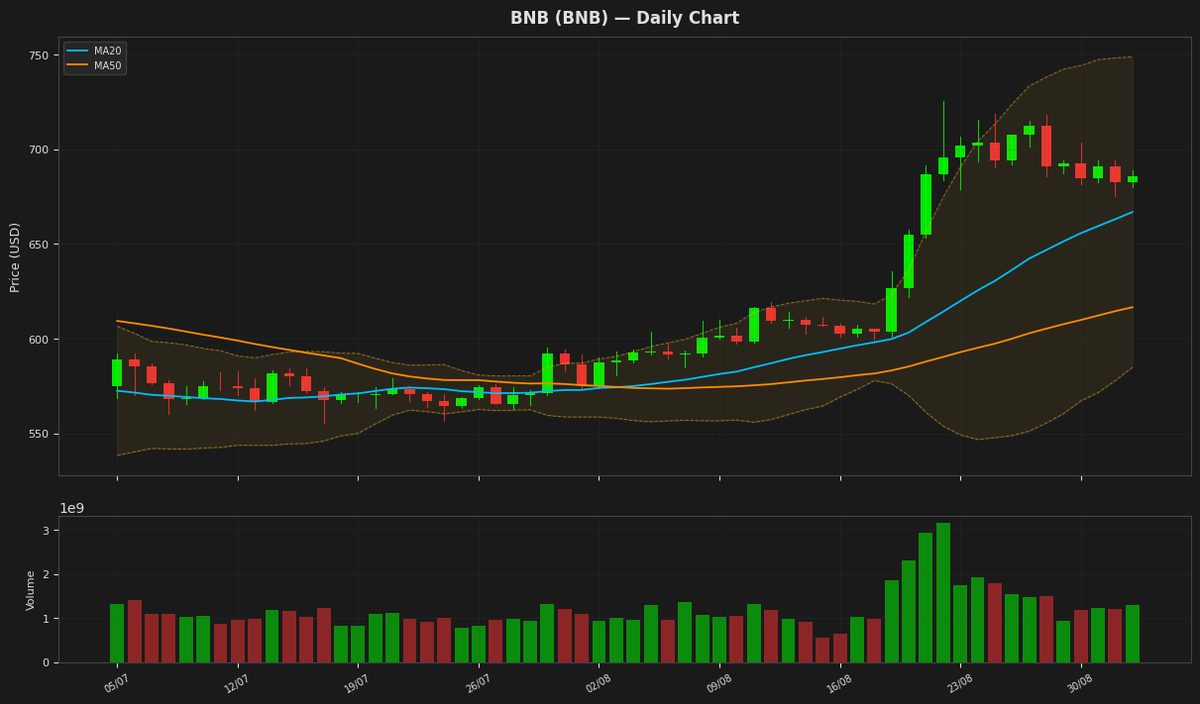
BNB is trading at $686.01, showing a slight increase of 0.48% in its daily price, and is positioned above both its MA20 at $666.89 and MA50 at $616.64, indicating an overall uptrend. The RSI at 69.46 is nearing overbought territory, while the MACD is below its signal line, suggesting a potential slowdown in the upward momentum. The price is also within the Bollinger Bands, with the upper band at $748.82 and lower band at $584.96.
Tron (TRX) — +0.22%
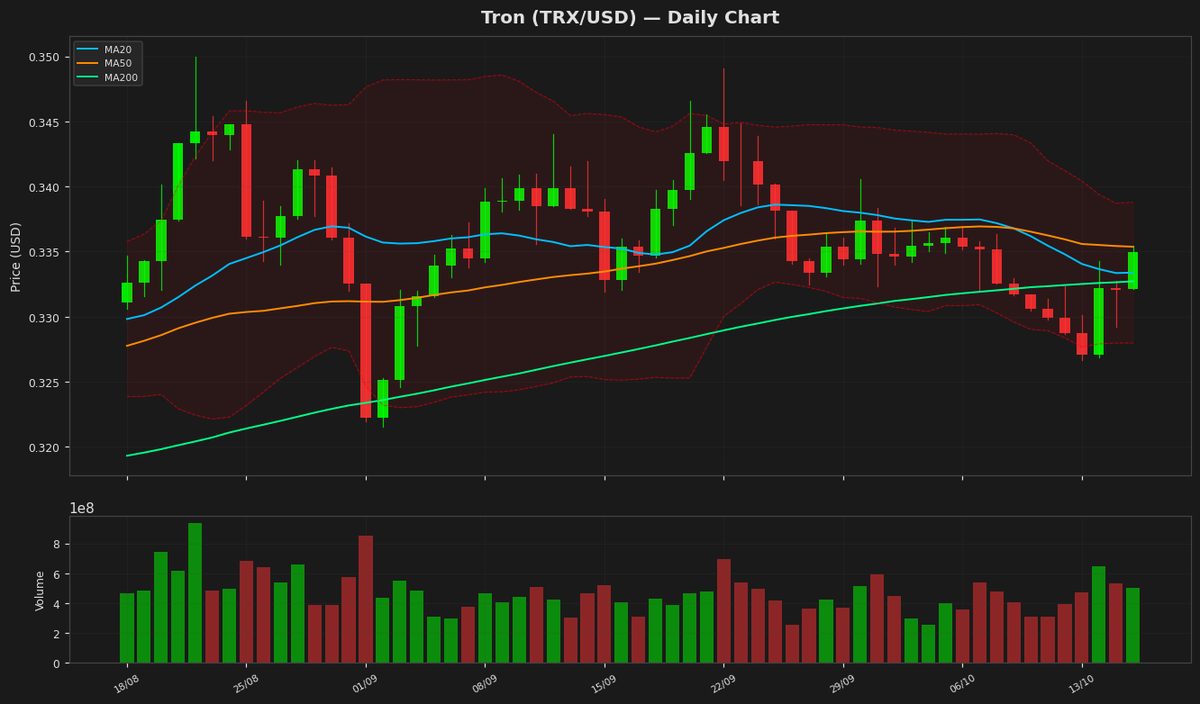
$0.322968 52W: $0.268138 — $0.376332
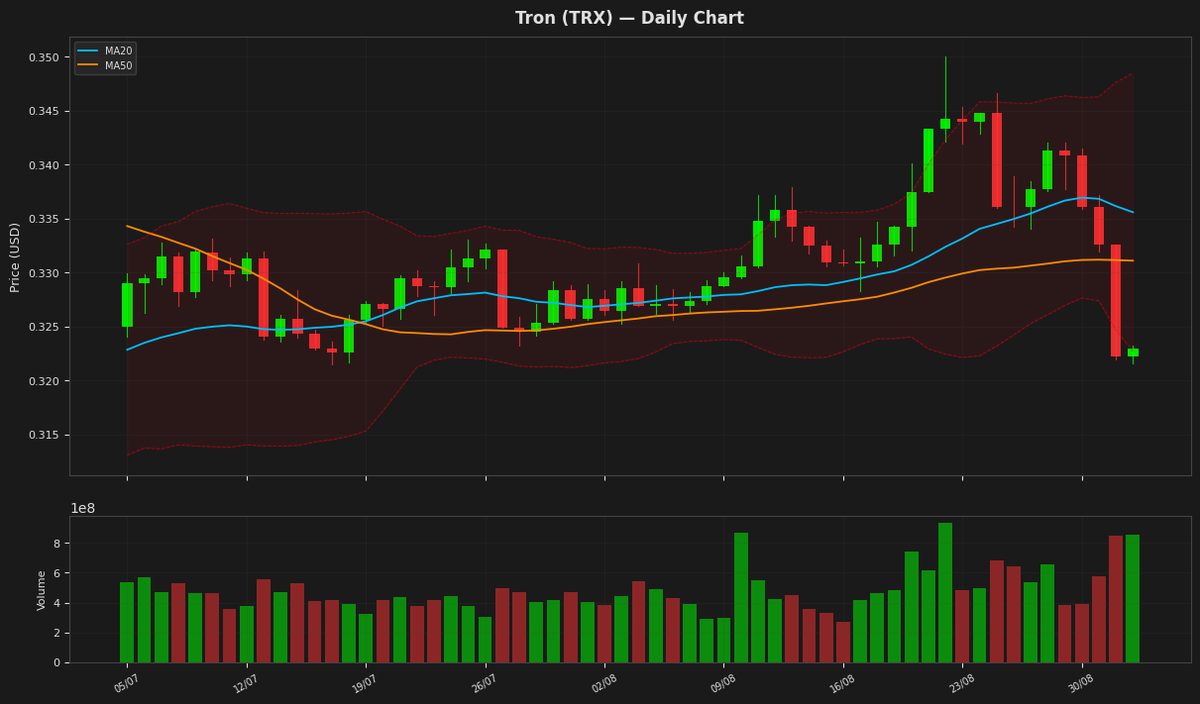
Tron's price is currently at $0.322968, near the lower Bollinger Band at $0.322683, indicating potential support. The RSI is at 37.455868, suggesting the asset is approaching oversold territory. The MACD is below its signal line, indicating a bearish trend. The price is below both the MA20 and MA50, further confirming the downtrend.
Dogecoin (DOGE) — -0.24%
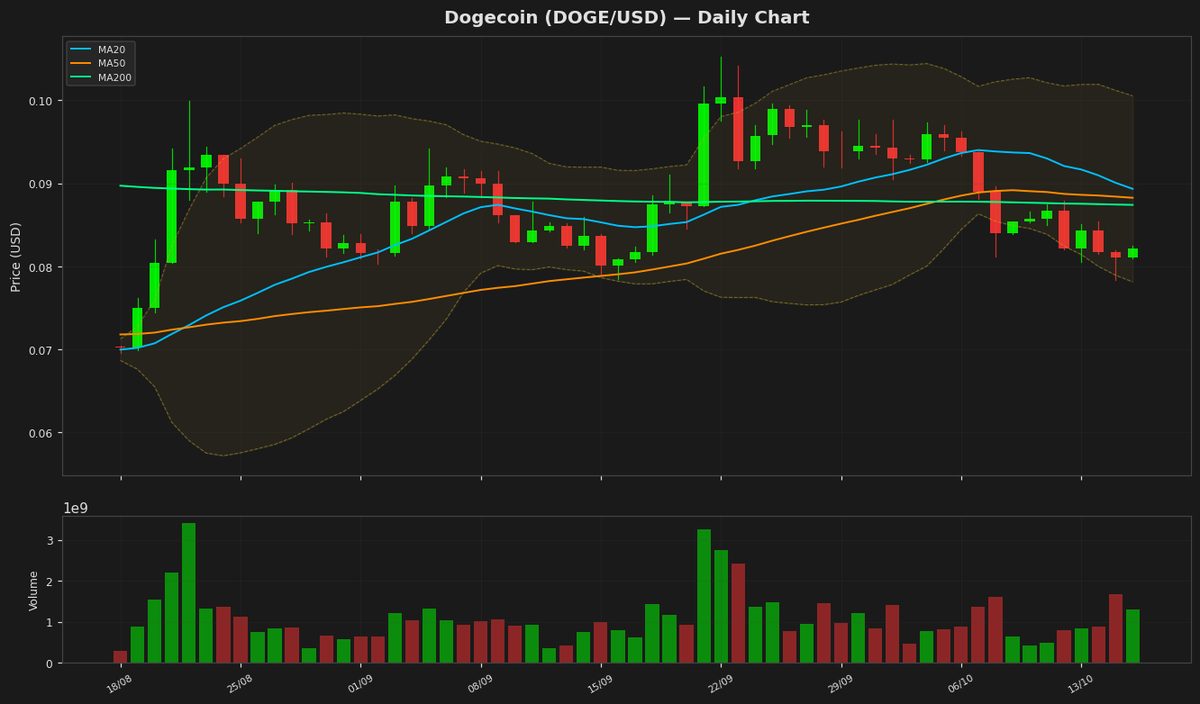
$0.081450 52W: $0.067973 — $0.156091
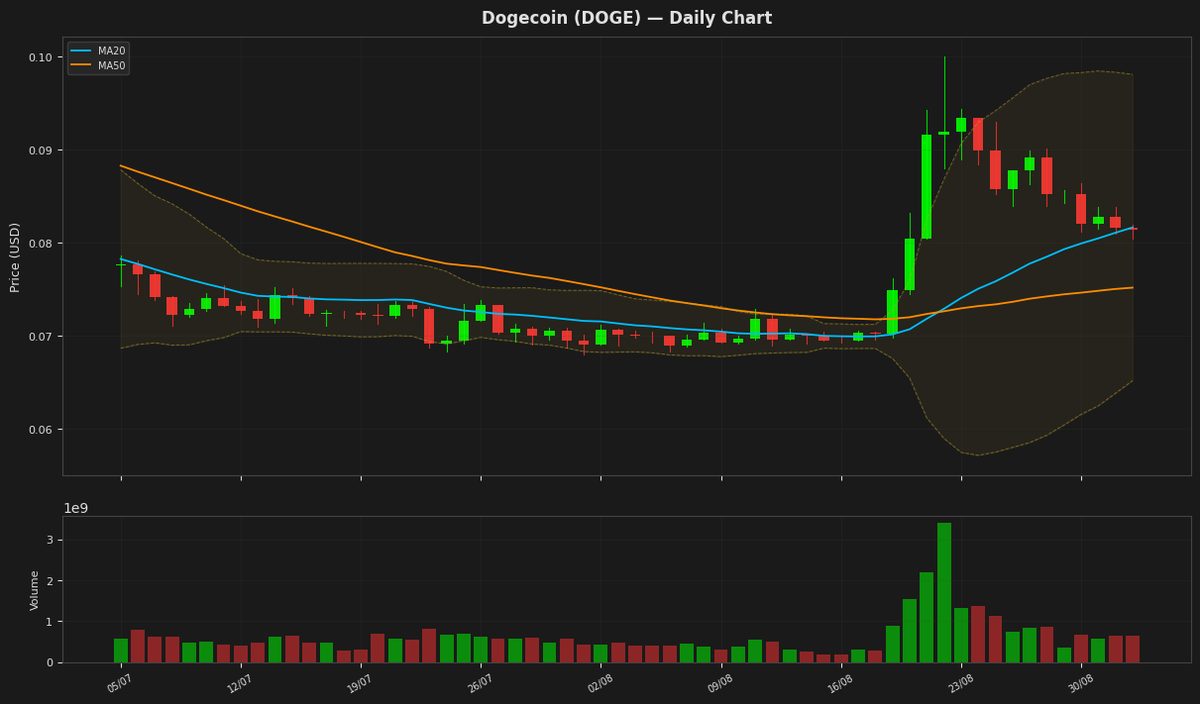
Dogecoin's price is currently trading at $0.081450, slightly below its 20-day moving average of 0.08165, indicating a lack of strong directional momentum. The Relative Strength Index (RSI) at 58.342346 suggests the cryptocurrency is nearing overbought territory but still has room to move higher. The Moving Average Convergence Divergence (MACD) is below its signal line, indicating a potential bearish signal. The price is also within the Bollinger Bands, with the upper band at 0.098094 and lower band at 0.065206, suggesting a possible consolidation phase.
Disclaimer
The content on MarketsFN.com is provided for educational and informational purposes only. It does not constitute financial advice or investment recommendations. All investments involve risk. Past performance does not guarantee future results.