Crypto Market Update: Bitcoin Steady, Dogecoin Rises, Ripple Takes a Hit
QuoteReporter
•5 min read
Crypto Market Report | October 26, 2026
📊 Crypto Market Overview
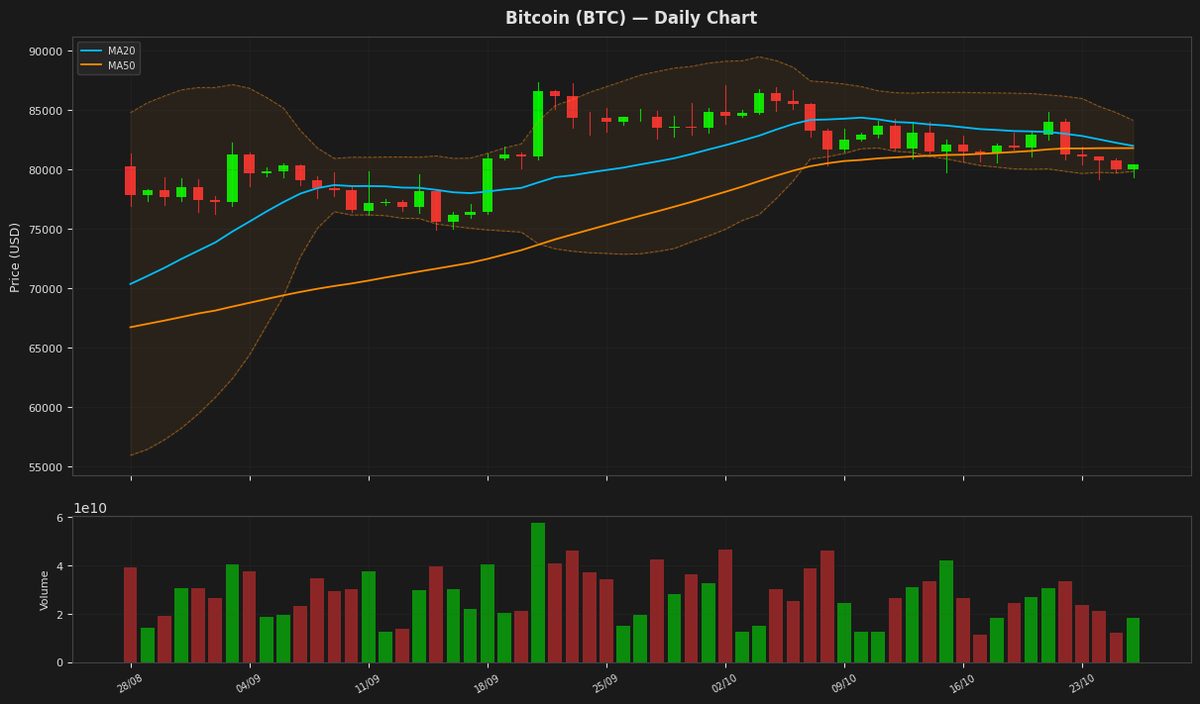
The cryptocurrency market is currently displaying a mixed sentiment, with some assets experiencing minor gains while others edge lower. Bitcoin, the largest cryptocurrency by market capitalization, has risen by 0.47% to $80,403.7812, with its Relative Strength Index (RSI) standing at 44.1, indicating a neutral territory. The MACD indicator is negative at -406.4795, suggesting a bearish trend.
Other major cryptocurrencies are also showing varied performance. Ethereum is up 0.16% to $2,330.7200, with an RSI of 36.5 and a negative MACD of -57.9406, indicating a potential oversold condition. Ripple, on the other hand, has declined by 0.41% to $1.2891, with an RSI of 40.4 and a negative MACD of -0.0348.
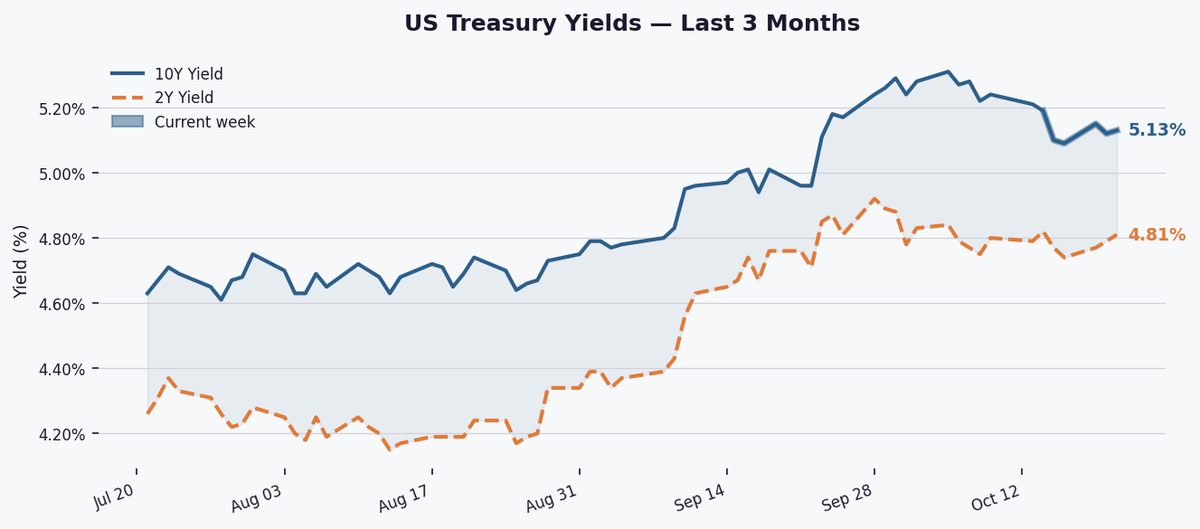
The recent influx of $301 million into Bitcoin ETFs has broken a two-week outflow streak, potentially signaling a resurgence in investor interest. Meanwhile, the macro context remains closely tied to the interest-rate decisions of major central banks, including the Fed, ECB, and BOJ, which are expected to shape the market's direction in the coming week.
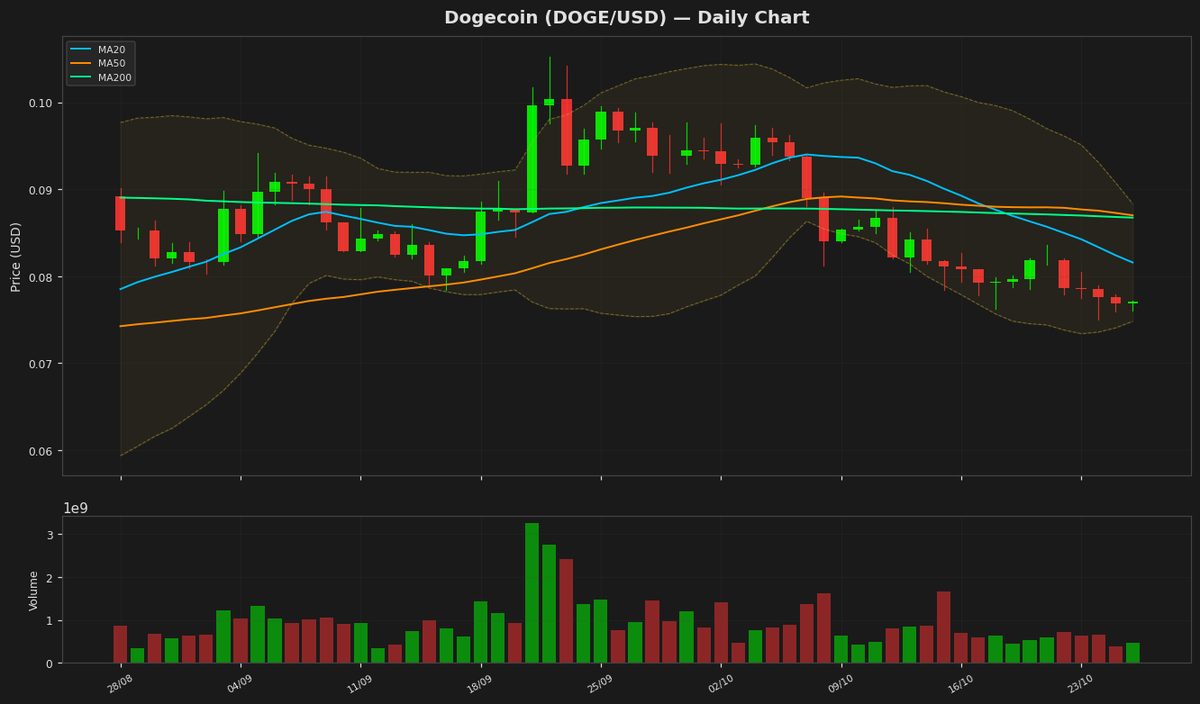
Notable technical signals include the RSI and MACD indicators for various assets. Dogecoin, for instance, has an RSI of 33.5, indicating an oversold condition, while BNB's RSI stands at 53.9, suggesting a relatively balanced position. The recent security breach at Keystone, a hardware wallet provider, has also highlighted the ongoing concerns around security in the cryptocurrency space. Overall, the market is navigating a complex landscape, influenced by a mix of technical, macroeconomic, and regulatory factors.
📰 Crypto News
- Bitcoin ETFs break 2-week outflow streak with $301M comeback
- Here’s what happened in crypto today
- Musk warns over 200 AI neoclouds face ‘guppy-level death’
- Hong Kong names Nasdaq-listed Solana Company a strategic enterprise
- Keystone says website breach exposed hardware wallet buyers’ addresses
- Standard Chartered-led Anchorpoint says it’s not rushing retail stablecoin
- AI agents help rescue ETH’s Glamsterdam fork, ‘Steal My Bitcoin’ site: Hodler’s Digest
- Fed, ECB and BOJ interest-rate decisions, Coinbase earnings: Crypto Week Ahead
- Over 11 million bitcoin has no known owner. Here's what it means
- India's largest crypto exchange absorbs $16 million loss from internal process failure tied to retired wallet
- Bitcoin wallet bug let rogue servers steal funds when users tried to speed up payments
- Bitcoin slips under $80,000 as traders de-risk ahead of Fed meeting
- Elon Musk issues a warning for 'AI neoclouds' as SpaceX borrows $40 billion for chips
🔍 Technical Analysis
Bitcoin (BTC) — +0.47%
$80,403.78 52W: $57,747.77 — $87,363.76
Bitcoin's price is currently at $80,403.78, showing a slight increase of 0.47% with the RSI(14) at 44.107196 indicating a neutral to slightly oversold condition. The price is hovering near the middle of the Bollinger Bands, with the upper band at $84,149.43 and lower band at $79,846.94, suggesting a potential for a breakout. The MACD is below the signal line, indicating a bearish signal, while the ATR(14) of 2019.59375 suggests high volatility.
Ethereum (ETH) — +0.16%
$2,330.72 52W: $1,506.51 — $2,805.50
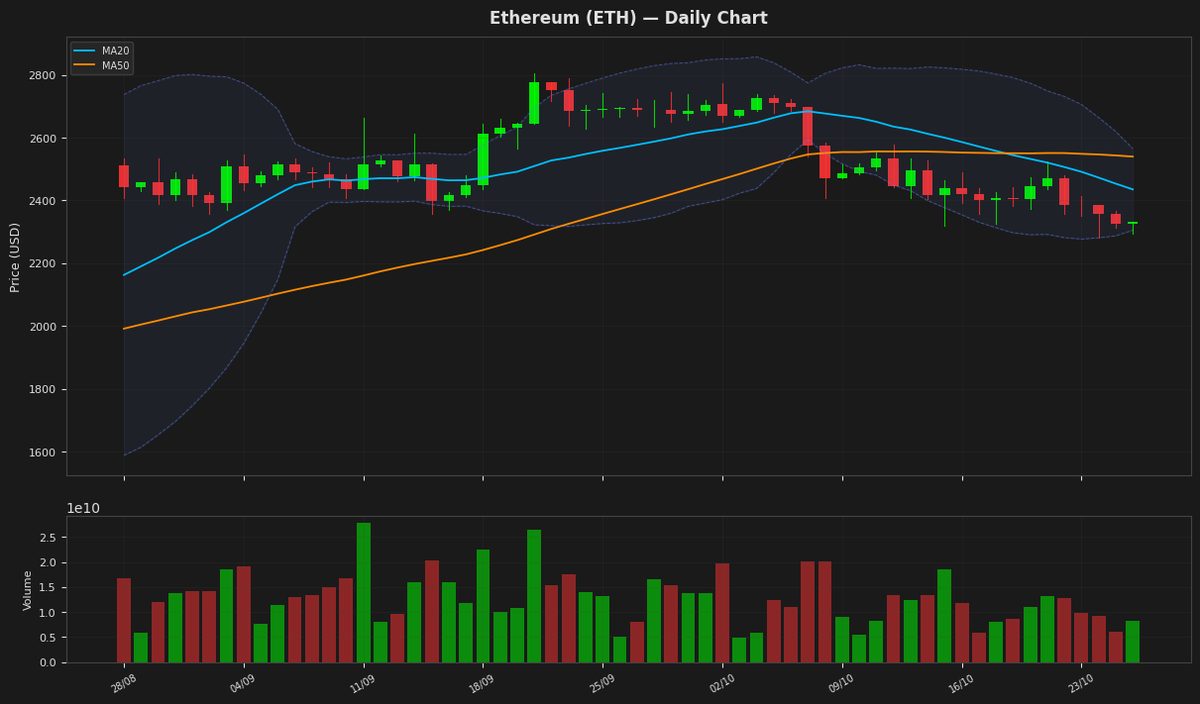
Ethereum's price is currently at $2,330.72, showing a minor increase, and is positioned near the lower band of the Bollinger Bands at $2,305.19, indicating potential support. The RSI is at 36.48, suggesting the asset is nearing oversold territory, while the MACD is below its signal line, indicating a bearish trend. The ATR indicates high volatility, with a 14-day average true range of $93.38.
Ripple (XRP) — -0.41%
$1.2891 52W: $0.988422 — $1.6838
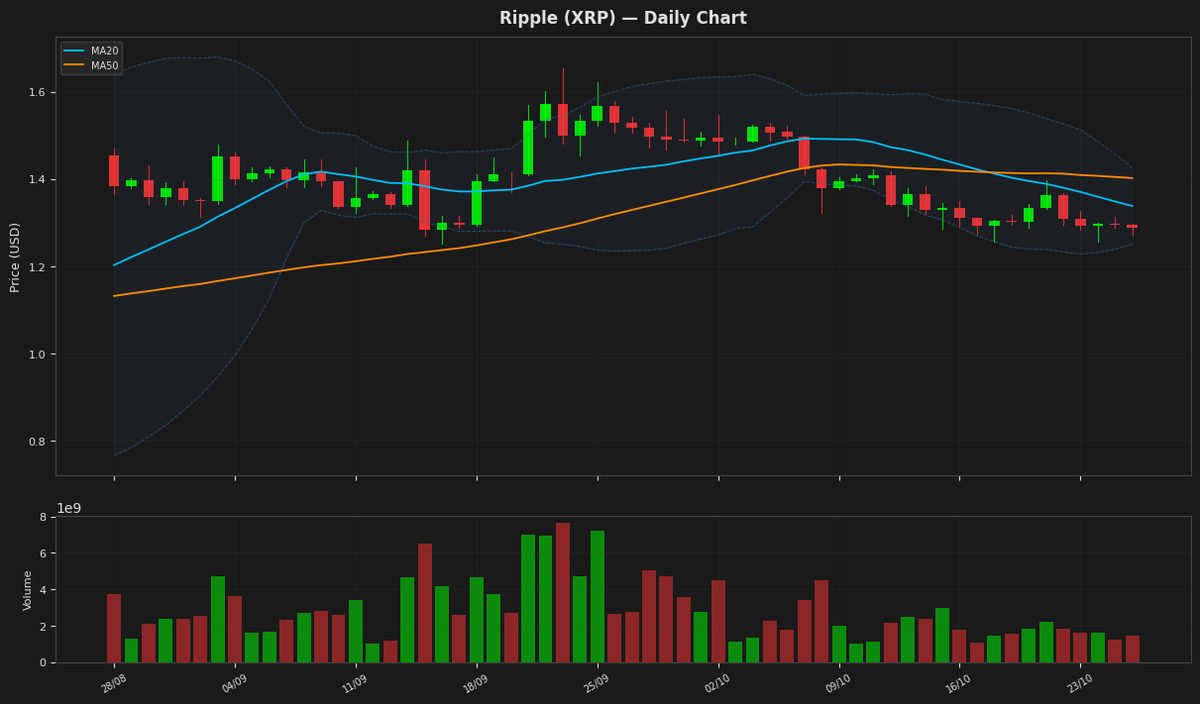
Ripple's price is currently at $1.289100, showing a slight decline, and is positioned between the upper and lower Bollinger Bands, indicating a consolidating trend. The RSI is at 40.418688, suggesting the asset is nearing oversold territory, while the MACD is below the signal line, indicating a bearish signal. The moving averages MA20 and MA50 are above the current price, further supporting a bearish outlook. The ATR indicates moderate volatility.
Solana (SOL) — +0.11%
$101.3300 52W: $60.4147 — $124.6174
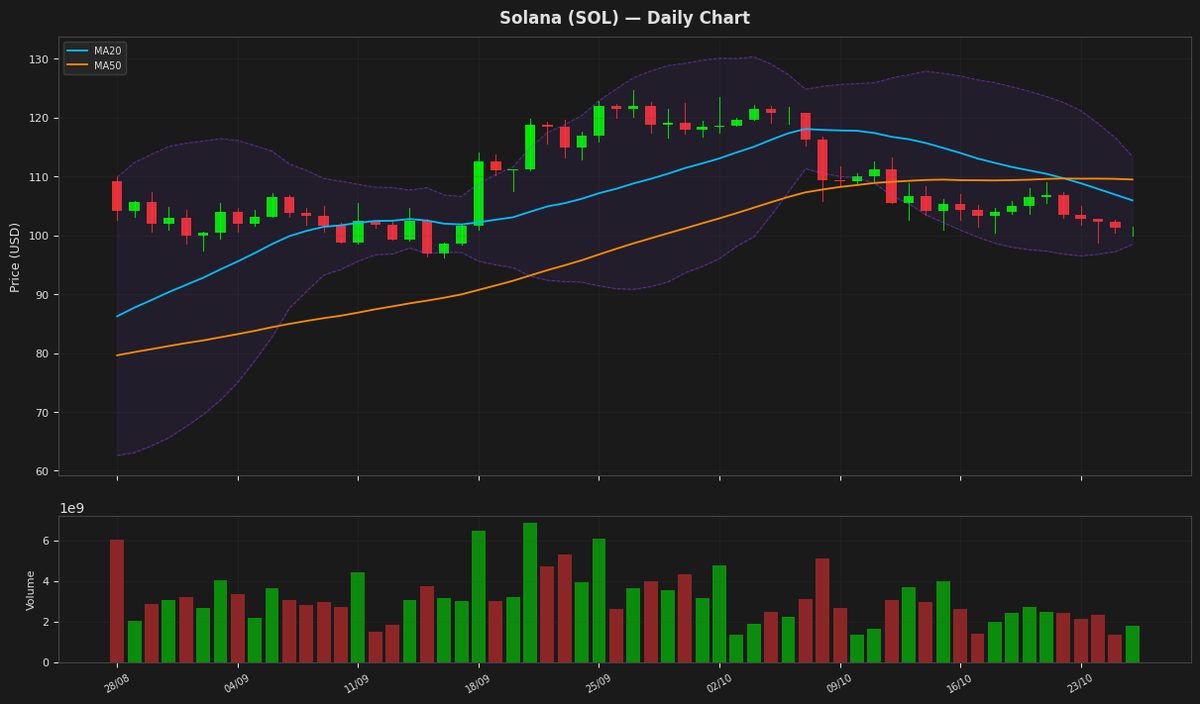
Solana's price is currently at $101.33, showing a minimal daily change of +0.11%. The RSI(14) value of 36.99 indicates that the asset is nearing oversold territory, while the MACD is below its signal line, suggesting a bearish trend. The price is also below both MA20 and MA50, and is closer to the lower Bollinger Band, indicating potential support around $98.46.
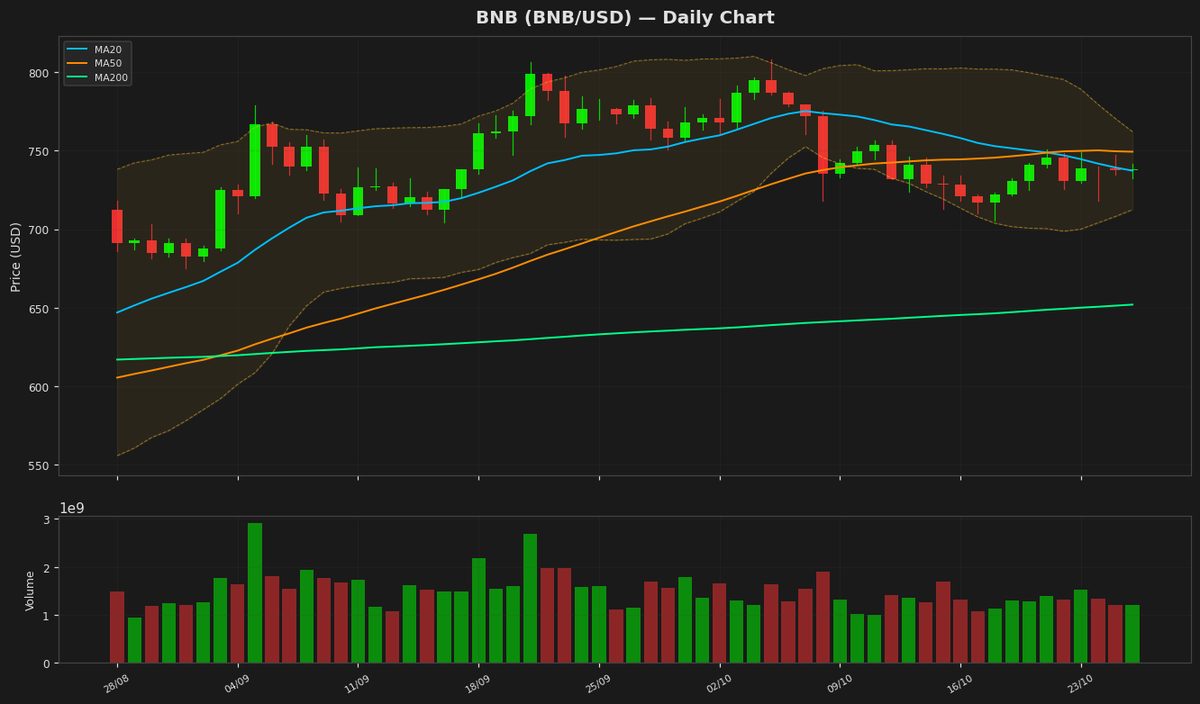
BNB (BNB) — +0.17%
$738.9500 52W: $538.5992 — $808.4329
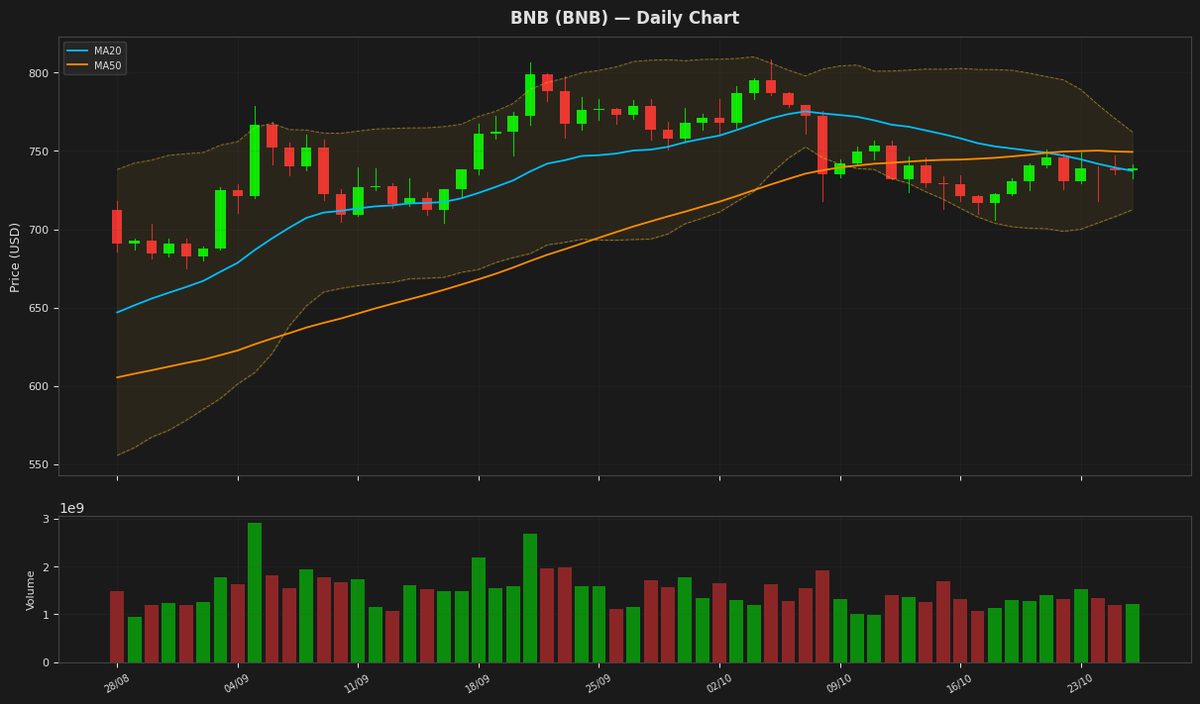
BNB is currently trading at $738.95, near its 20-day moving average of $737.32, indicating a neutral short-term trend. The Relative Strength Index (RSI) at 53.88 suggests a balanced market with no clear overbought or oversold conditions. The price is also within the Bollinger Bands, with the upper band at $762.19 and lower band at $712.46, indicating moderate volatility.
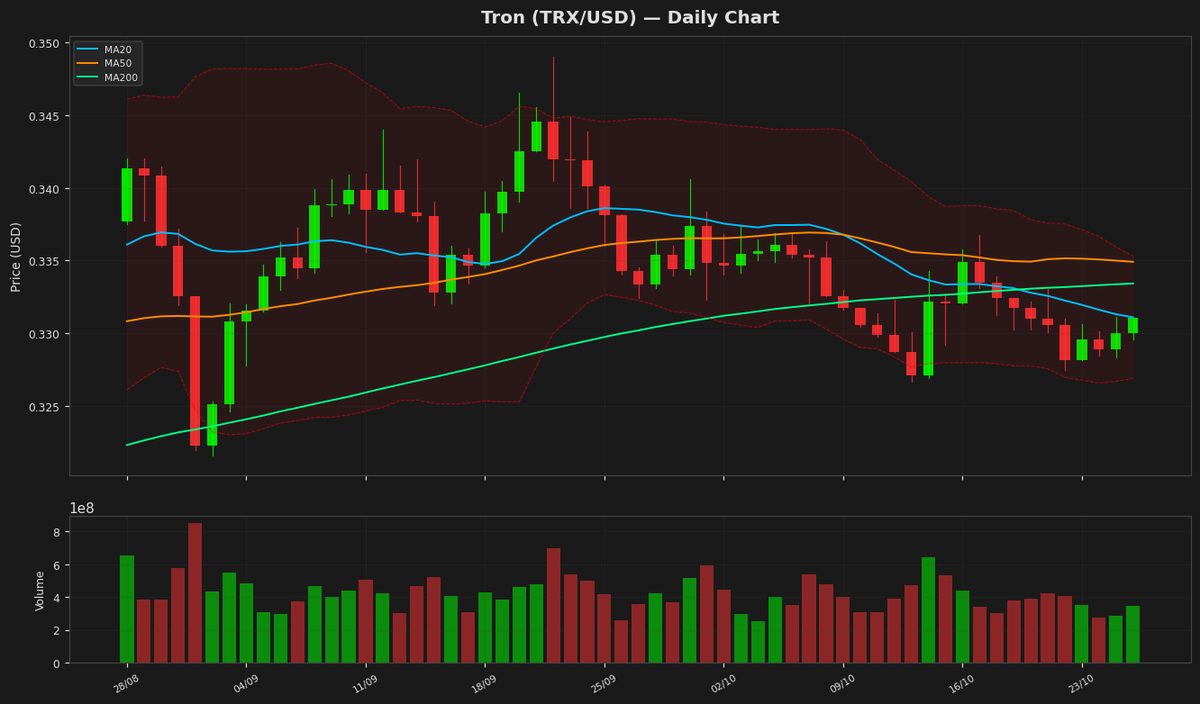
Tron (TRX) — +0.13%
$0.330425 52W: $0.278283 — $0.376332
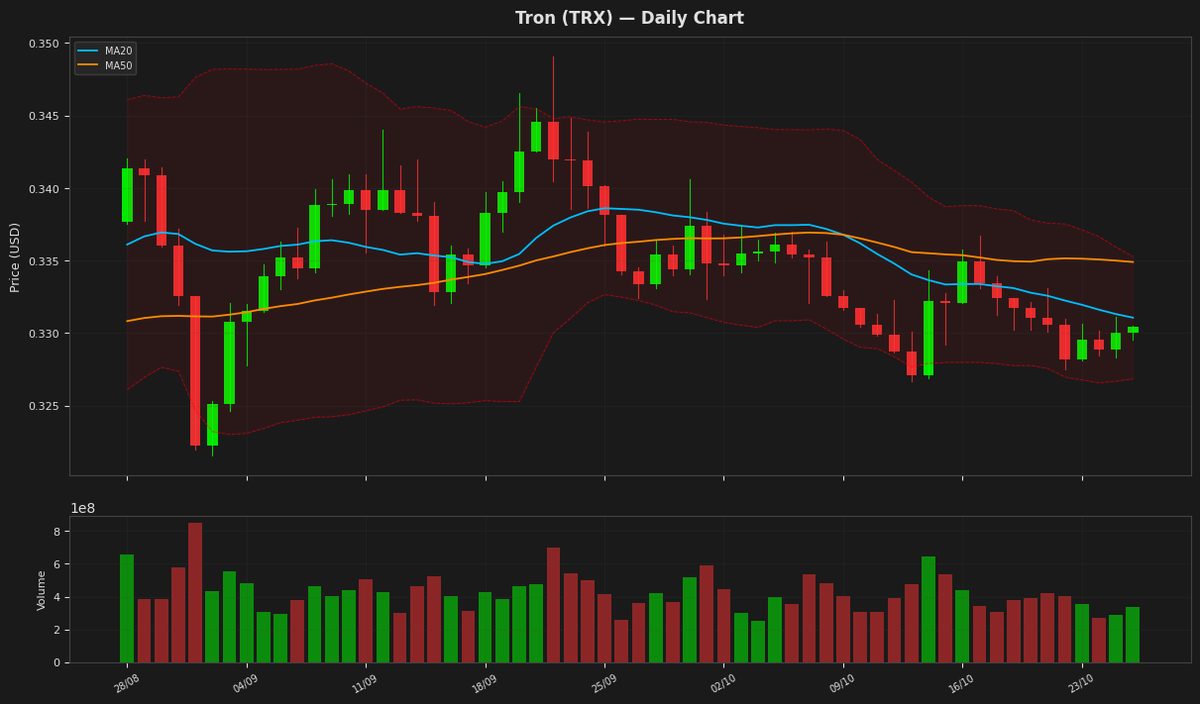
Tron's price is currently at $0.330425, showing a marginal increase of 0.13%. The RSI value of 54.229149 indicates a neutral market sentiment, while the MACD line is slightly below the signal line, suggesting a potential bearish crossover. The price is trading near the middle of the Bollinger Bands, with the upper and lower bands at 0.335282 and 0.326842 respectively, indicating moderate volatility.
Dogecoin (DOGE) — +0.45%
$0.077190 52W: $0.067973 — $0.118255
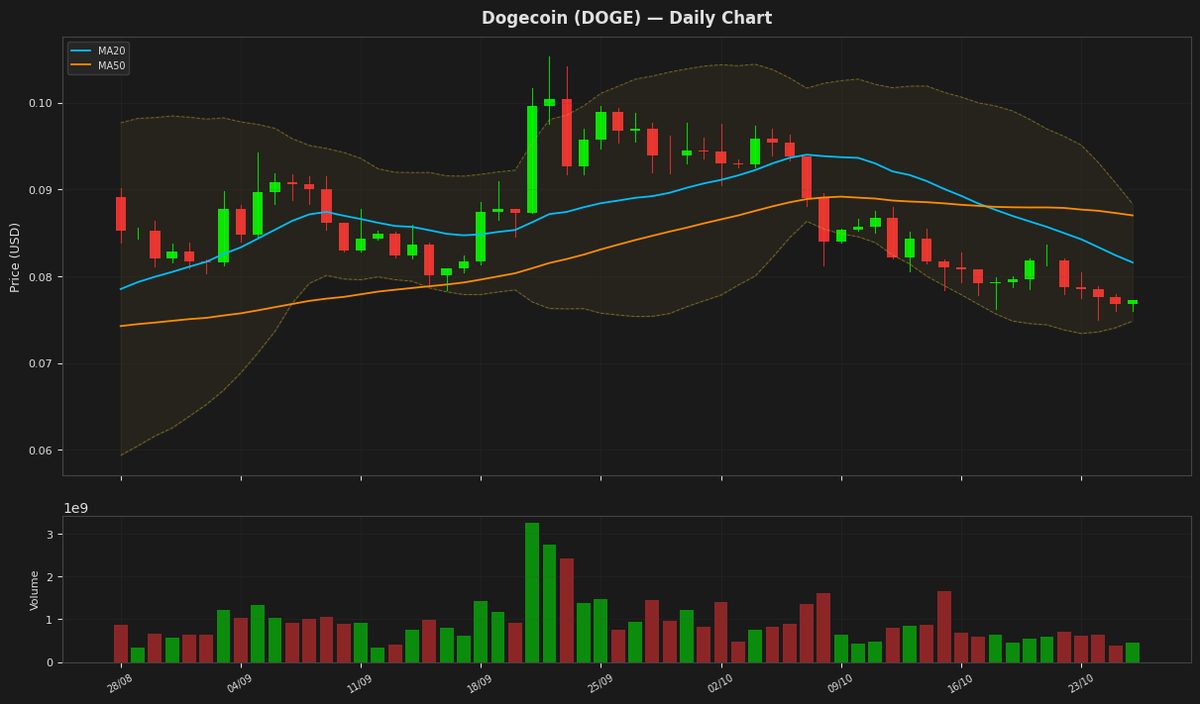
Dogecoin's price is currently trading near the lower Bollinger Band at $0.074828, indicating potential support. The RSI(14) value of 33.546851 suggests that the cryptocurrency is approaching oversold territory, which could lead to a bounce. The MACD is below the signal line, indicating a bearish trend, but the histogram is not strongly negative, suggesting a possible slowdown in the downtrend. The price is still below both MA20 and MA50, indicating a medium-term downtrend.
Disclaimer
The content on MarketsFN.com is provided for educational and informational purposes only. It does not constitute financial advice or investment recommendations. All investments involve risk. Past performance does not guarantee future results.