Crypto Market Slumps: Solana, Ripple, and Dogecoin Lead Today's Losses
QuoteReporter
•5 min read
Crypto Market Slumps: Solana, Ripple, and Dogecoin Lead Today's Losses
Crypto Market Report | August 28, 2026
📊 Crypto Market Overview
The cryptocurrency market is currently characterized by a mixed sentiment, with most major assets experiencing minor losses. Bitcoin, the largest cryptocurrency by market capitalization, is trading at $79,792.4219, down 0.58% on the day, with its Relative Strength Index (RSI) standing at 89.2, indicating overbought conditions. The MACD is at 4246.5096, suggesting a strong upward momentum. Other major cryptocurrencies, such as Ethereum, Solana, and BNB, are also showing signs of being overbought, with RSI values above 80.
Among the key movers, Ripple and Solana have seen the largest declines, with XRP down 1.98% and SOL down 2.42%. In contrast, Tron has bucked the trend, rising 0.55% on the day. The MACD indicators for most major cryptocurrencies remain positive, suggesting that the upward trend is still intact.
The macroeconomic context is influencing the crypto market, with attention drawn to the upcoming Jackson Hole speech by Warsh, which is expected to have implications for bitcoin and gold. The market is also reacting to various news items, including a reported transaction replacement attack on an outdated Ledger Ethereum app and a pledge by The Sandbox to repay users affected by a bridge exploit.
Notable technical signals include the premium at which bitcoin is trading on Coinbase, a phenomenon that has not been observed in a long time. This development is being closely watched by market participants. Overall, the crypto market is displaying a complex picture, with both positive and negative signals present. The current market dynamics are being shaped by a combination of technical and macroeconomic factors.
Among the key movers, Ripple and Solana have seen the largest declines, with XRP down 1.98% and SOL down 2.42%. In contrast, Tron has bucked the trend, rising 0.55% on the day. The MACD indicators for most major cryptocurrencies remain positive, suggesting that the upward trend is still intact.
The macroeconomic context is influencing the crypto market, with attention drawn to the upcoming Jackson Hole speech by Warsh, which is expected to have implications for bitcoin and gold. The market is also reacting to various news items, including a reported transaction replacement attack on an outdated Ledger Ethereum app and a pledge by The Sandbox to repay users affected by a bridge exploit.
Notable technical signals include the premium at which bitcoin is trading on Coinbase, a phenomenon that has not been observed in a long time. This development is being closely watched by market participants. Overall, the crypto market is displaying a complex picture, with both positive and negative signals present. The current market dynamics are being shaped by a combination of technical and macroeconomic factors.
📰 Crypto News
- OneKey reproduces transaction replacement attack on outdated Ledger Ethereum app
- Visa works with Upbit parent on stablecoin payments, AI commerce
- Here’s what happened in crypto today
- The Sandbox pledges 1:1 repayment after $700K bridge exploit
- Abu Dhabi royal backs 49% stake in Trump-linked crypto bank venture: WSJ
- Virtu, Tradeweb complete onchain repo using Marshall Islands digital bond
- Here’s why Warsh’s Jackson Hole speech is a major event for bitcoin and gold
- Solana’s faster disinflation plan leads vote as $800K burn proposal trails
- Bitcoin is trading at a premium on Coinbase after a long time. Here's what it means
- Bitcoin under $80,000, solana leads majors higher before Warsh's Jackson Hole debut
- An XRP treasury company backed by Ripple is a shareholder vote away from Nasdaq
- Bitcoin Completes First Experimental Quantum-Safe Transaction, Starkware Says
- Google’s Android 17 Turns On New Privacy Feature—But Your Browsing Isn’t Fully Hidden
- Bitcoin Privacy Wallet Sparrow Issues Update After AI Flags Fixes
- Red Flag? OpenAI's Agentic ChatGPT Work Signs Into Your Accounts Without You
🔍 Technical Analysis
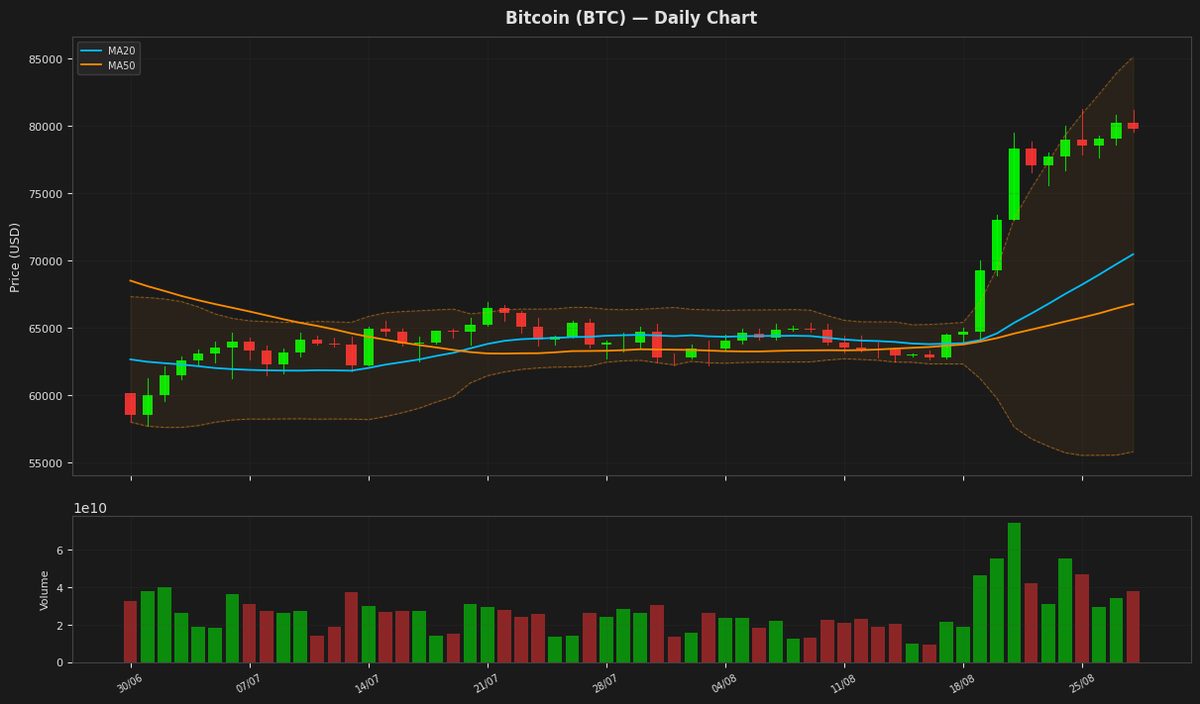
Bitcoin (BTC) — -0.58%
$79,792.42 52W: $57,747.77 — $97,860.60
Bitcoin's price is currently at $79,792, showing a slight decline of 0.58% and is nearing the upper Bollinger Band at $85,127, indicating potential overbought conditions as supported by the RSI(14) value of 89.18. The MACD is above its signal line, suggesting a bullish trend, but the high RSI value may signal a potential reversal. The ATR(14) indicates high market volatility.
Ethereum (ETH) — -0.48%
$2,498.24 52W: $1,506.51 — $3,397.90
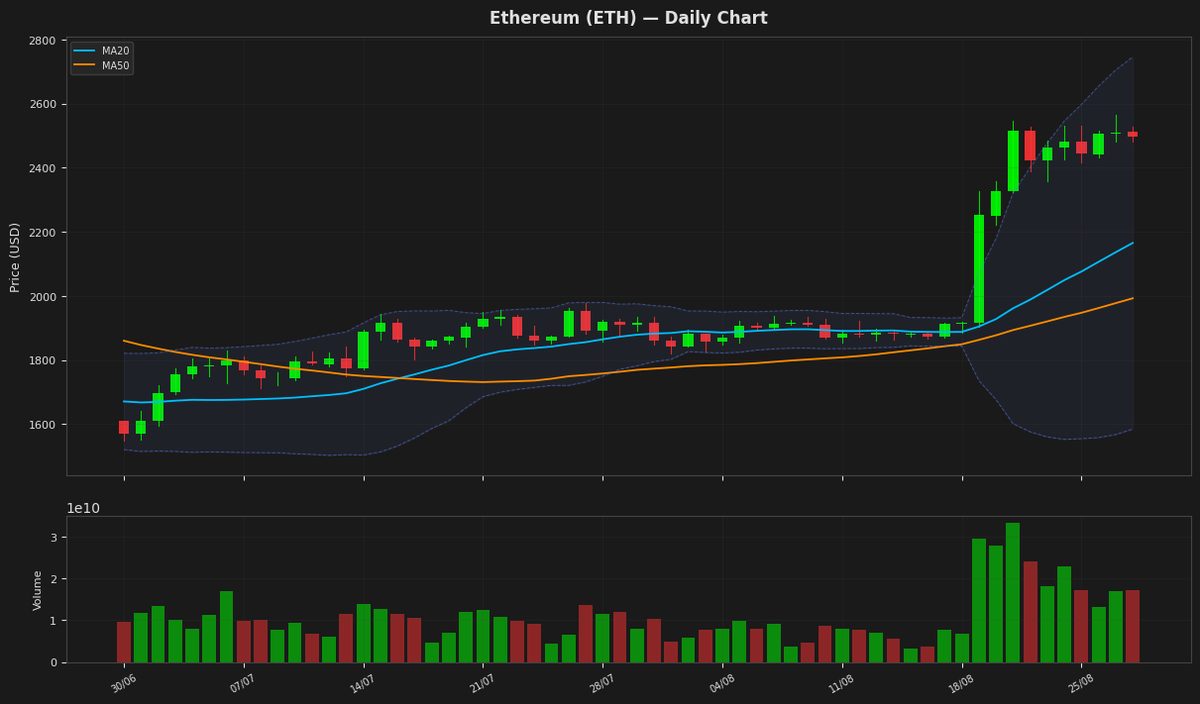
Ethereum is currently trading at $2,498.24, near the upper end of its recent range, with the RSI(14) at 83.74 indicating overbought conditions. The price is close to the upper Bollinger Band at $2,746.35, suggesting potential resistance. The MACD is above its signal line, indicating a bullish signal, but the high RSI value may signal a potential reversal. The ATR(14) of $113.69 indicates high volatility.
Ripple (XRP) — -1.98%
$1.4243 52W: $0.988422 — $2.4103
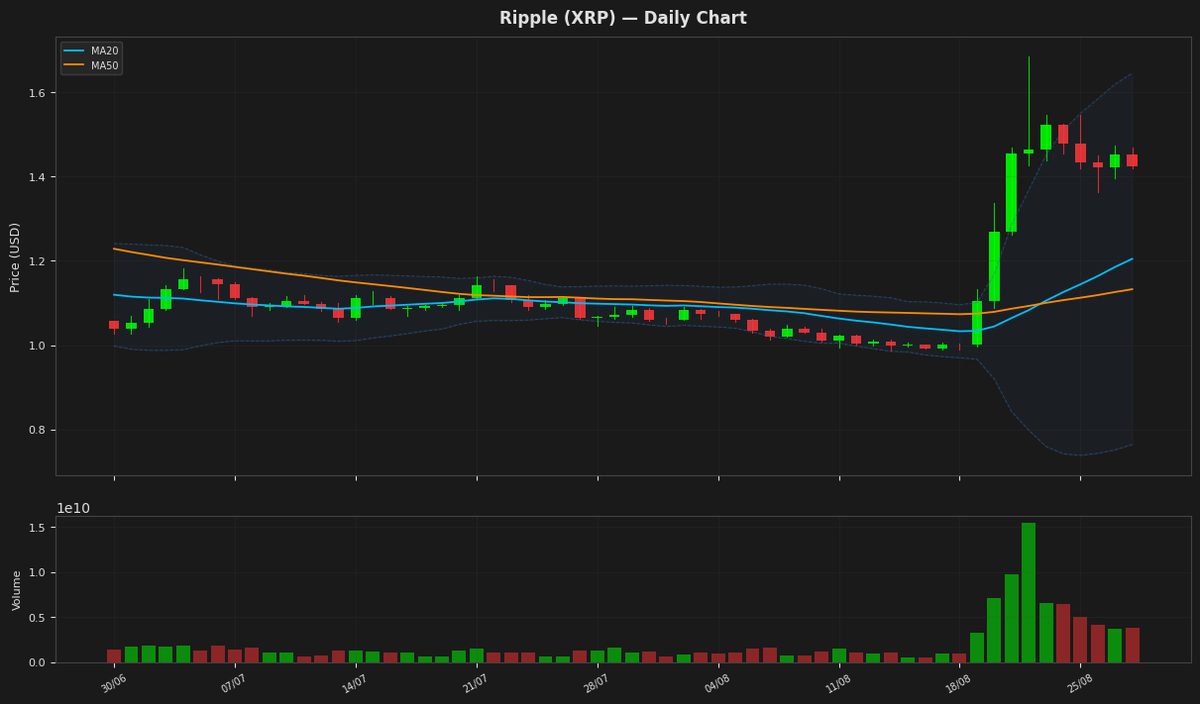
Ripple's price is currently at $1.424300, showing a daily decline of 1.98% and is nearing the upper Bollinger Band at 1.645017, indicating potential overbought conditions as also suggested by the RSI(14) value of 80.247216. The MACD is above its signal line, indicating a bullish signal. The ATR(14) suggests moderate volatility.
Solana (SOL) — -2.42%
$106.5600 52W: $60.4147 — $148.2160
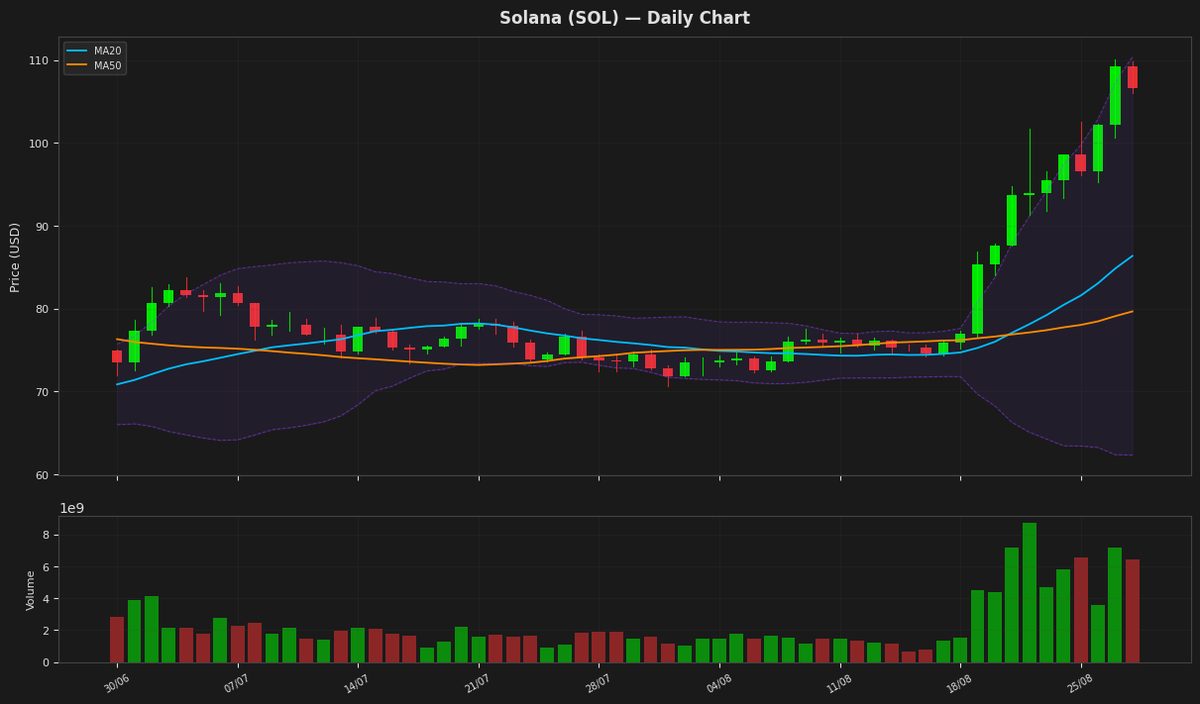
Solana's price is currently at $106.56, showing a decline of 2.42% for the day, and is nearing the upper Bollinger Band at $110.40, indicating potential overbought conditions as also suggested by the RSI(14) value of 87.16. The MACD is above its signal line, indicating a bullish trend. The ATR(14) suggests moderate volatility.
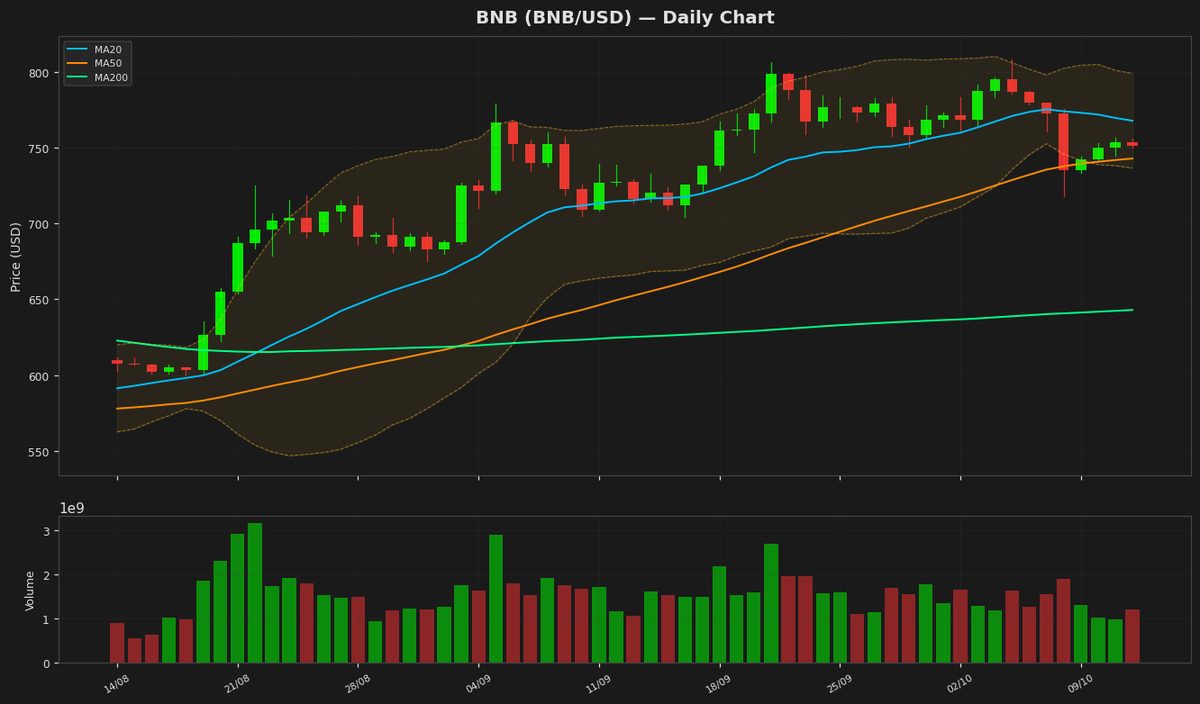
BNB (BNB) — -0.45%
$709.0000 52W: $538.5992 — $954.8583
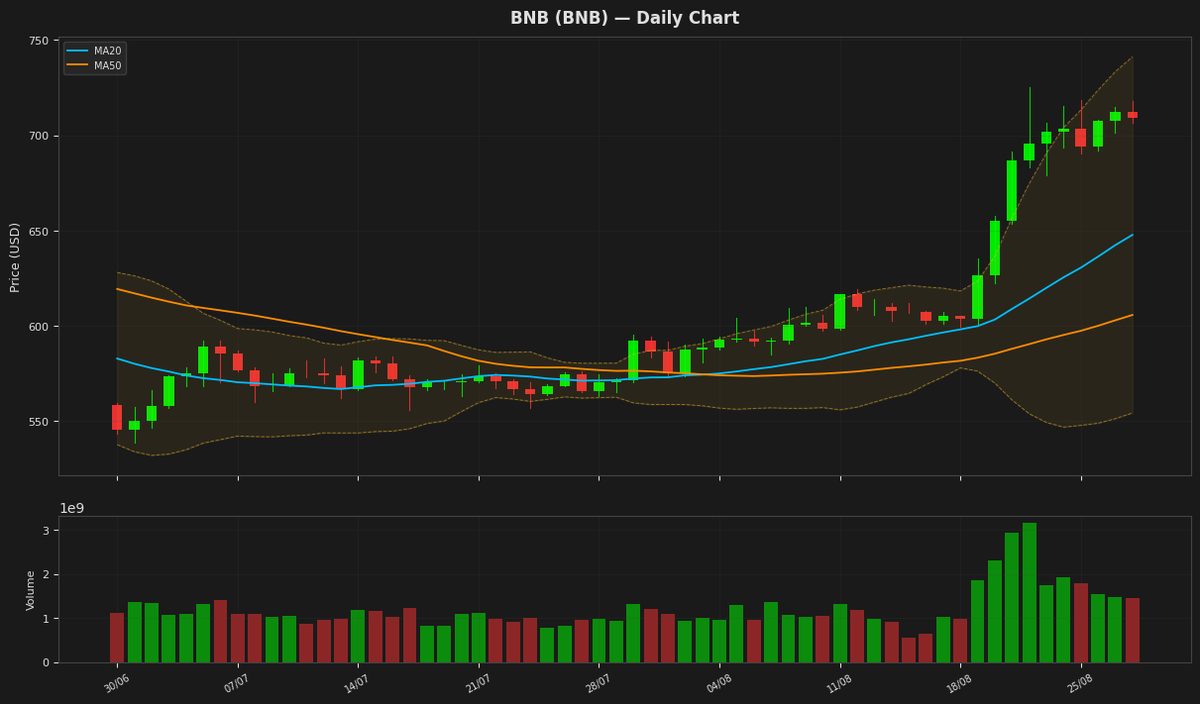
BNB is currently trading at $709 with an RSI of 86.098959, indicating overbought conditions. The price is near the upper Bollinger Band at $741.232084, suggesting potential resistance. The MACD is above the signal line, indicating a bullish signal, but the high RSI value may lead to a correction. The ATR is at $20.797721, indicating moderate volatility.
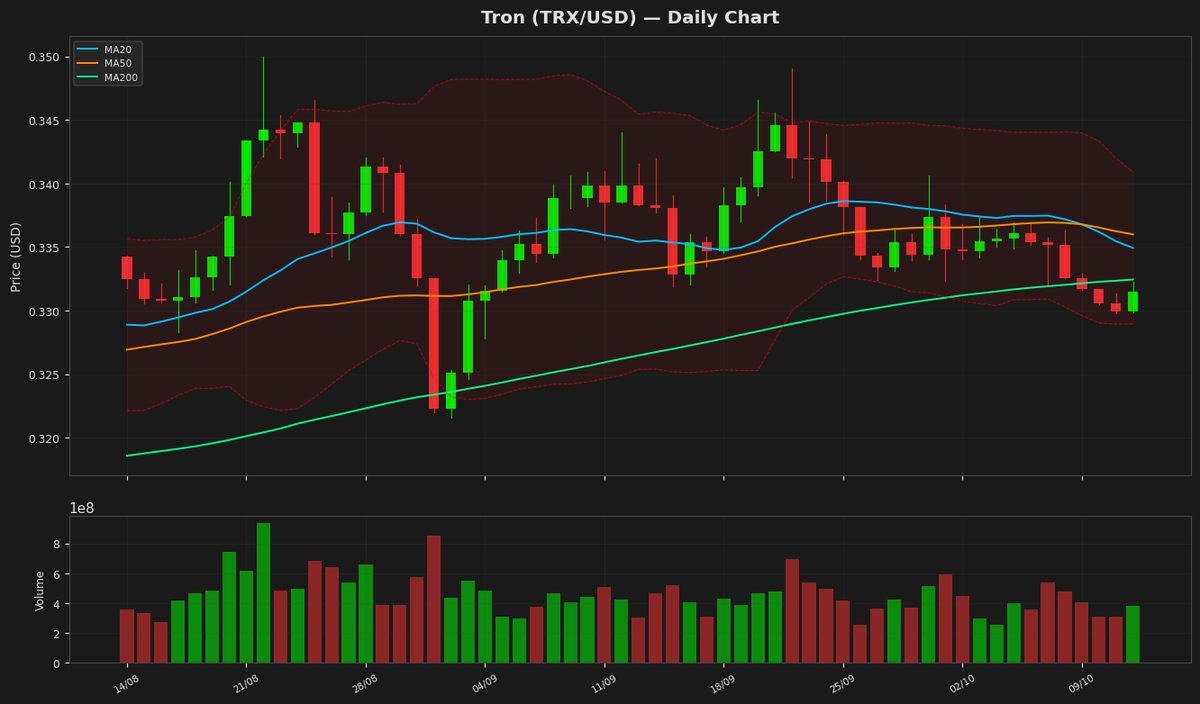
Tron (TRX) — +0.55%
$0.339560 52W: $0.268138 — $0.376332
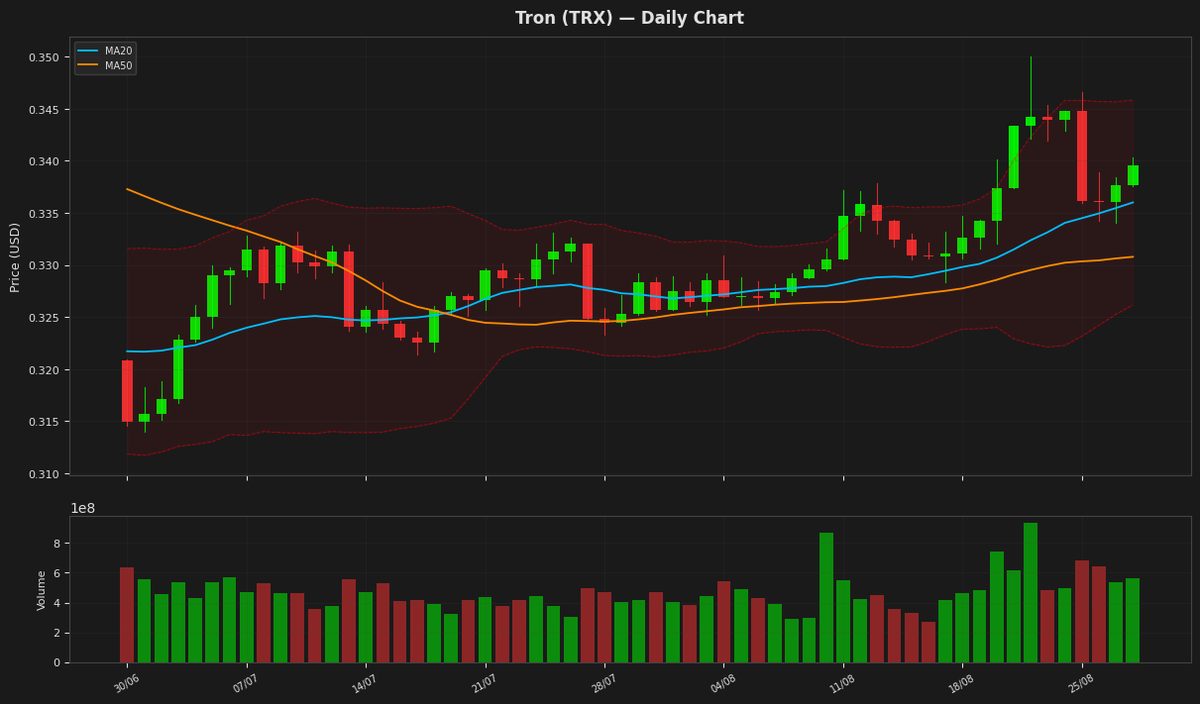
Tron's price is currently at $0.339560, showing a slight increase of 0.55% and trading near the upper Bollinger Band at 0.34585, indicating potential resistance. The RSI is at 62.497065, suggesting the asset is nearing overbought territory. The MACD is below its signal line, indicating a potential sell signal, while the ATR suggests low volatility. The price is still below its 52-week high of 0.376332.
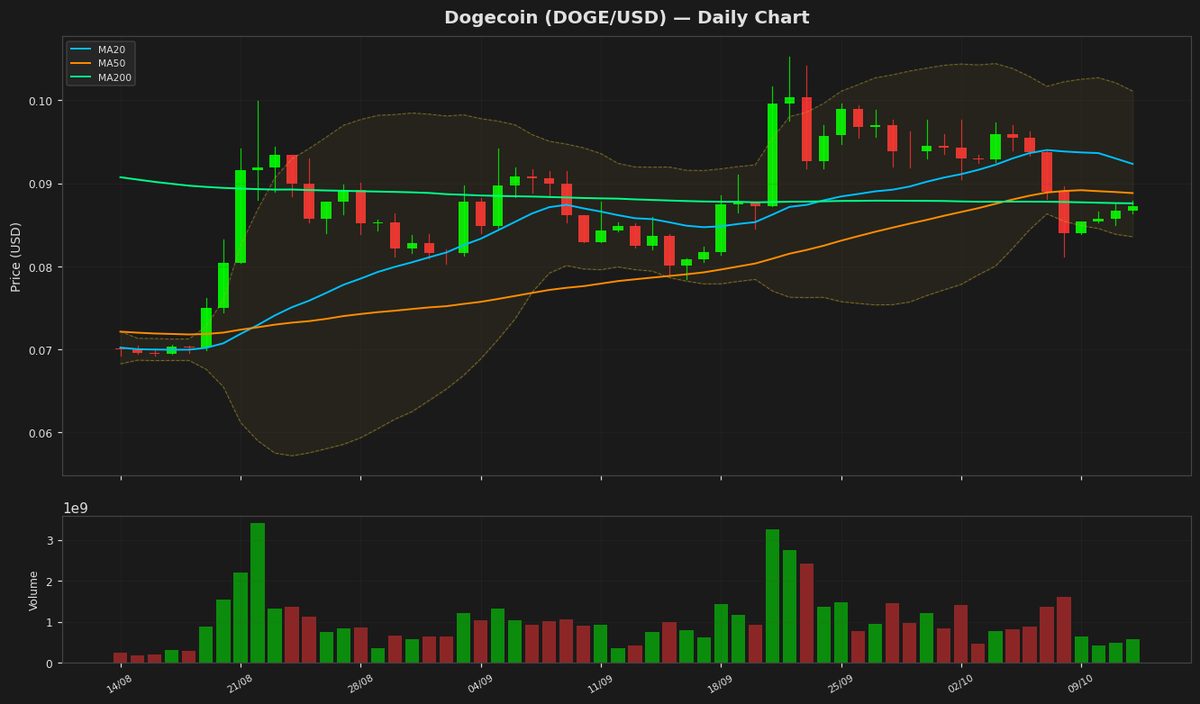
Dogecoin (DOGE) — -1.66%
$0.087660 52W: $0.067973 — $0.156091
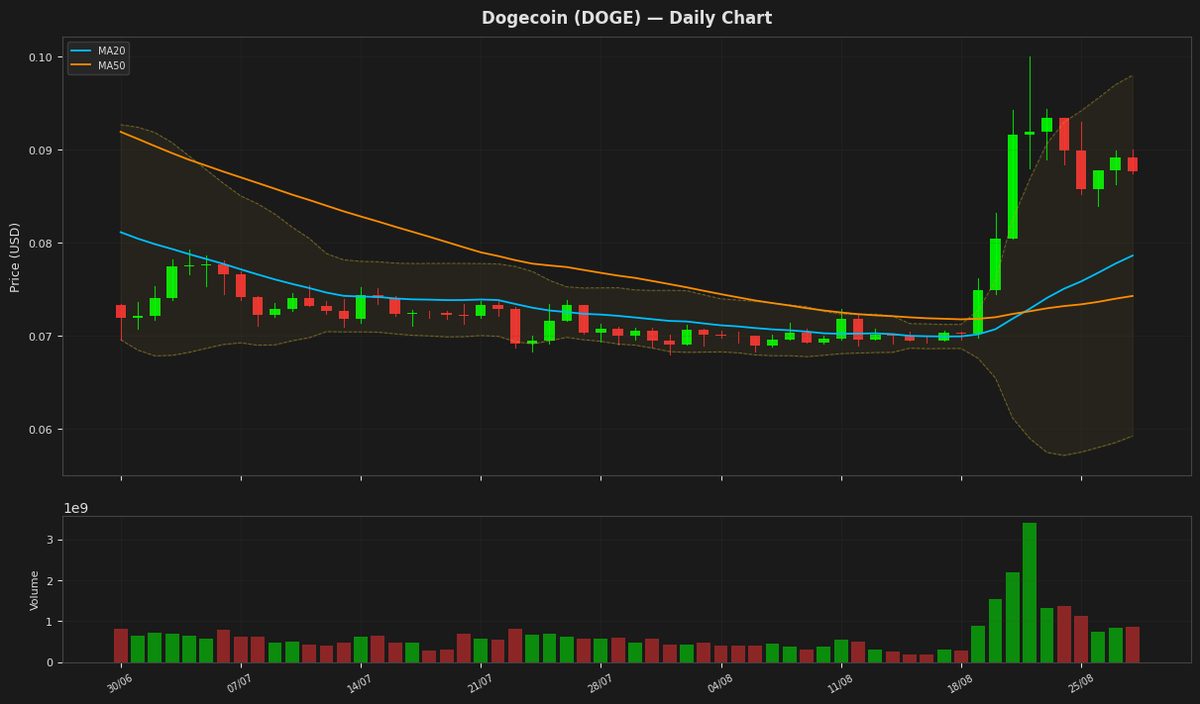
Dogecoin's price is currently at $0.087660, showing a slight decline, and is positioned near the upper Bollinger Band at $0.098005, indicating potential resistance. The RSI is at 73.646148, suggesting the cryptocurrency is in overbought territory. The MACD is above its signal line, indicating a bullish signal, but the high RSI value may indicate a potential reversal. The ATR suggests moderate volatility.
Disclaimer
The content on MarketsFN.com is provided for educational and informational purposes only. It does not constitute financial advice or investment recommendations. All investments involve risk. Past performance does not guarantee future results.