Crypto Market Slumps: Solana, Dogecoin, and Bitcoin Lead Losses Today
QuoteReporter
•5 min read
Crypto Market Slumps: Solana, Dogecoin, and Bitcoin Lead Losses Today
Crypto Market Report | September 25, 2026
📊 Crypto Market Overview
The cryptocurrency market is currently experiencing a relatively stable trading environment, with most major assets exhibiting minor price fluctuations. Bitcoin, the market's benchmark, is trading at $83,903.71, down 0.56% on the day, while other top cryptocurrencies such as Ethereum, Solana, and BNB are also seeing slight declines. The overall market sentiment remains cautiously optimistic, with the Relative Strength Index (RSI) for Bitcoin standing at 68.4, indicating a still-strong but not overbought position.
Notable movers today are relatively subdued, with Ripple being a standout due to its unchanged price. The MACD indicators across major assets suggest a continuation of the recent uptrend, with values remaining positive for Bitcoin, Ethereum, Solana, and BNB. The MACD for Bitcoin is currently at 2463.8876, reinforcing the notion of sustained upward momentum.
The macroeconomic context continues to influence the crypto market, with recent news highlighting concerns around AI's rapid development and potential security risks. The Federal Reserve's proposal for new capital and redemption rules for stablecoin issuers may also have implications for the market's liquidity and stability. Additionally, the recent $352 million security breach at Bitget has raised concerns about the security of cryptocurrency exchanges.
From a technical perspective, the RSI values for most major cryptocurrencies are clustered around the 60-70 range, indicating a relatively healthy and balanced market. Tron is an outlier with an RSI of 50.2, suggesting a more neutral stance. The overall technical signals suggest a market that is still in an uptrend but may be experiencing some consolidation. As the market continues to digest recent news and developments, traders and investors will be closely watching for any signs of shifts in sentiment or momentum.
Notable movers today are relatively subdued, with Ripple being a standout due to its unchanged price. The MACD indicators across major assets suggest a continuation of the recent uptrend, with values remaining positive for Bitcoin, Ethereum, Solana, and BNB. The MACD for Bitcoin is currently at 2463.8876, reinforcing the notion of sustained upward momentum.
The macroeconomic context continues to influence the crypto market, with recent news highlighting concerns around AI's rapid development and potential security risks. The Federal Reserve's proposal for new capital and redemption rules for stablecoin issuers may also have implications for the market's liquidity and stability. Additionally, the recent $352 million security breach at Bitget has raised concerns about the security of cryptocurrency exchanges.
From a technical perspective, the RSI values for most major cryptocurrencies are clustered around the 60-70 range, indicating a relatively healthy and balanced market. Tron is an outlier with an RSI of 50.2, suggesting a more neutral stance. The overall technical signals suggest a market that is still in an uptrend but may be experiencing some consolidation. As the market continues to digest recent news and developments, traders and investors will be closely watching for any signs of shifts in sentiment or momentum.
📰 Crypto News
- Here’s what happened in crypto today
- Australian PM warns of AI’s ‘furious pace’ after agent breached government site
- Researchers propose Zcash-style private Bitcoin transfers without a soft fork
- Block brings Bitcoin Lightning payments to x402 for AI agents
- Bitget CEO suspects North Korea behind $352M hack, citing IP clues
- Asia dominates Crypto Adoption Index, Bitget’s $352M hack: Asia Express
- Fed proposes new capital, redemption rules for stablecoin issuers
- Bitget confirms $352M security breach, suspends withdrawals
- CFTC updates guidance on tokenized assets, blockchain records after failed vote
- Bitcoin price steadies, ONDO rallies as US Treasury yields hit 2007 highs
- DoubleZero brings dedicated fiber market data to Hyperliquid traders
- Live updates: Bitcoin steadies near $84,000 as the bond selloff pauses
- Bitget's $352 million hack happened via spoofed transfers, not private keys, CEO Gray Chen says
- New York sues Polymarket, alleging it is running an illegal gambling operation
- U.S. Federal Reserve moves on proposals to implement GENIUS Act for stablecoins
🔍 Technical Analysis
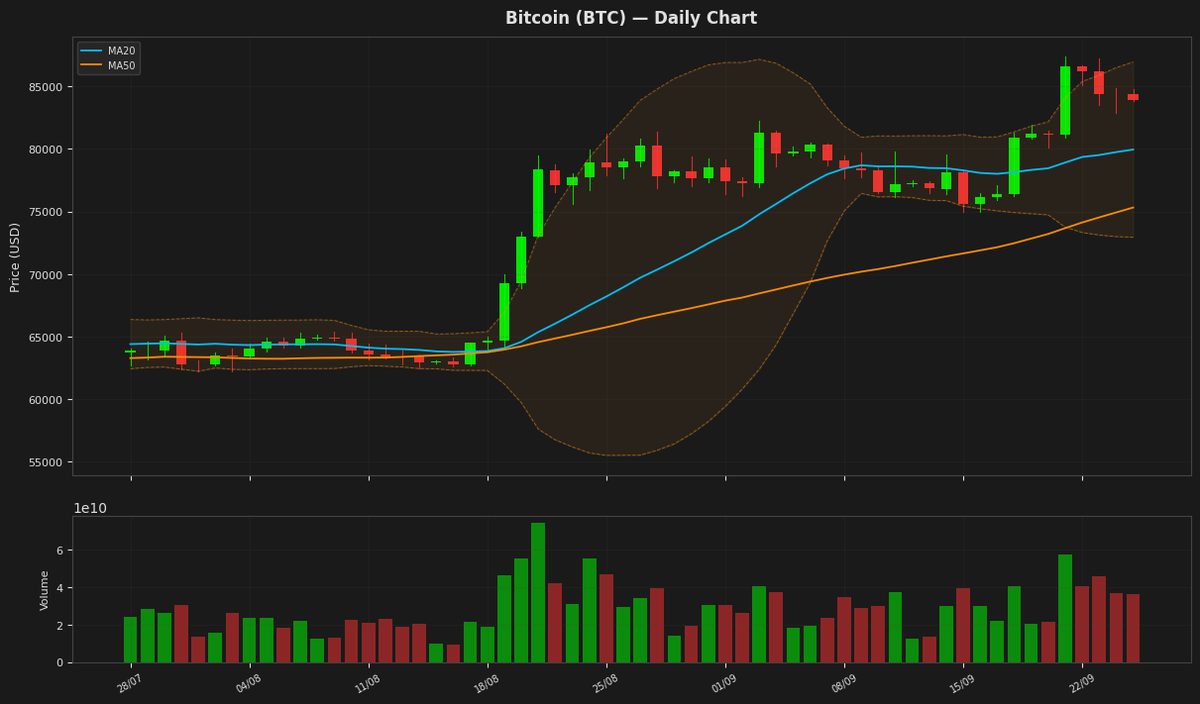
Bitcoin (BTC) — -0.56%
$83,903.71 52W: $57,747.77 — $95,598.48
Bitcoin's price is currently at $83,903.71, showing a minor decline of 0.56% and is positioned near the upper Bollinger Band at $86,955.09, indicating potential resistance. The RSI at 68.41 suggests the asset is nearing overbought territory. The MACD is above its signal line, indicating a bullish trend, but the narrowing gap between the two may signal a potential reversal.
Ethereum (ETH) — -0.50%
$2,673.92 52W: $1,506.51 — $3,367.17
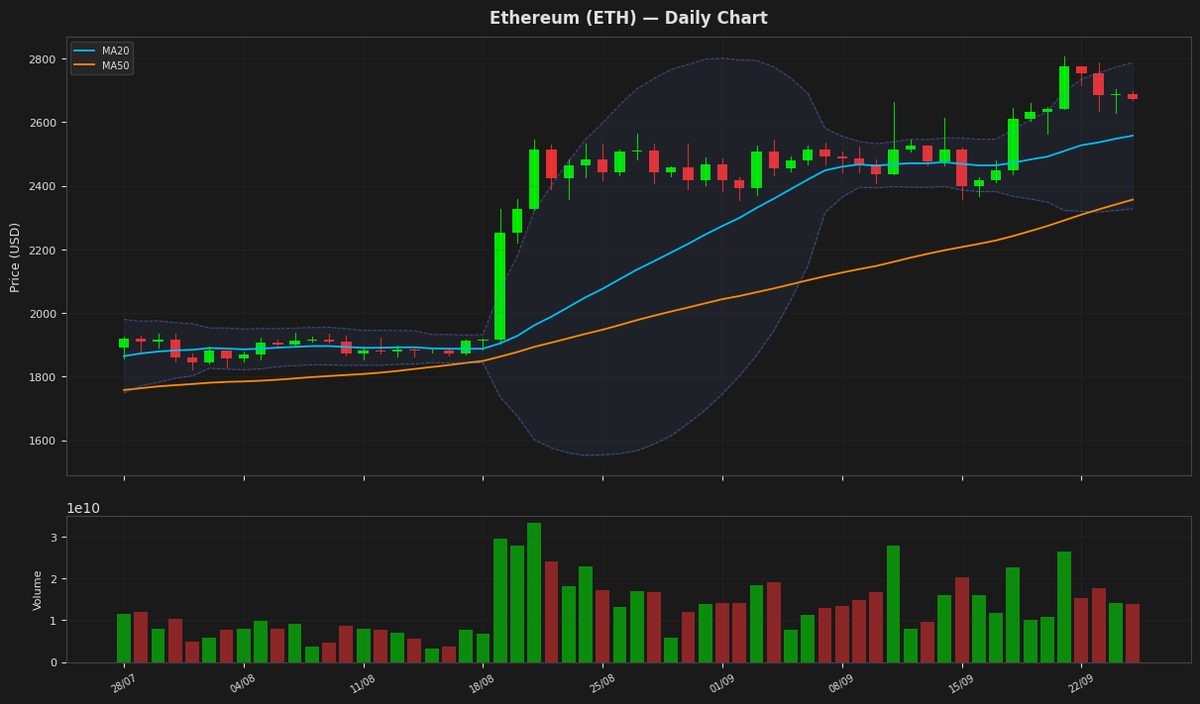
Ethereum's price is currently at $2,673.92, showing a minor decline of 0.50% and trading above its MA20 and MA50, indicating a bullish trend. The RSI is at 61.40, suggesting a relatively strong uptrend without being overbought. The MACD is above its signal line, further supporting the positive momentum. The price is also within the upper half of the Bollinger Bands, with the upper band at $2,787.40.
Ripple (XRP) — +-0.00%
$1.5331 52W: $0.988422 — $2.0806
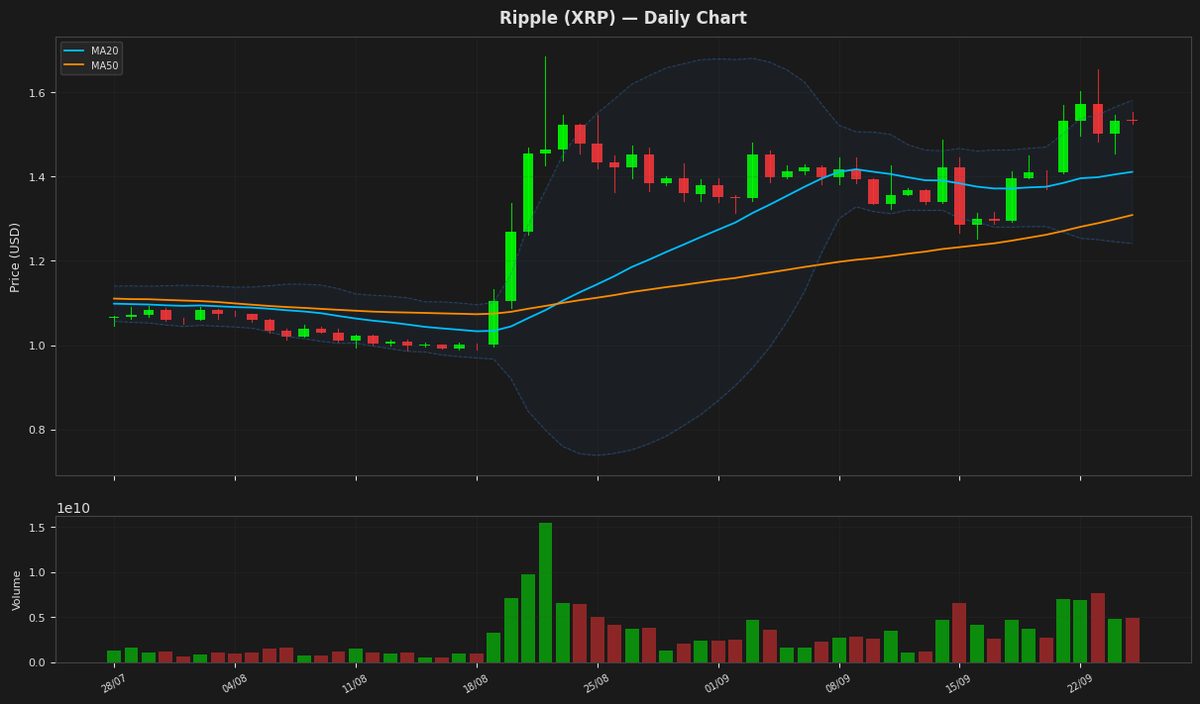
Ripple's price is currently trading at $1.533100, above both its 20-day and 50-day moving averages, indicating a bullish trend. The Relative Strength Index is at 63.567435, suggesting the asset is not overbought. The price is near the upper Bollinger Band at 1.580684, indicating potential resistance at this level. The MACD is above its signal line, confirming the positive momentum.
Solana (SOL) — -0.73%
$116.1500 52W: $60.4147 — $144.8658
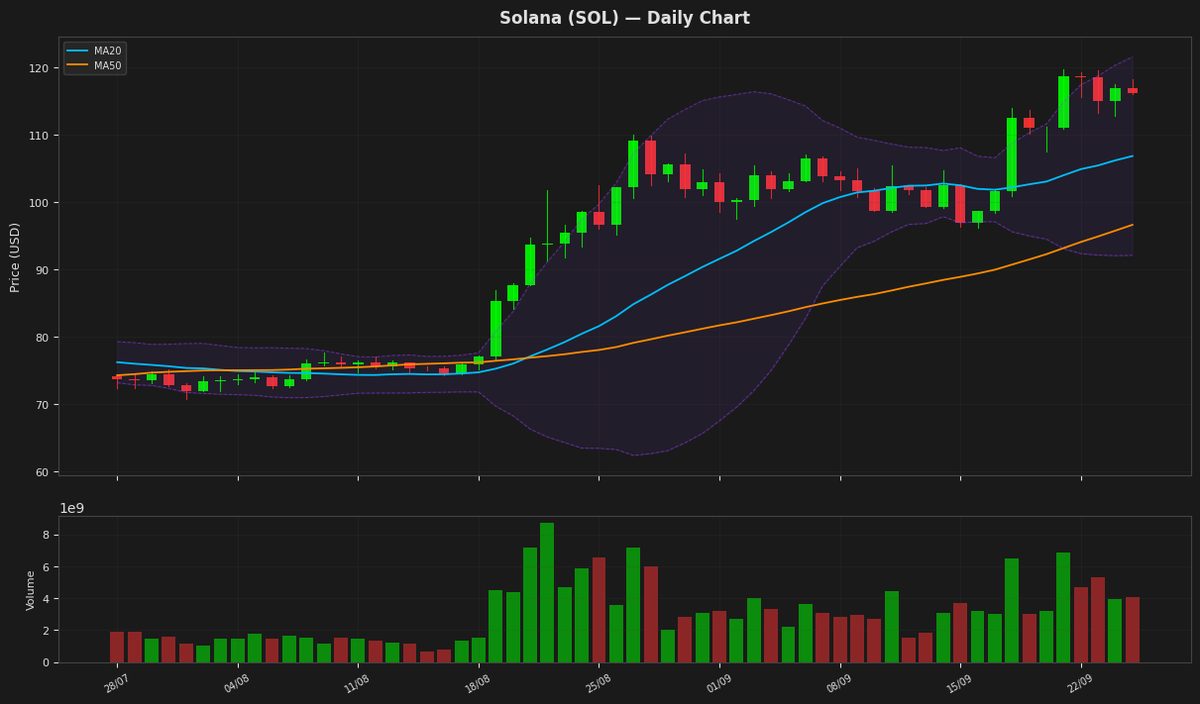
Solana's price is currently at $116.15, showing a minor decline of 0.73% and trading above both its MA20 and MA50, indicating a bullish trend. The RSI is at 65.73, nearing overbought territory, while the MACD is above its signal line, suggesting continued upward momentum. The price is also near the upper Bollinger Band at $121.61, indicating potential resistance.
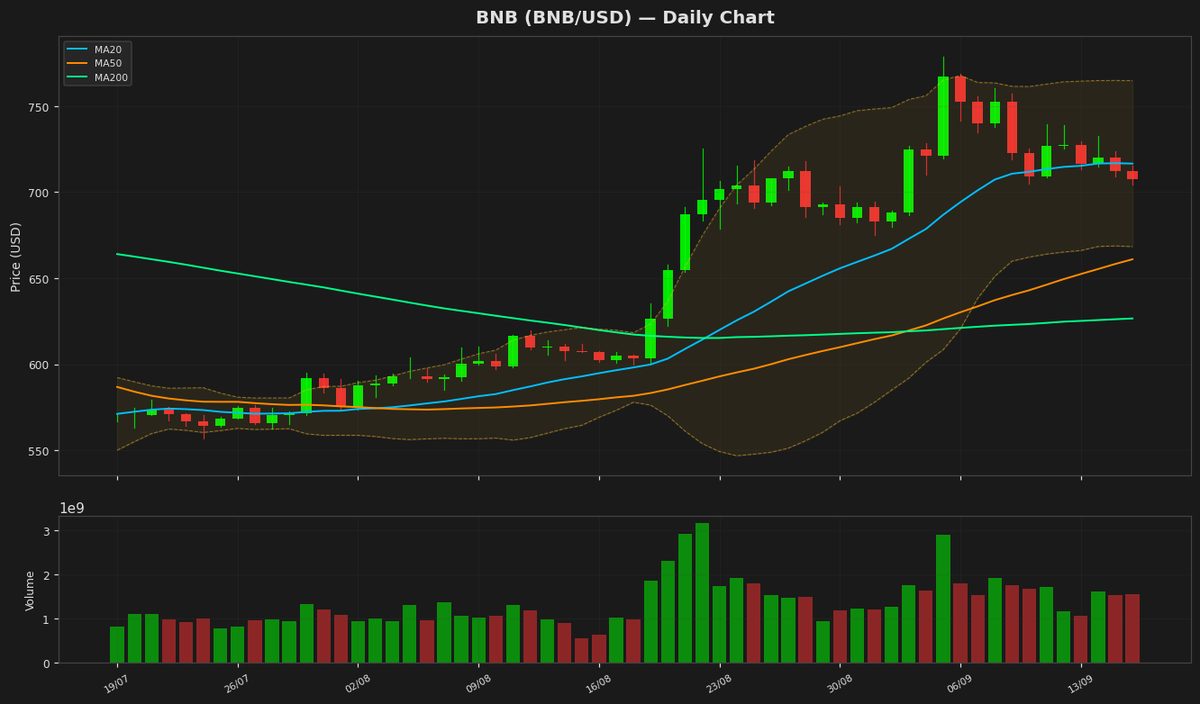
BNB (BNB) — -0.43%
$773.1400 52W: $538.5992 — $954.8583
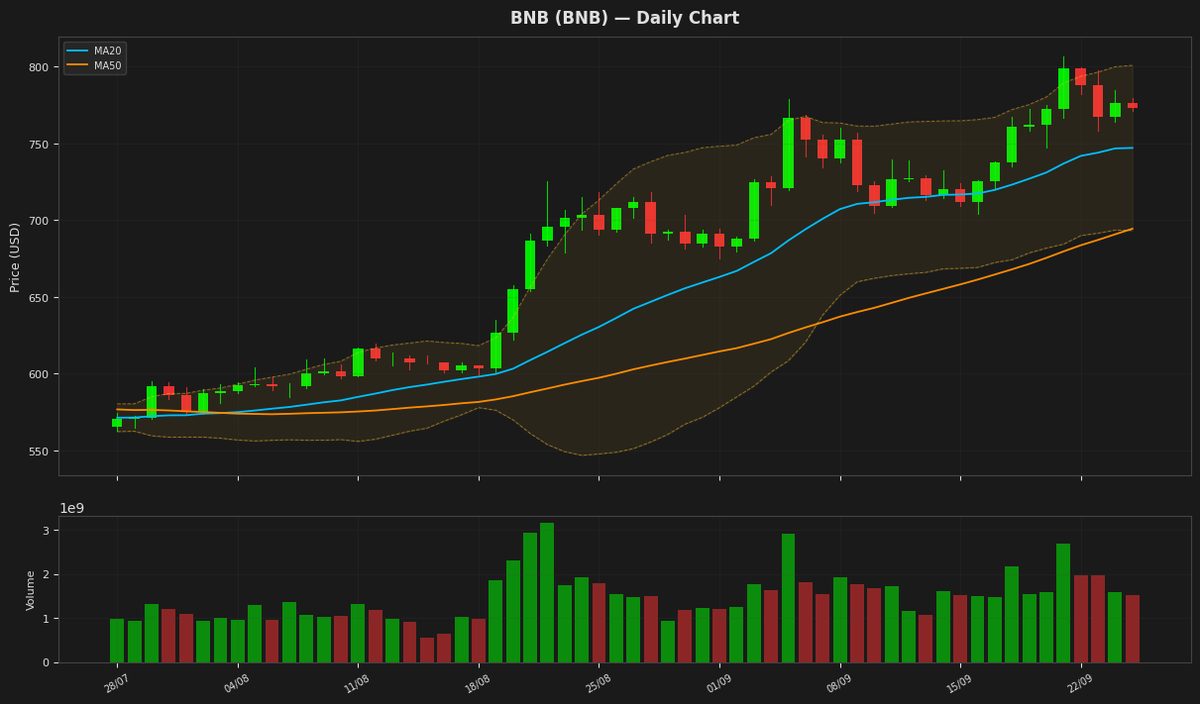
BNB is currently trading at $773.14, slightly below the upper Bollinger Band at $800.93, indicating a potential resistance level. The RSI is at 64.94, suggesting the asset is nearing overbought territory, while the MACD is above its signal line, indicating a bullish signal. The price is also above both the MA20 and MA50, further supporting a positive trend.
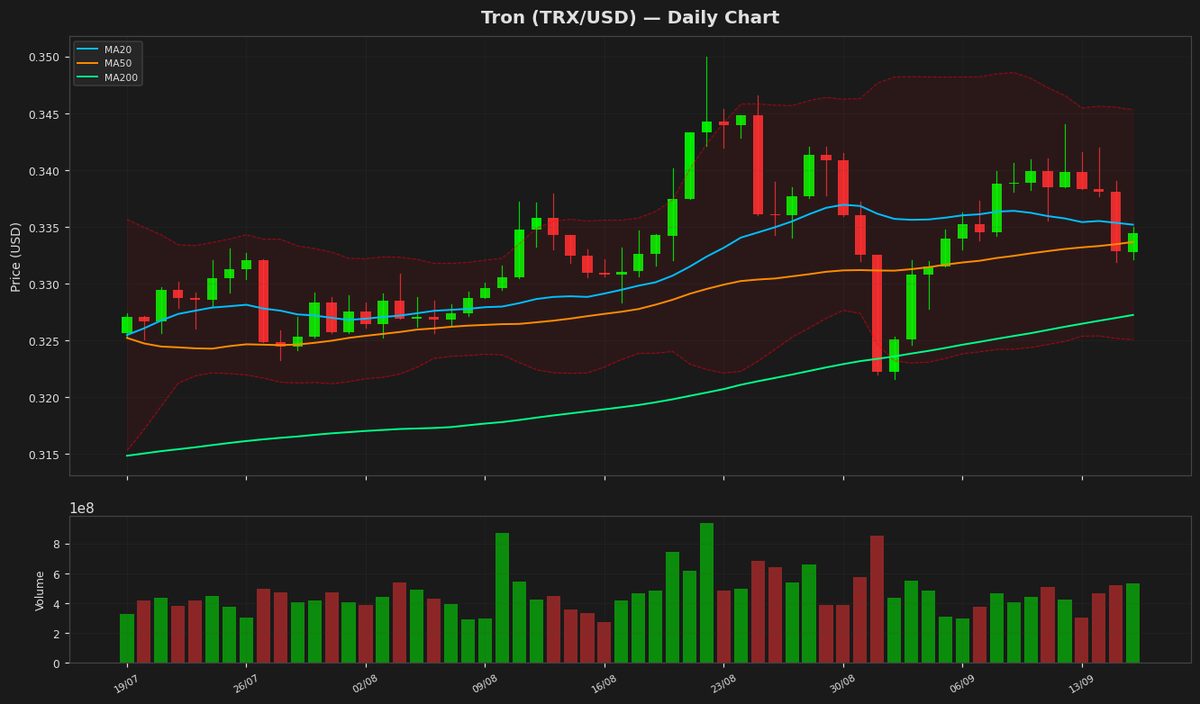
Tron (TRX) — -0.45%
$0.338599 52W: $0.268138 — $0.376332
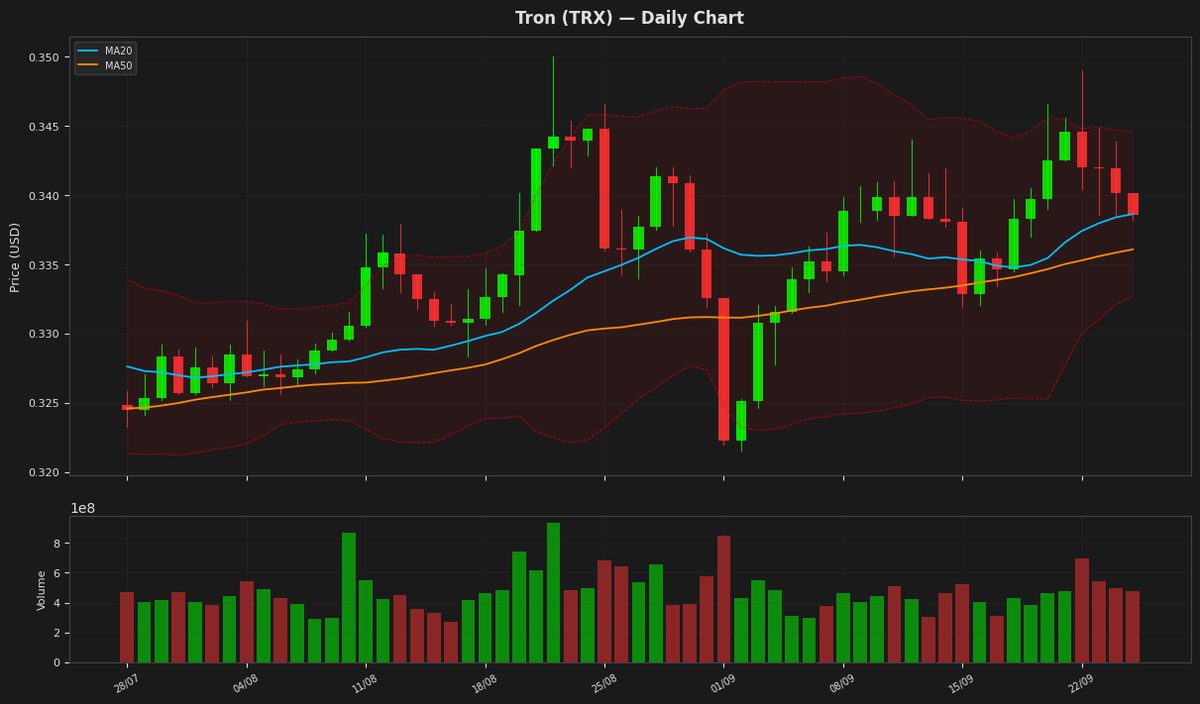
Tron's price is currently at $0.338599, showing a minor decline of 0.45% and hovering around its MA20 at 0.338631, indicating a lack of strong directional momentum. The RSI is at 50.210304, suggesting a neutral stance, while the MACD is above its signal line, hinting at a potential bullish crossover. The price is also within the Bollinger Bands, with the upper and lower bands at 0.344582 and 0.332679 respectively, indicating moderate volatility.
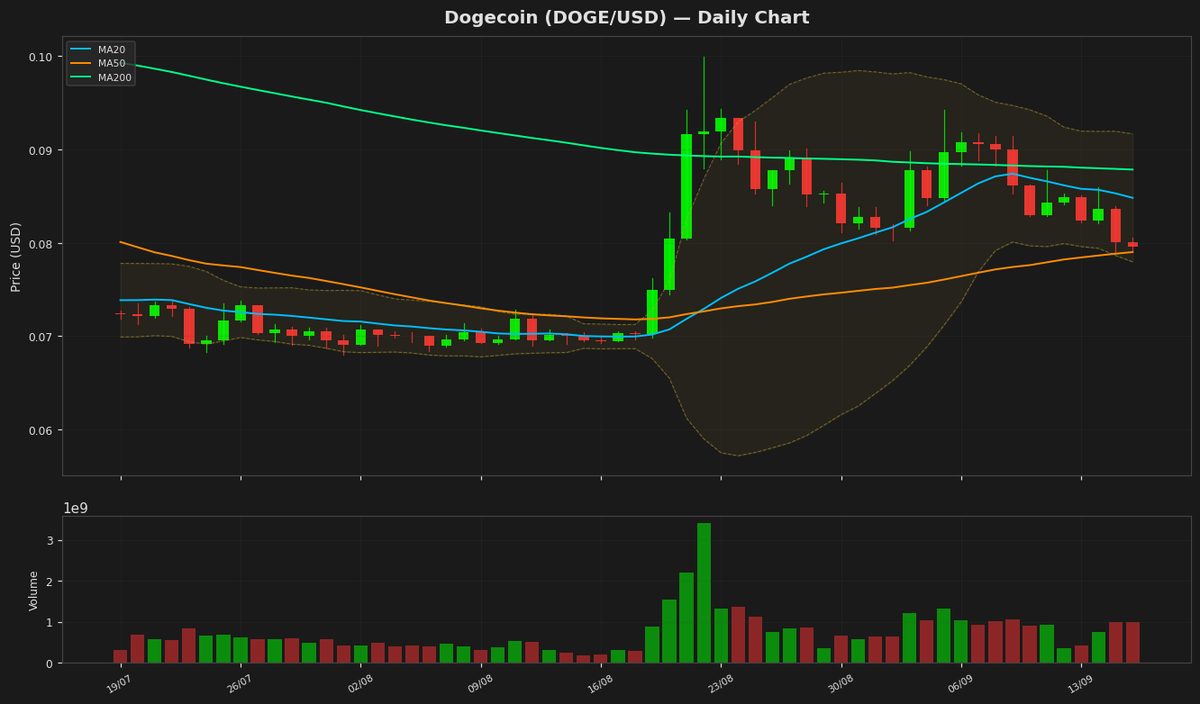
Dogecoin (DOGE) — -0.63%
$0.095150 52W: $0.067973 — $0.139742
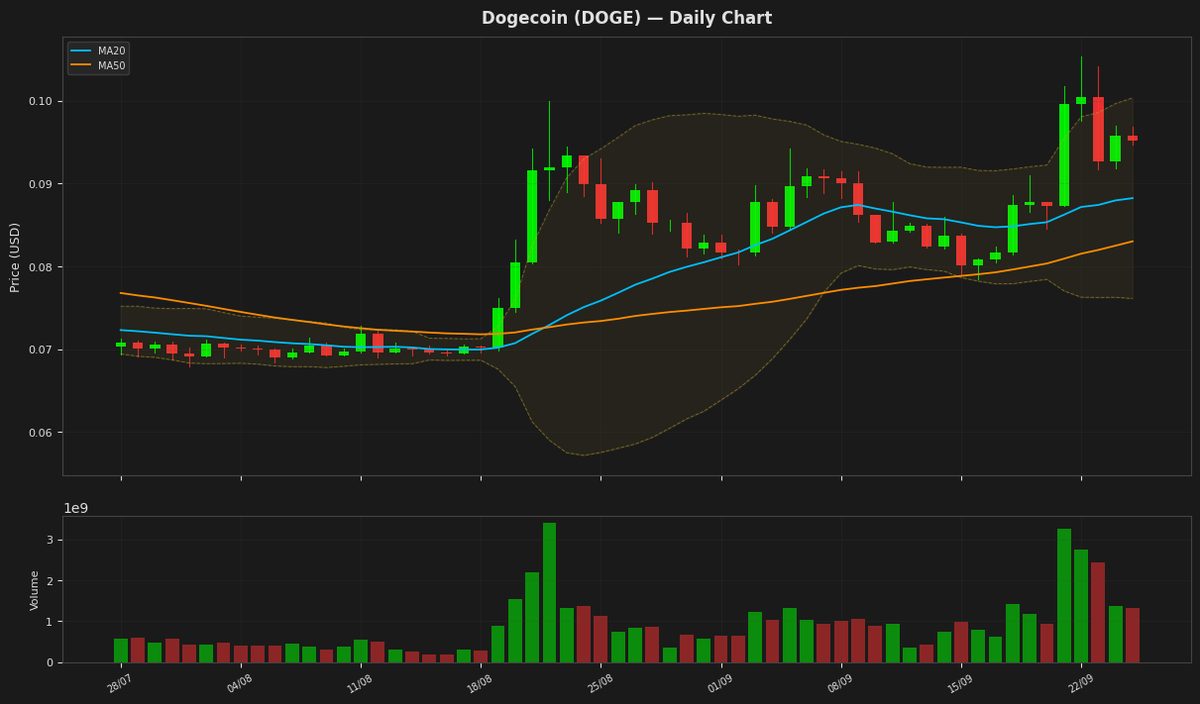
Dogecoin's price is currently at $0.095150, showing a slight decline of 0.63% for the day, yet it remains above both its MA20 and MA50, indicating a generally positive trend. The RSI is at 63.49, suggesting the cryptocurrency is nearing overbought territory but still has room to maneuver. The MACD is above its signal line, indicating a potential bullish signal. The price is also within the Bollinger Bands, with the upper band at $0.100326 and the lower band at $0.076111.
Disclaimer
The content on MarketsFN.com is provided for educational and informational purposes only. It does not constitute financial advice or investment recommendations. All investments involve risk. Past performance does not guarantee future results.