Crypto Market Slumps: Ripple, Solana, and Bitcoin Lead the Losses Today
QuoteReporter
•5 min read
Crypto Market Slumps: Ripple, Solana, and Bitcoin Lead the Losses Today
Crypto Market Report | September 15, 2026
📊 Crypto Market Overview
The cryptocurrency market is experiencing a downturn today, with most major assets trading in the red. Bitcoin, the largest cryptocurrency by market capitalization, has seen its value decline by 1.72% to $76,818.65, while Ethereum has dropped by 1.71% to $2,471.47. Other notable cryptocurrencies, such as Ripple, Solana, and Dogecoin, have also seen declines of between 1.50% and 2.47%. BNB and Tron are among the few exceptions, with Tron being the most resilient, down only 0.13%.
From a technical perspective, the Relative Strength Index (RSI) for most major cryptocurrencies is currently in neutral territory, with Bitcoin's RSI at 47.9 and Ethereum's at 54.9. The Moving Average Convergence Divergence (MACD) indicator is positive for most major assets, suggesting that the longer-term trend remains bullish. Notably, Tron's RSI is significantly elevated at 82.0, indicating overbought conditions.
The macro context continues to be influenced by regulatory developments, with the CLARITY Act being debated in the US Senate. The odds of the act passing have fallen to 16% as key Democrats resist the GOP's 'final' offer. The crypto industry is also reacting to news that CoinEx will cease operations after nine years, citing significant crypto contraction. Meanwhile, Kraken has announced plans to bring DeFi yield to tokenized stocks and ETFs. The XRP Ledger is on the verge of a significant upgrade, being just one vote away from implementing its next big payments upgrade. Overall, the market sentiment remains cautious, with investors closely watching regulatory developments and industry news.
From a technical perspective, the Relative Strength Index (RSI) for most major cryptocurrencies is currently in neutral territory, with Bitcoin's RSI at 47.9 and Ethereum's at 54.9. The Moving Average Convergence Divergence (MACD) indicator is positive for most major assets, suggesting that the longer-term trend remains bullish. Notably, Tron's RSI is significantly elevated at 82.0, indicating overbought conditions.
The macro context continues to be influenced by regulatory developments, with the CLARITY Act being debated in the US Senate. The odds of the act passing have fallen to 16% as key Democrats resist the GOP's 'final' offer. The crypto industry is also reacting to news that CoinEx will cease operations after nine years, citing significant crypto contraction. Meanwhile, Kraken has announced plans to bring DeFi yield to tokenized stocks and ETFs. The XRP Ledger is on the verge of a significant upgrade, being just one vote away from implementing its next big payments upgrade. Overall, the market sentiment remains cautious, with investors closely watching regulatory developments and industry news.
📰 Crypto News
- Solana more than triples transaction size limit with mainnet upgrade
- Here’s what happened in crypto today
- CLARITY Act odds fall to 16% as key Democrats resist GOP’s ‘final’ offer
- CoinEx to cease operation after 9 years, citing ‘significant’ crypto contraction
- Balancer eyes wind-down after restructuring fails to revive revenue
- Democrats push back on GOP’s ‘final’ CLARITY offer with counterproposal: Politico
- Kraken brings DeFi yield to tokenized stocks and ETFs
- Live updates: Bitcoin slides from nearly $80,000 as Senate votes on Clarity Act
- XRP Ledger is one vote away from starting its next big payments upgrade
- U.S. DOJ seeks $61 million in what it calls Iran's crypto-laundered black market oil sales
- Solana transactions just got more than 3 times bigger, narrowing the gap with Ethereum
- Democrats send counteroffer to Republicans over Clarity Act provisions
- U.S. House panel shares crypto tax bill ahead of hearing later this week
- Bitcoin slips to $77,800 as Senate Clarity Act vote nears and oil prices climb
- Even if Clarity fails, Wall Street’s crypto push is unlikely to stop
🔍 Technical Analysis
Bitcoin (BTC) — -1.72%
$76,818.65 52W: $57,747.77 — $97,860.60
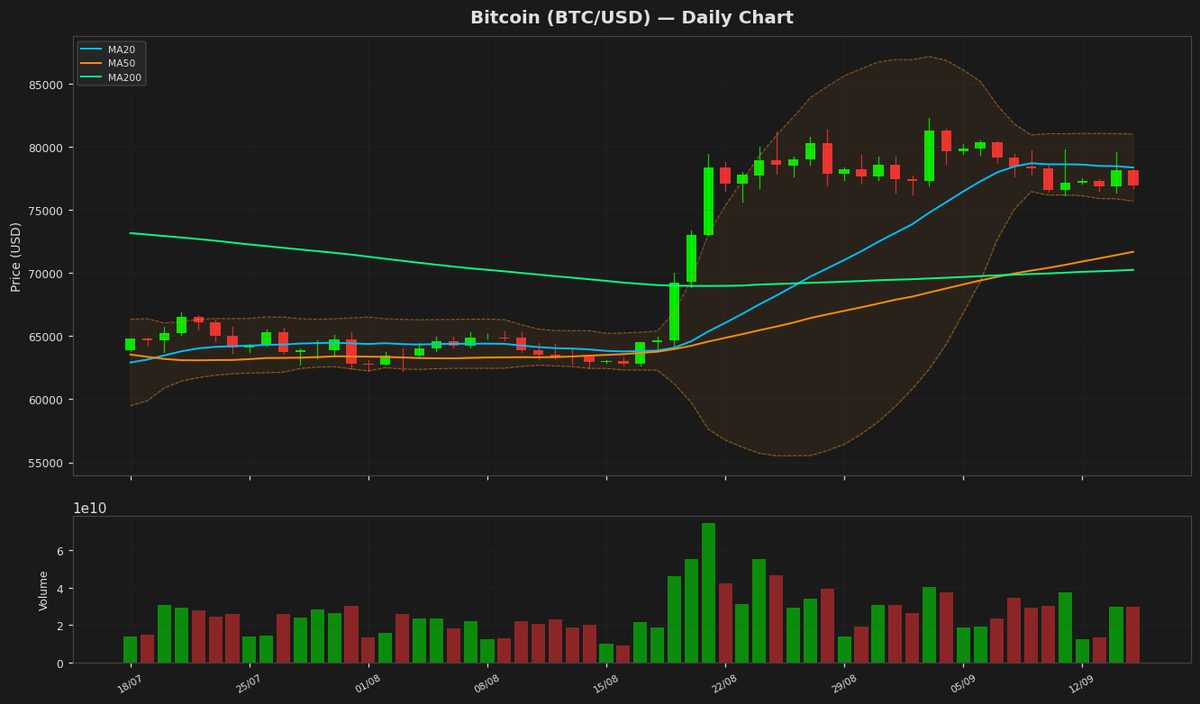
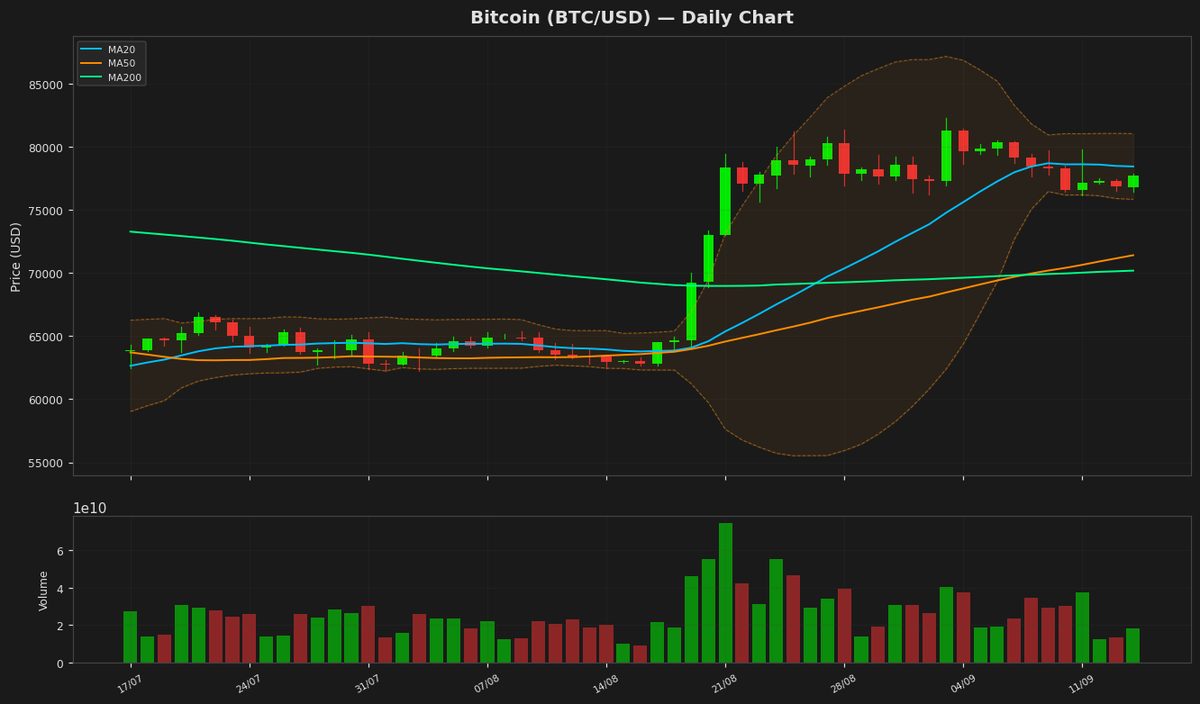
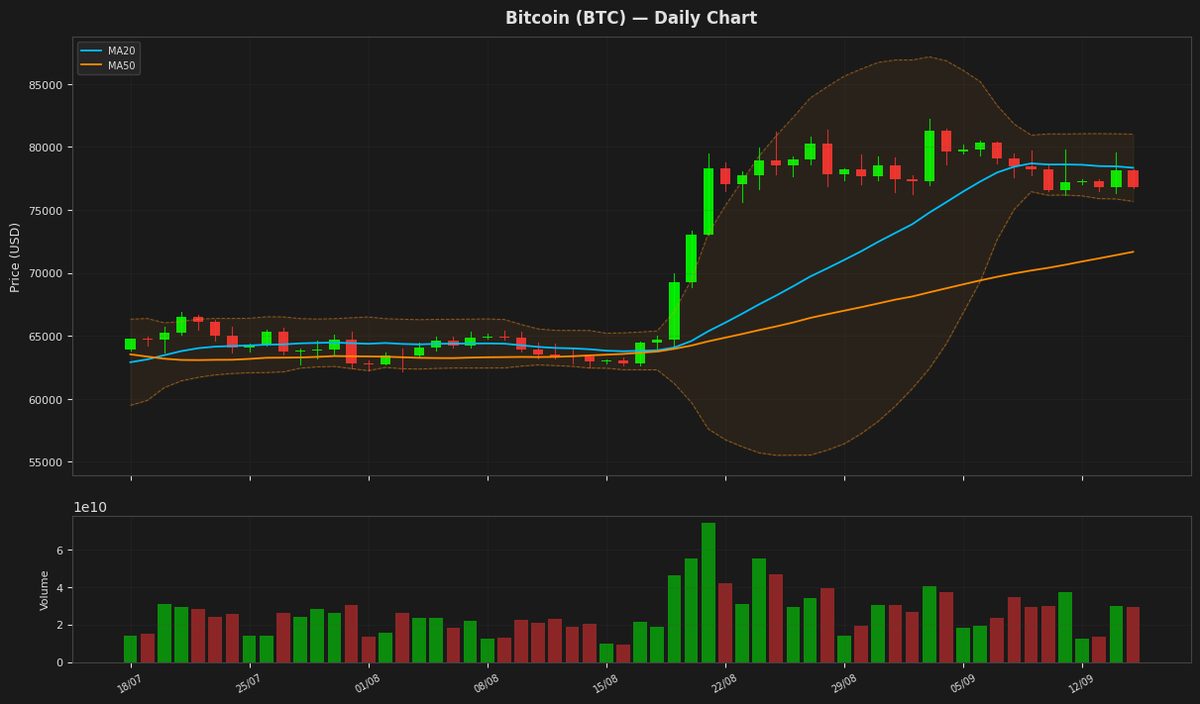
Bitcoin's price is currently at $76,818.65, showing a daily decline of 1.72% as it consolidates around the MA20 at $78,350.91. The RSI(14) at 47.90 indicates a neutral stance, while the MACD below its signal line suggests a potential bearish trend. The price is near the lower Bollinger Band at $75,680.58, indicating potential support.
Ethereum (ETH) — -1.71%
$2,471.47 52W: $1,506.51 — $3,397.90
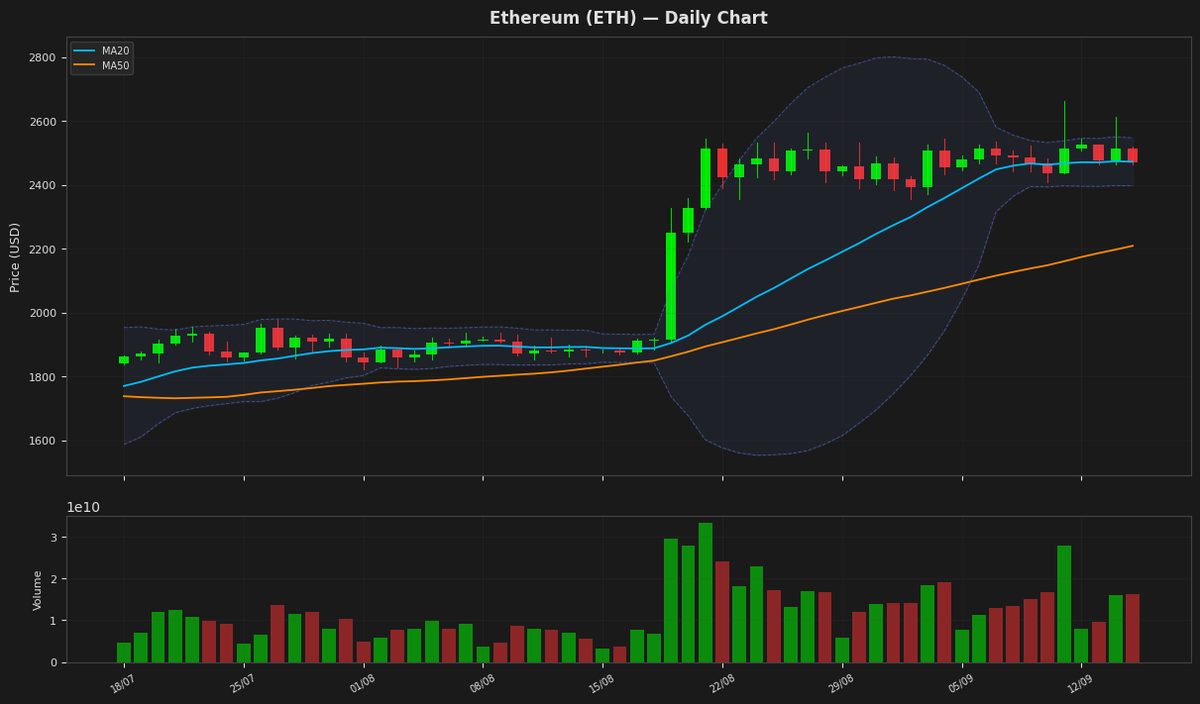
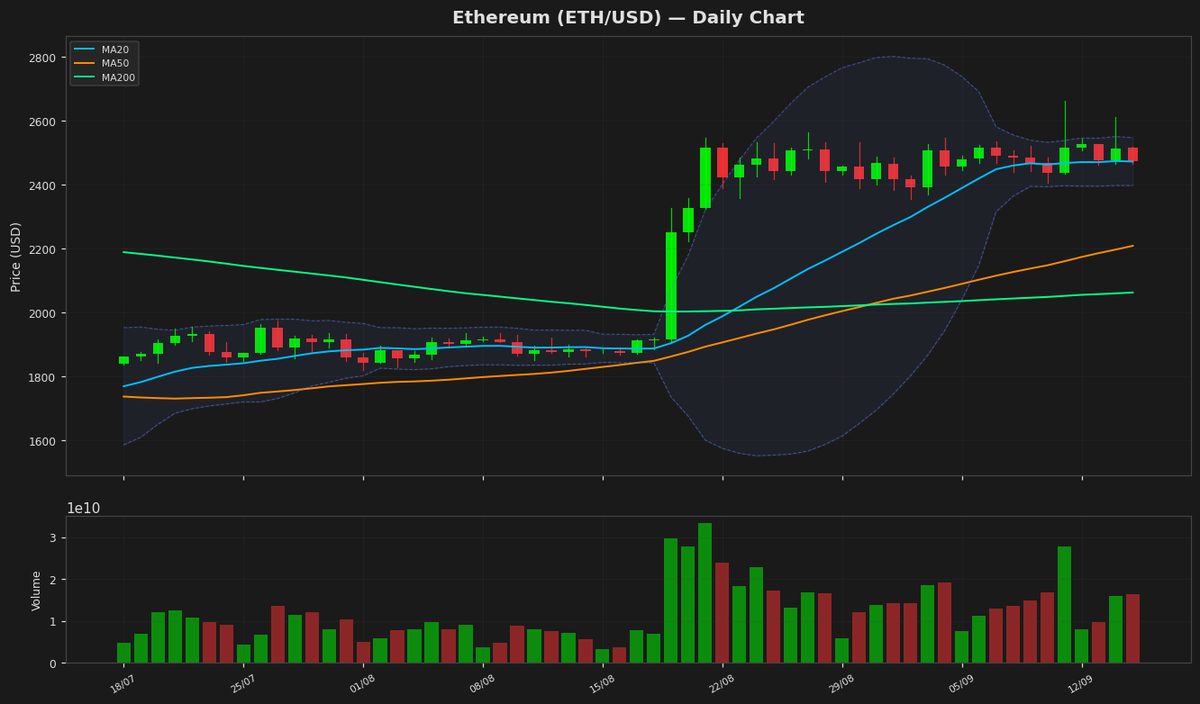
Ethereum is currently trading at $2,471.47, near its 20-day moving average of $2,472.38, indicating a lack of clear direction. The RSI at 54.89 suggests a neutral market sentiment, while the MACD below its signal line indicates a potential bearish trend. The price is also within the Bollinger Bands, with the upper and lower bands at $2,547.32 and $2,397.44 respectively, indicating moderate volatility.
Ripple (XRP) — -2.47%
$1.3859 52W: $0.988422 — $2.3167
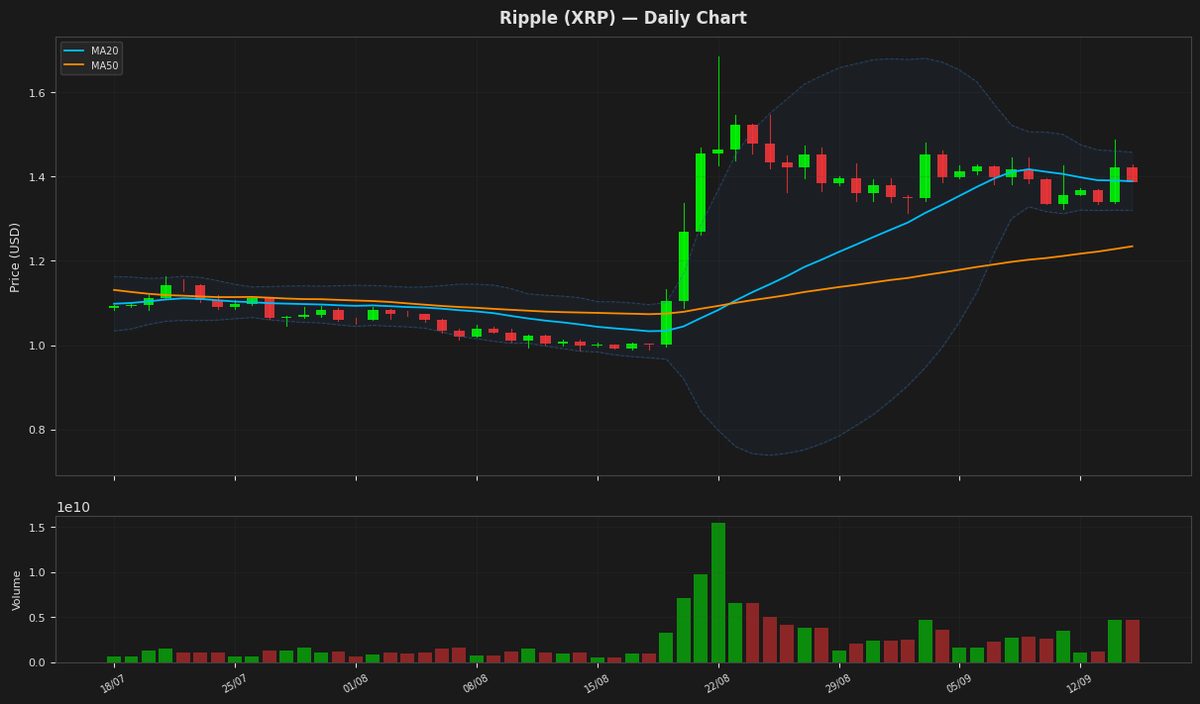
Ripple's price is currently at $1.385900, showing a minor decline of 2.47% and is hovering around the MA20 at 1.388627, indicating a lack of strong directional momentum. The RSI at 53.593391 suggests a neutral market sentiment, while the MACD below its signal line indicates a potential bearish crossover. The price is also within the Bollinger Bands, with the upper and lower bands at 1.457385 and 1.319869 respectively, indicating moderate volatility.
Solana (SOL) — -2.19%
$100.2500 52W: $60.4147 — $148.2160
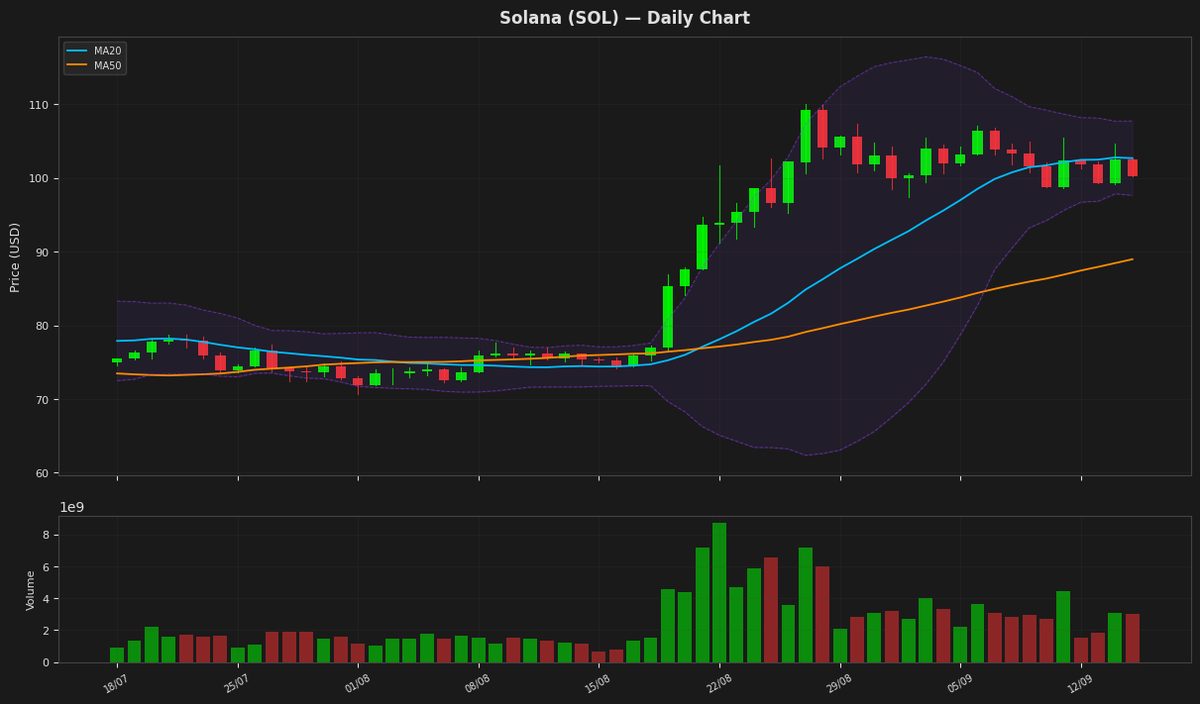
Solana's price is currently at $100.25, showing a decline of 2.19% for the day, and is positioned near the lower end of its recent trading range, with the Bollinger Band lower boundary at $97.63. The RSI is at 50.43, indicating a neutral stance, while the MACD is below its signal line, suggesting a potential bearish trend. The Average True Range indicates moderate volatility.
BNB (BNB) — -0.59%
$715.9800 52W: $538.5992 — $954.8583
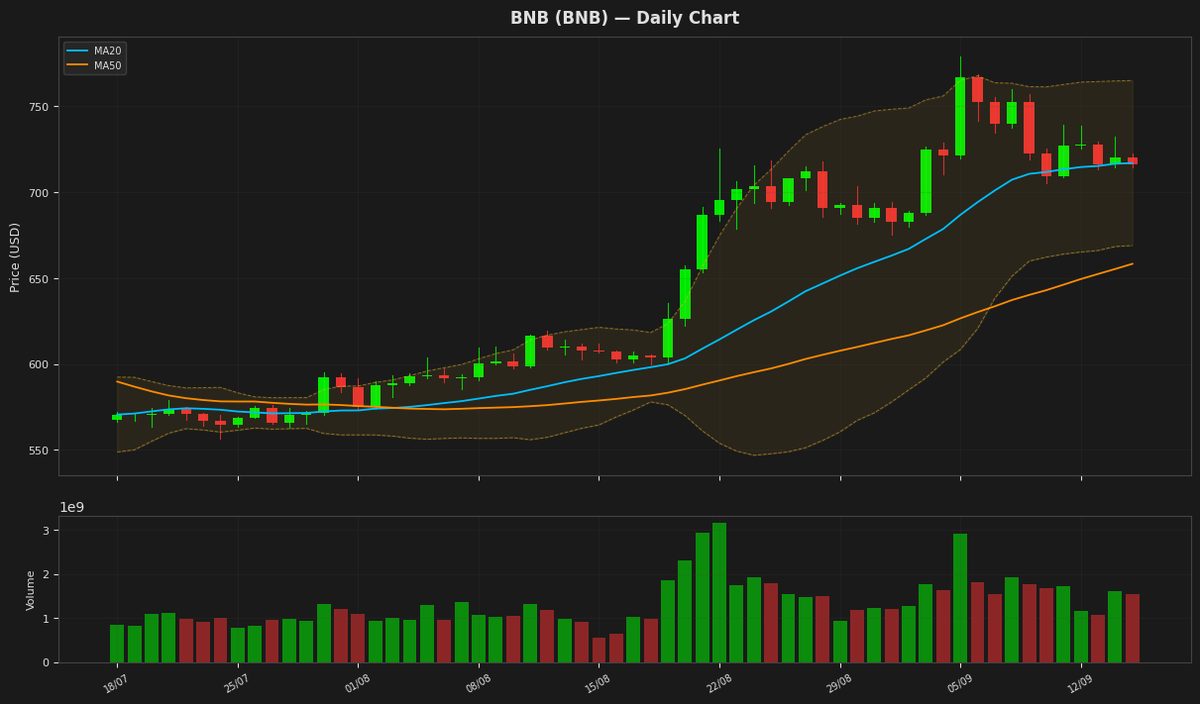
BNB is currently trading at $715.98, slightly below its 20-day moving average of $716.97, indicating a neutral short-term trend. The Relative Strength Index (RSI) at 57.84 suggests a moderate bullish momentum, while the MACD below its signal line indicates a potential bearish crossover. The price is also within the Bollinger Bands, with the upper and lower bands at $764.98 and $668.96 respectively, indicating a relatively stable volatility.
Tron (TRX) — -0.13%
$0.337638 52W: $0.268138 — $0.376332
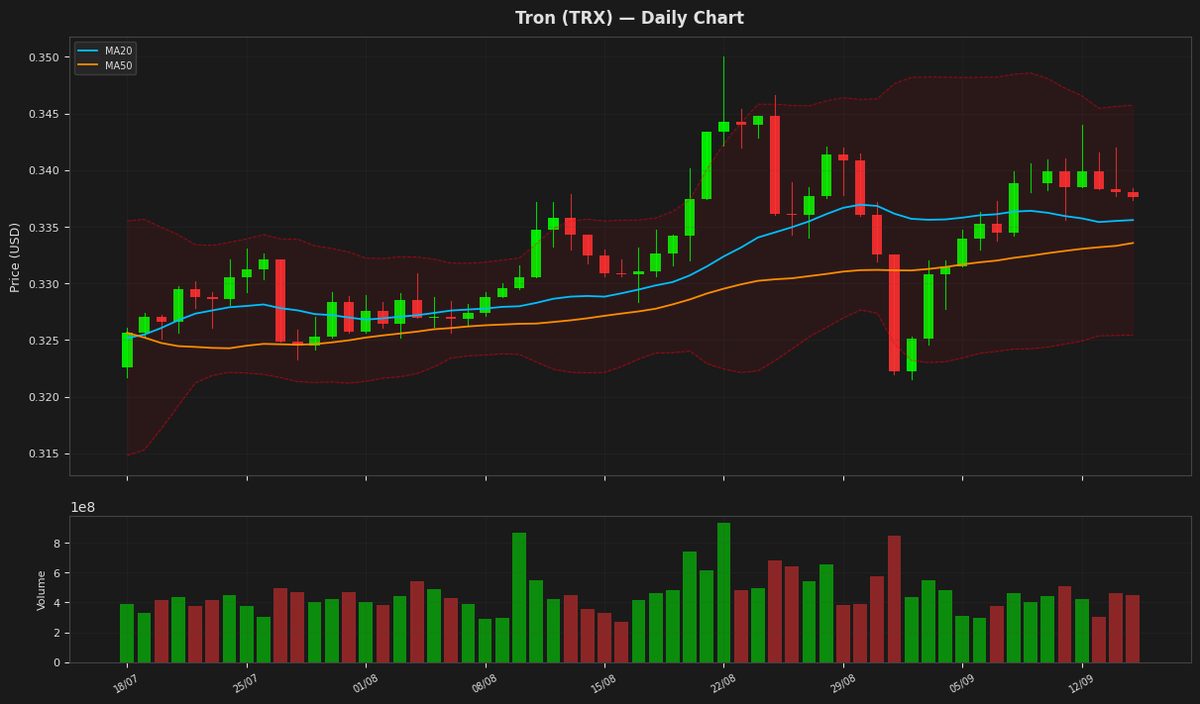
Tron's price is currently at $0.337638, showing a marginal decline of 0.13%. The RSI is at 81.95, indicating overbought conditions, while the MACD is above its signal line, suggesting a potential continuation of the uptrend. The price is near the upper Bollinger Band at $0.34574, which may act as a resistance level. The ATR indicates low volatility.
Dogecoin (DOGE) — -1.50%
$0.082380 52W: $0.067973 — $0.153616
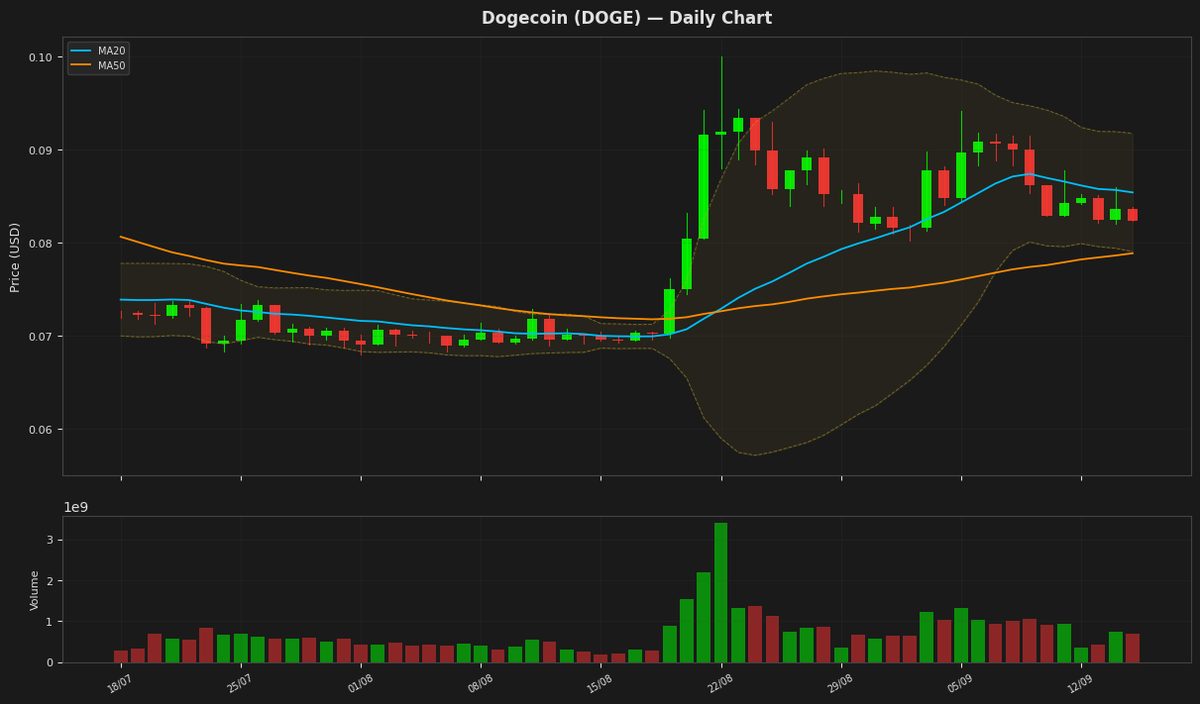
Dogecoin's price is currently at $0.082380, showing a minor decline, and is positioned between its 20-day and 50-day moving averages, indicating a potential consolidation phase. The Relative Strength Index is near neutral at 51.23, while the MACD is below its signal line, suggesting a lack of strong momentum. The Bollinger Bands indicate that the price is relatively central within the recent trading range.
Disclaimer
The content on MarketsFN.com is provided for educational and informational purposes only. It does not constitute financial advice or investment recommendations. All investments involve risk. Past performance does not guarantee future results.