Crypto Market Slumps: Ripple, Bitcoin, and Solana Lead Top Losers Today
QuoteReporter
•5 min read
Crypto Market Slumps: Ripple, Bitcoin, and Solana Lead Top Losers Today
Crypto Market Report | September 01, 2026
📊 Crypto Market Overview
The cryptocurrency market is currently characterized by a mixed sentiment, with major assets experiencing minor declines. Bitcoin is trading at $77,893.39, down 0.83% on the day, while other top cryptocurrencies such as Ethereum, Ripple, and Solana are also seeing slight decreases. The Relative Strength Index (RSI) for Bitcoin stands at 77.7, indicating a potentially overbought condition, while its MACD is at 3625.98. Similar RSI readings are observed for Ethereum (75.5), Solana (75.9), and BNB (74.5), suggesting that these assets may be due for a correction.
Recent news has been dominated by developments in the institutional investment space, with BlackRock driving a $217 million rebound in Bitcoin ETF flows. Additionally, the London Stock Exchange is set to collaborate with Payward to bring major UK stocks onchain. The fundraising landscape is also active, with 1789 Capital, a firm linked to Donald Trump Jr., reportedly leading a $1 billion raise for Polymarket.
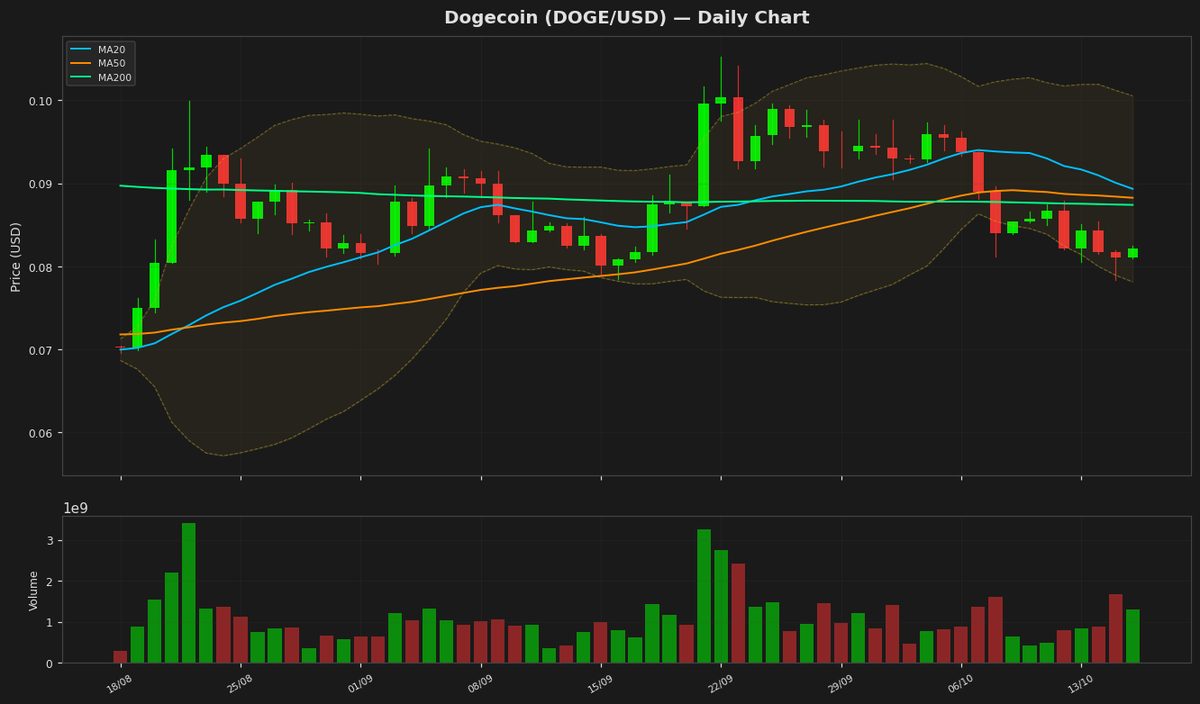
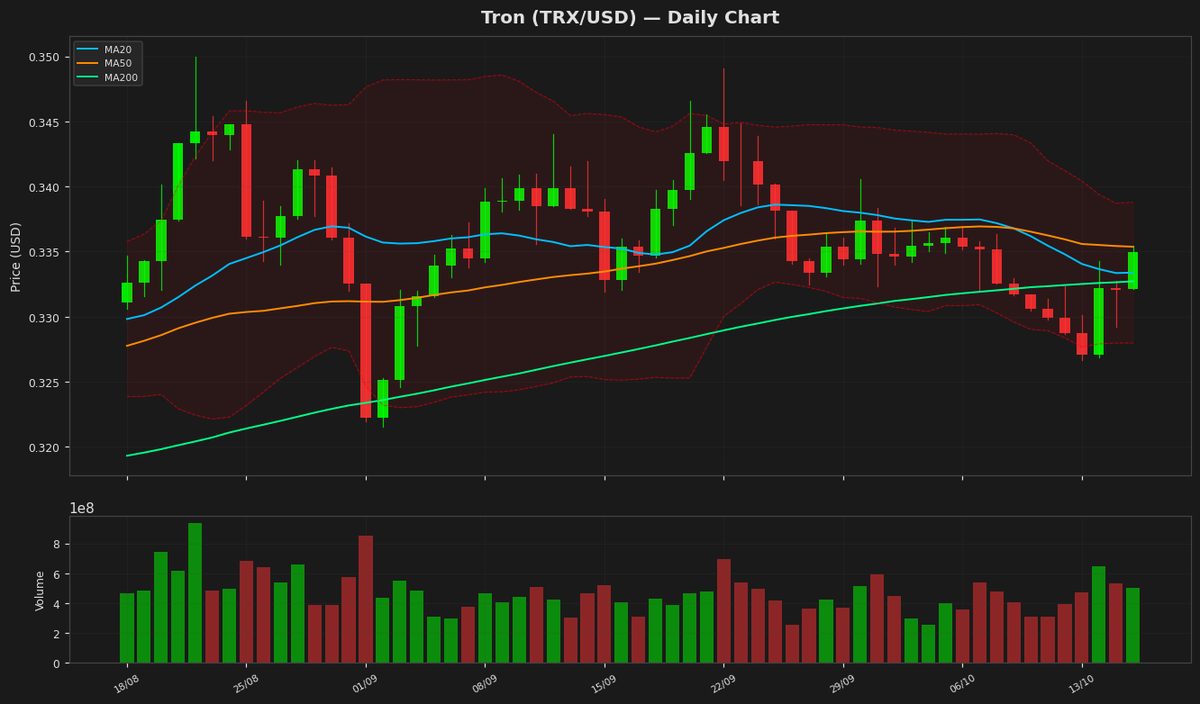
Macroeconomic factors continue to influence the market, with hawkish Federal Reserve bets contributing to a slight downturn in major cryptocurrencies. Meanwhile, altcoin funds are continuing to see inflows. Notable technical signals include the RSI and MACD readings for various assets, with Tron and Dogecoin appearing less stretched compared to other major cryptocurrencies. The RSI for Tron is at 47.9, and its MACD is at 0.0012, while Dogecoin's RSI is at 64.3, and its MACD is at 0.0031. The market is also seeing activity from institutional players, with CME's share of XRP futures increasing as the token rallies. Overall, the market is experiencing a period of consolidation, with various factors influencing sentiment and asset prices.
Recent news has been dominated by developments in the institutional investment space, with BlackRock driving a $217 million rebound in Bitcoin ETF flows. Additionally, the London Stock Exchange is set to collaborate with Payward to bring major UK stocks onchain. The fundraising landscape is also active, with 1789 Capital, a firm linked to Donald Trump Jr., reportedly leading a $1 billion raise for Polymarket.
Macroeconomic factors continue to influence the market, with hawkish Federal Reserve bets contributing to a slight downturn in major cryptocurrencies. Meanwhile, altcoin funds are continuing to see inflows. Notable technical signals include the RSI and MACD readings for various assets, with Tron and Dogecoin appearing less stretched compared to other major cryptocurrencies. The RSI for Tron is at 47.9, and its MACD is at 0.0012, while Dogecoin's RSI is at 64.3, and its MACD is at 0.0031. The market is also seeing activity from institutional players, with CME's share of XRP futures increasing as the token rallies. Overall, the market is experiencing a period of consolidation, with various factors influencing sentiment and asset prices.
📰 Crypto News
- Trump Jr.-linked 1789 Capital leads Polymarket’s $1B raise: Report
- Here’s what happened in crypto today
- BlackRock drives $217M Bitcoin ETF rebound as altcoin funds continue streaks
- Thailand SEC proposes retail access to regulated overseas crypto derivatives
- London Stock Exchange to work with Payward to bring biggest UK stocks onchain
- OpenAI’s ‘Trust Us’ TIME cover raises an old warning for AI bulls
- Bitcoin steady above $78,000, HYPE leads as majors slip on hawkish Fed bets
- Trump Jr's firm leads $1 billion Polymarket raise at $21 billion value: Report
- CME’s share of XRP futures jumps as token rallies 40% in a week
- North Korean hackers are moving tens of millions on Hyperliquid as Trump pushes to onshore the crypto platform
- As Public Fury Mounts, Texas Pulls the Plug on Flock Surveillance Funding
- Strive Adds $143 Million in Bitcoin as Treasury Firms Pile Back In
🔍 Technical Analysis
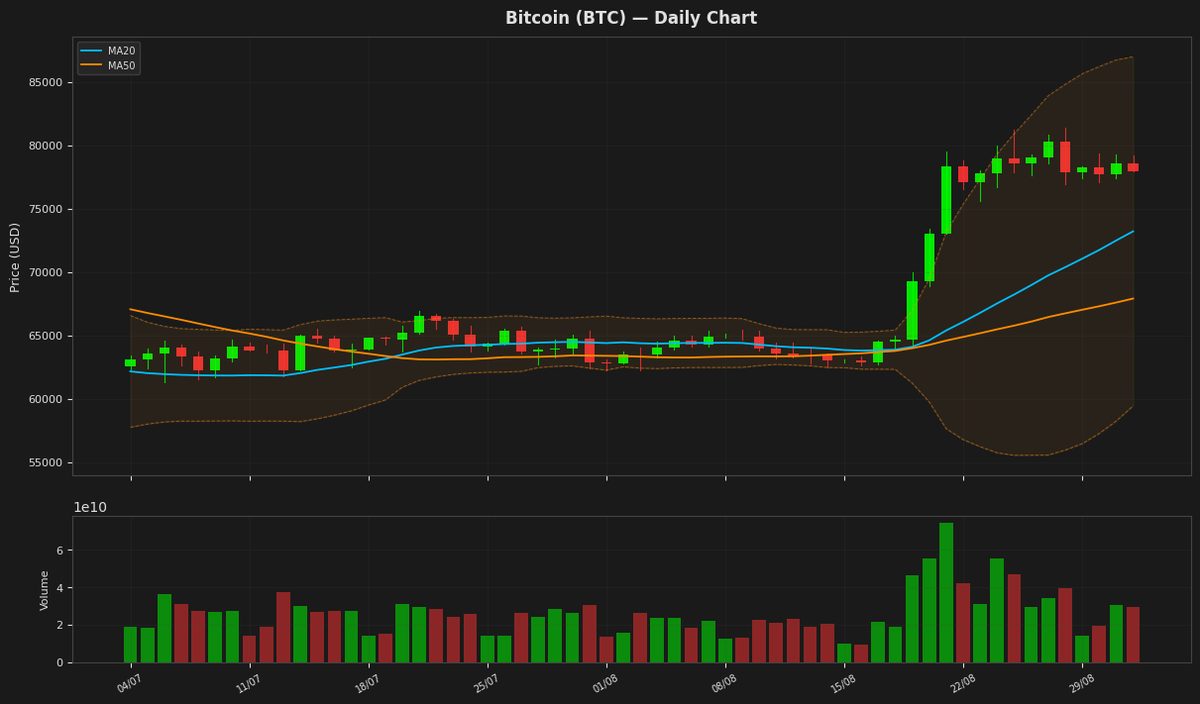
Bitcoin (BTC) — -0.83%
$77,893.39 52W: $57,747.77 — $97,860.60
Bitcoin is currently trading at $77,893.39, showing a slight decline of 0.83% for the day, and is positioned near its 20-day moving average of $73,194.03, indicating a relatively stable short-term trend. The RSI reading of 77.71 suggests that Bitcoin is in overbought territory, potentially setting up for a pullback. The MACD is above its signal line, indicating a bullish signal, but the proximity to the upper Bollinger Band at $86,966.55 may indicate resistance ahead.
Ethereum (ETH) — -0.75%
$2,448.40 52W: $1,506.51 — $3,397.90
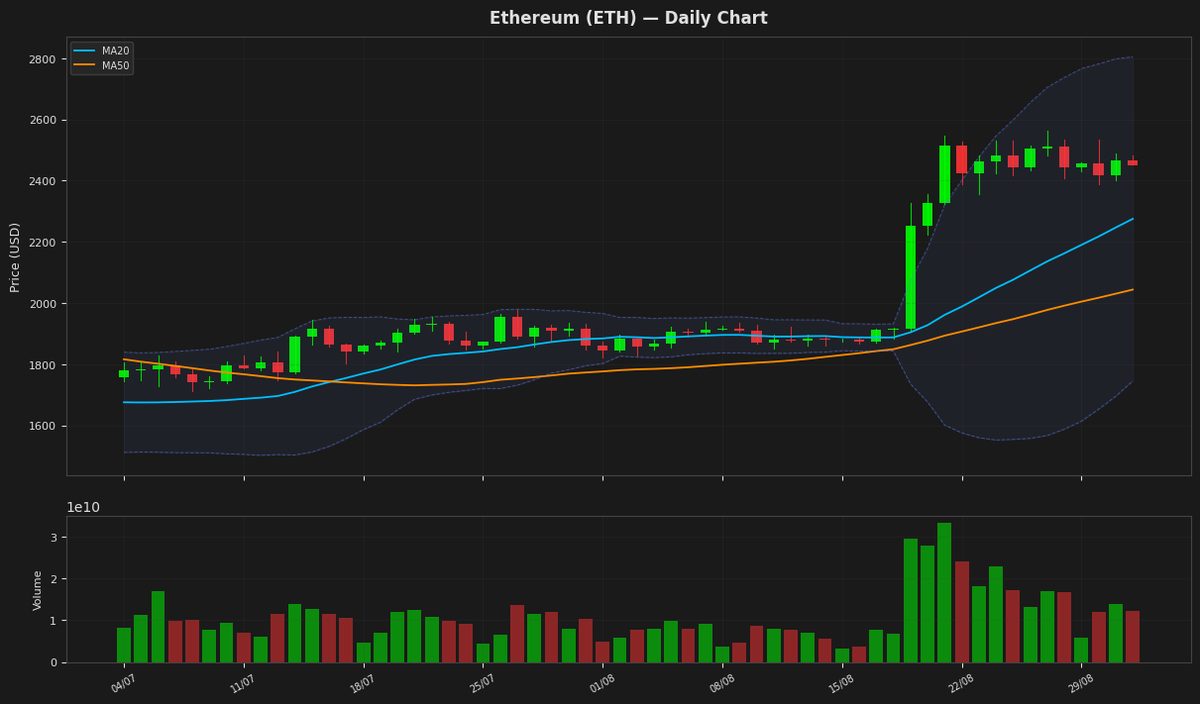
Ethereum is currently trading at $2,448.40 with a slight decline of 0.75% and is positioned near the upper end of its recent trading range, as indicated by an RSI of 75.49, suggesting it is overbought. The price is below the upper Bollinger Band at $2,804.82, but above the MA20 and MA50, indicating a strong uptrend. The MACD is slightly below its signal line, hinting at a potential slowdown in the upward momentum.
Ripple (XRP) — -1.16%
$1.3631 52W: $0.988422 — $2.4103
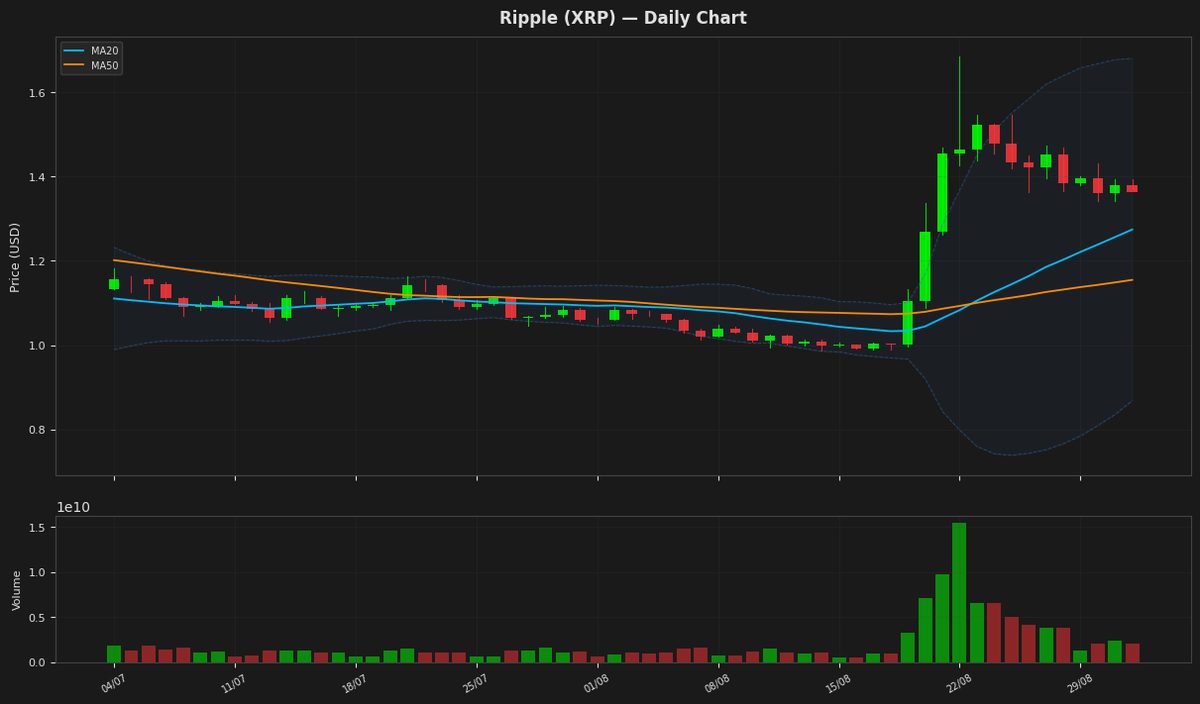
Ripple's price is currently at $1.363100, showing a slight decline, and is positioned above both its MA20 and MA50, indicating an overall uptrend. The RSI is at 72.404248, suggesting the asset is nearing overbought territory. The Bollinger Bands indicate that the price is still below the upper band at $1.680056, leaving room for further potential upside. The MACD is slightly below its signal line, hinting at a possible slowdown in the upward momentum.
Solana (SOL) — -0.83%
$102.1400 52W: $60.4147 — $148.2160
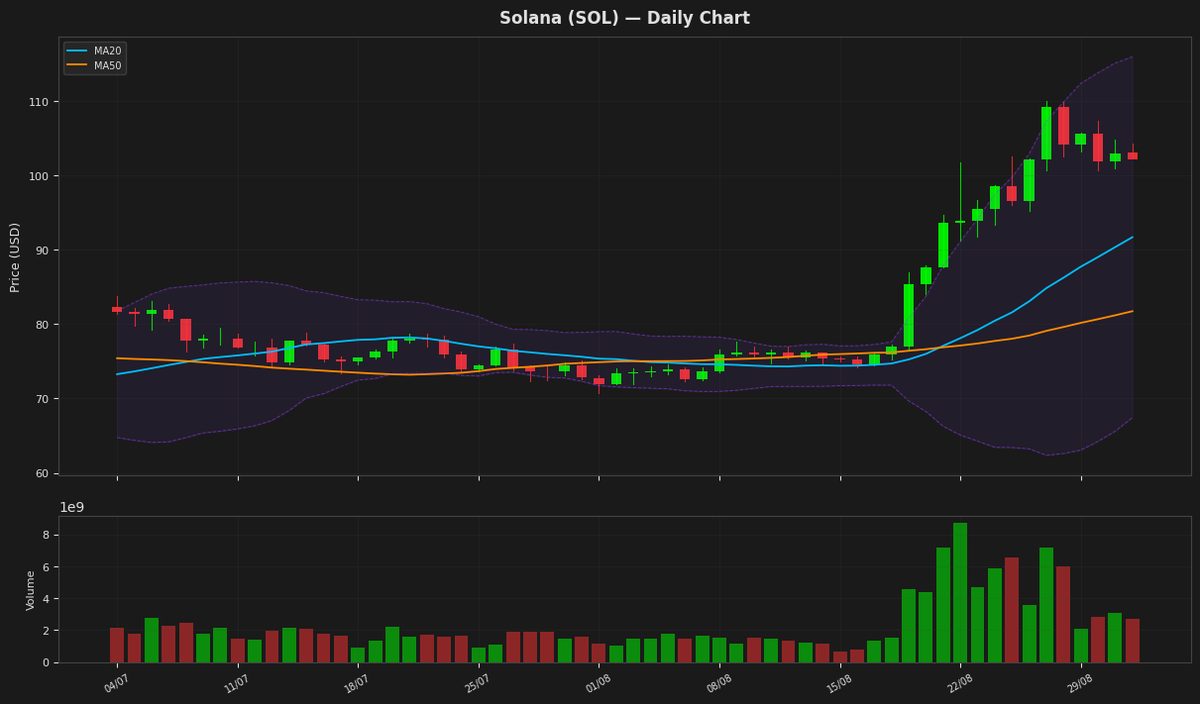
Solana's price is currently at $102.14, showing a minor decline of 0.83% and is trading above both its MA20 at $91.68 and MA50 at $81.73, indicating an overall uptrend. The RSI is at 75.91, suggesting the asset is nearing overbought territory. The MACD is above its signal line, indicating a bullish signal. The price is also below the upper Bollinger Band at $115.93, leaving room for further potential upside.
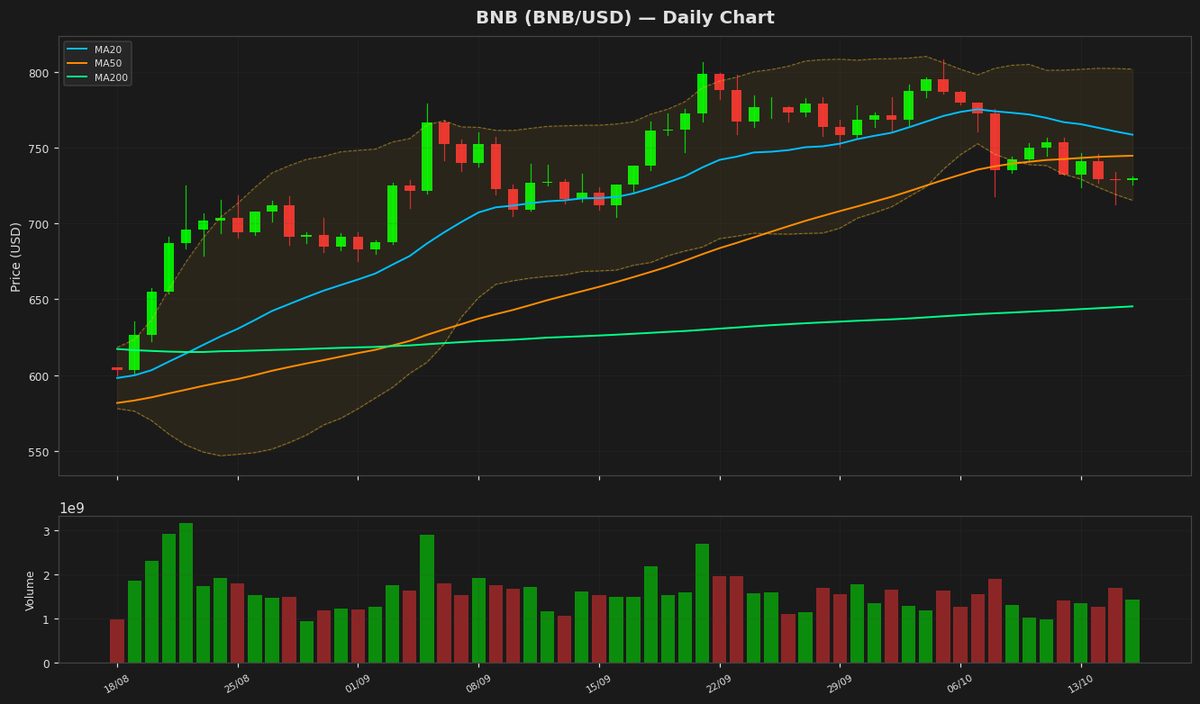
BNB (BNB) — -0.66%
$686.4600 52W: $538.5992 — $954.8583
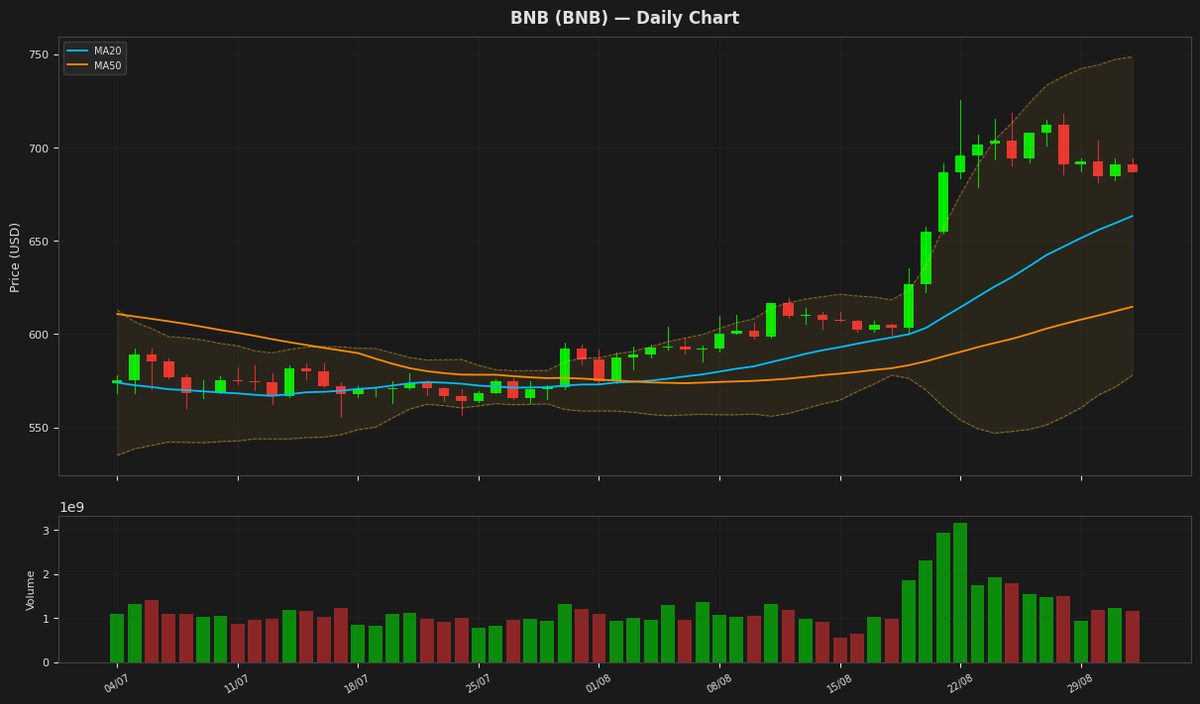
BNB is currently trading at $686.46, with its price nearing the upper Bollinger Band at $748.65, indicating potential overbought conditions, as also suggested by the RSI(14) value of 74.54. The MACD is slightly below its signal line, hinting at a possible reversal. The short-term trend remains bullish as the price is above both MA20 and MA50.
Tron (TRX) — -0.45%
$0.331052 52W: $0.268138 — $0.376332
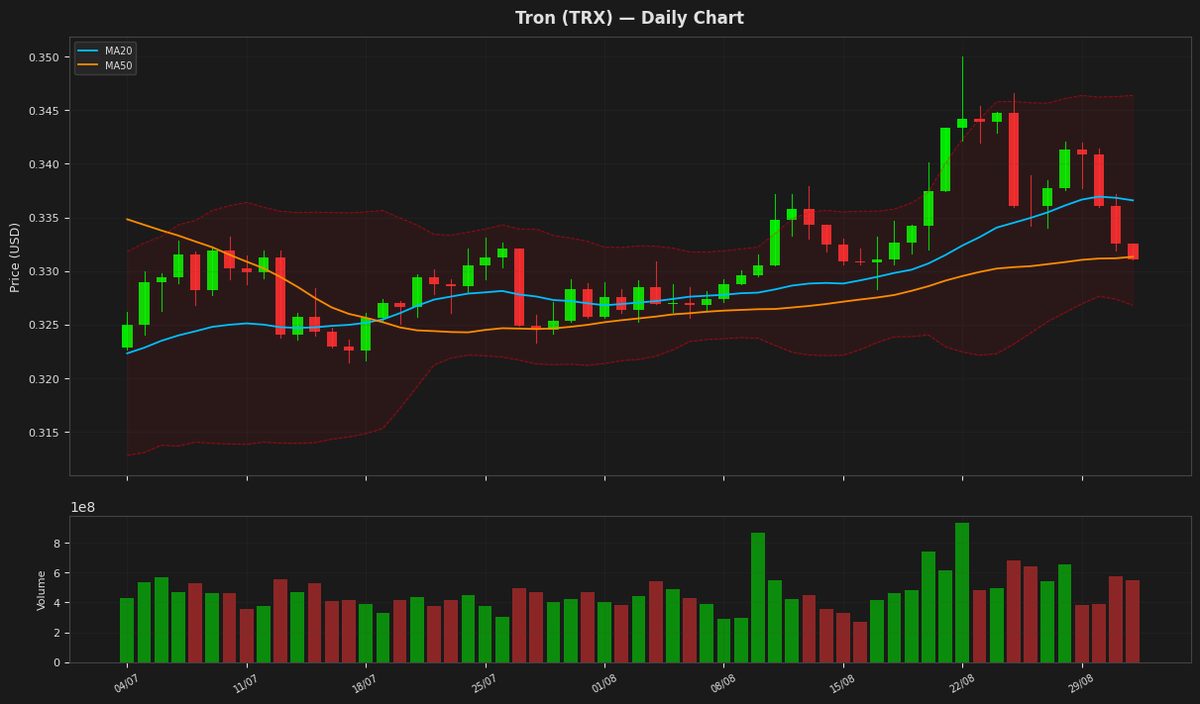
Tron's price is currently at $0.331052, showing a slight decline of 0.45% in a day, and is positioned near the middle of the Bollinger Bands, indicating a lack of strong directional momentum. The RSI is at 47.87, suggesting a neutral stance. The MACD is below its signal line, indicating a potential bearish trend. The price is also below both MA20 and close to MA50, indicating a possible consolidation phase.
Dogecoin (DOGE) — -0.49%
$0.082410 52W: $0.067973 — $0.156091
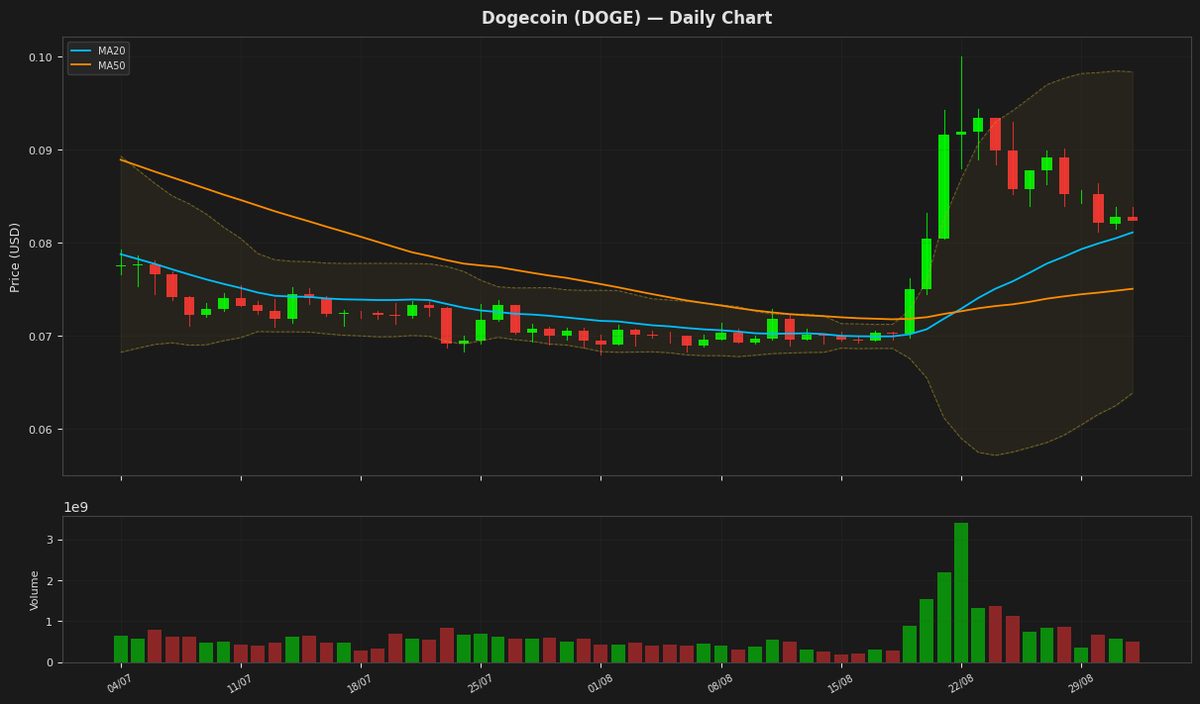
Dogecoin's price is currently at $0.082410, showing a slight decline of 0.49% for the day. The RSI reading of 64.31 indicates that the cryptocurrency is nearing overbought territory but hasn't reached it yet. The MACD is below its signal line, suggesting a potential bearish crossover. The price is also below the upper Bollinger Band at $0.098368, indicating that it has room to move upwards.
Disclaimer
The content on MarketsFN.com is provided for educational and informational purposes only. It does not constitute financial advice or investment recommendations. All investments involve risk. Past performance does not guarantee future results.