Crypto Market Slumps: BNB, Tron, and Dogecoin Lead Today's Losses
QuoteReporter
•5 min read
Crypto Market Slumps: BNB, Tron, and Dogecoin Lead Today's Losses
Crypto Market Report | September 04, 2026
📊 Crypto Market Overview
The cryptocurrency market is currently displaying a mixed sentiment, with some assets experiencing minor gains while others see slight declines. Bitcoin, the largest cryptocurrency by market capitalization, is trading at $81,047.2422, down 0.28% on the day. Its Relative Strength Index (RSI) stands at 59.1, indicating a neutral territory, while the Moving Average Convergence Divergence (MACD) is at 3526.4104, suggesting a continued bullish trend.
Other major cryptocurrencies are also showing varied performance. Ethereum is up 0.39% to $2,517.8601, with an RSI of 50.2 and a MACD of 128.6963, indicating a relatively stable position. Solana and BNB are down marginally, with SOL at $103.9600 and BNB at $718.1200. In contrast, Tron is down 0.88% to $0.3279, with an RSI of 33.4, indicating it is oversold.
The recent surge in Bitcoin ETF inflows, totaling $731 million, is a significant development, marking the highest inflow since January. This influx has coincided with Bitcoin reclaiming the $80,000 level. The macroeconomic context is also worth noting, with the value of one full Bitcoin now exceeding 18 ounces of gold, a level not seen since January.
From a technical perspective, several cryptocurrencies are displaying interesting signals. Bitcoin's RSI and MACD suggest a strong but not overbought position. Ethereum's neutral RSI and positive MACD indicate stability. In contrast, Tron's low RSI suggests it may be due for a rebound. Overall, the market is characterized by a mix of stability and minor adjustments, with significant attention drawn to the recent ETF inflows and the relative value of Bitcoin compared to other assets.
Other major cryptocurrencies are also showing varied performance. Ethereum is up 0.39% to $2,517.8601, with an RSI of 50.2 and a MACD of 128.6963, indicating a relatively stable position. Solana and BNB are down marginally, with SOL at $103.9600 and BNB at $718.1200. In contrast, Tron is down 0.88% to $0.3279, with an RSI of 33.4, indicating it is oversold.
The recent surge in Bitcoin ETF inflows, totaling $731 million, is a significant development, marking the highest inflow since January. This influx has coincided with Bitcoin reclaiming the $80,000 level. The macroeconomic context is also worth noting, with the value of one full Bitcoin now exceeding 18 ounces of gold, a level not seen since January.
From a technical perspective, several cryptocurrencies are displaying interesting signals. Bitcoin's RSI and MACD suggest a strong but not overbought position. Ethereum's neutral RSI and positive MACD indicate stability. In contrast, Tron's low RSI suggests it may be due for a rebound. Overall, the market is characterized by a mix of stability and minor adjustments, with significant attention drawn to the recent ETF inflows and the relative value of Bitcoin compared to other assets.
📰 Crypto News
- Bitcoin ETF inflows hit $731M, highest since January as BTC reclaims $80K
- Here’s what happened in crypto today
- El Salvador’s post-review Bitcoin accumulation used no public funds: IMF
- US, UK launch joint alliance targeting crypto scam centers
- Tether sued over frozen ‘pig butcher’ coins, 6,600 students get crypto loans: Asia Express
- CFTC files to dismiss CME lawsuit over crypto perpetual futures
- Live updates: Bitcoin ETFs take $731 million, their biggest day since January
- OpenAI puts $1 billion behind cyber defense after unveiling AI that can find zero-days
- One full bitcoin now buys a little more than 18 ounces of gold, the most since January
- Bitcoin back above $81,000 as hike odds fade, Zcash leads with 15% jump
- U.S. banking agency gives blockchain bank OpenReserve initial OK to operate
- AMC CEO blasts Robinhood for stock token, putting synthetic shares in spotlight
- Utah Becomes First State to Target VPNs in Age-Verification Crackdown
- Bitcoin Miner Ditches Site for AI Deal That Could Top $1.2 Billion
- What Is Pons? The Robinhood Chain Meme Coin Factory Token Up 18,000% Since July
🔍 Technical Analysis
Bitcoin (BTC) — -0.28%
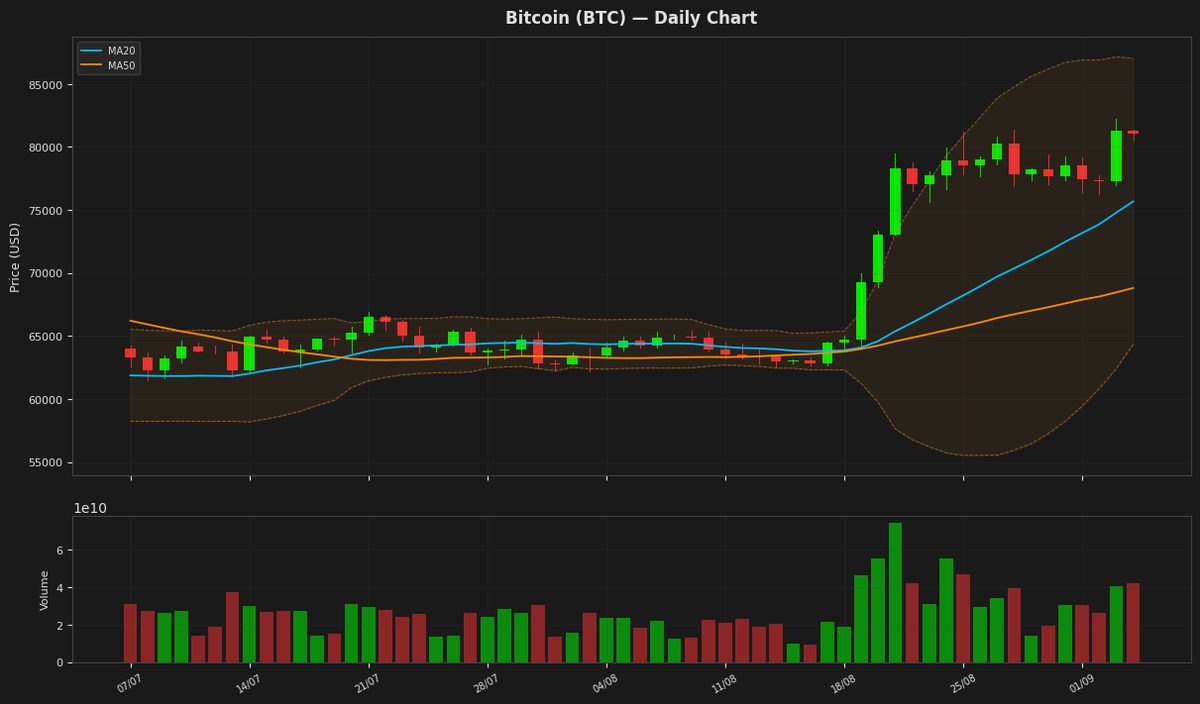
$81,047.24 52W: $57,747.77 — $97,860.60
Bitcoin is currently trading at $81,047, slightly below its 20-day moving average of $75,680, and above its 50-day moving average of $68,804, indicating a relatively stable short-term trend. The RSI of 59.06 suggests a neutral to slightly bullish sentiment, while the MACD is above its signal line, indicating a potential buy signal. The price is also within the Bollinger Bands, with the upper band at $87,041 and the lower band at $64,320.
Ethereum (ETH) — +0.39%
$2,517.86 52W: $1,506.51 — $3,397.90
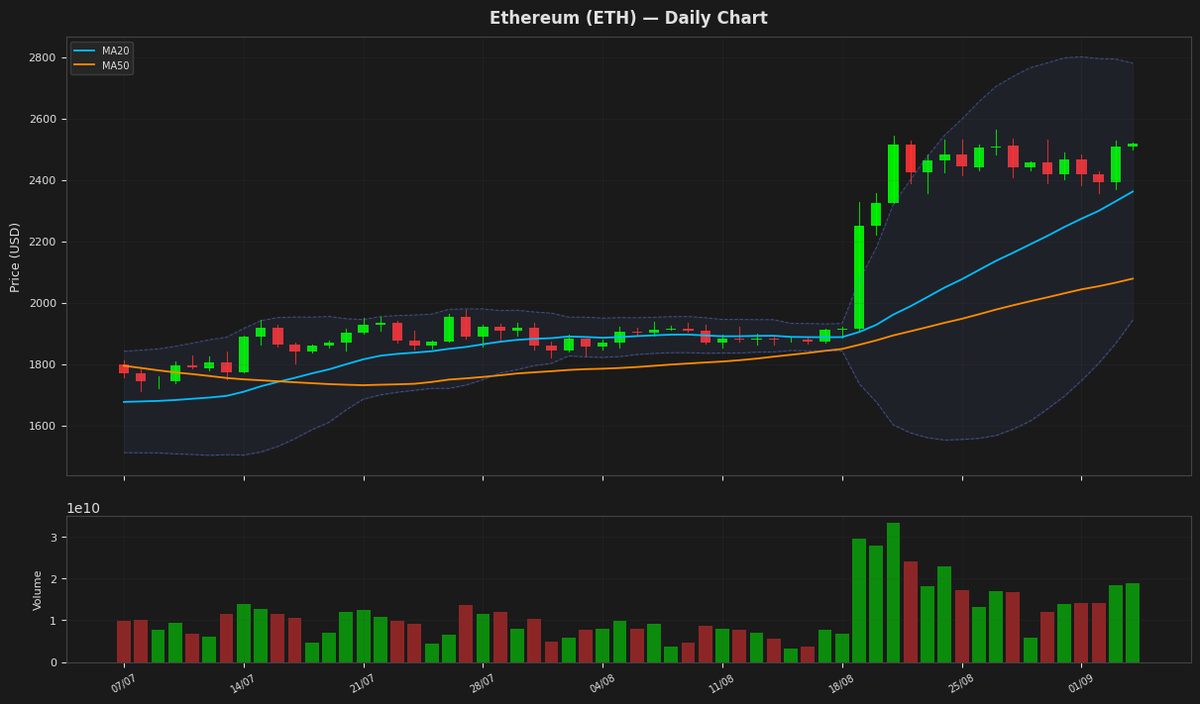
Ethereum is currently trading at $2,517.86, near its 20-day moving average of $2,362.28, indicating a potential consolidation phase as the RSI is around 50. The MACD is below its signal line, suggesting a slightly bearish momentum, while the Bollinger Bands indicate that the price is still within a relatively wide trading range. The ATR suggests moderate volatility.
Ripple (XRP) — -0.08%
$1.4501 52W: $0.988422 — $2.4103
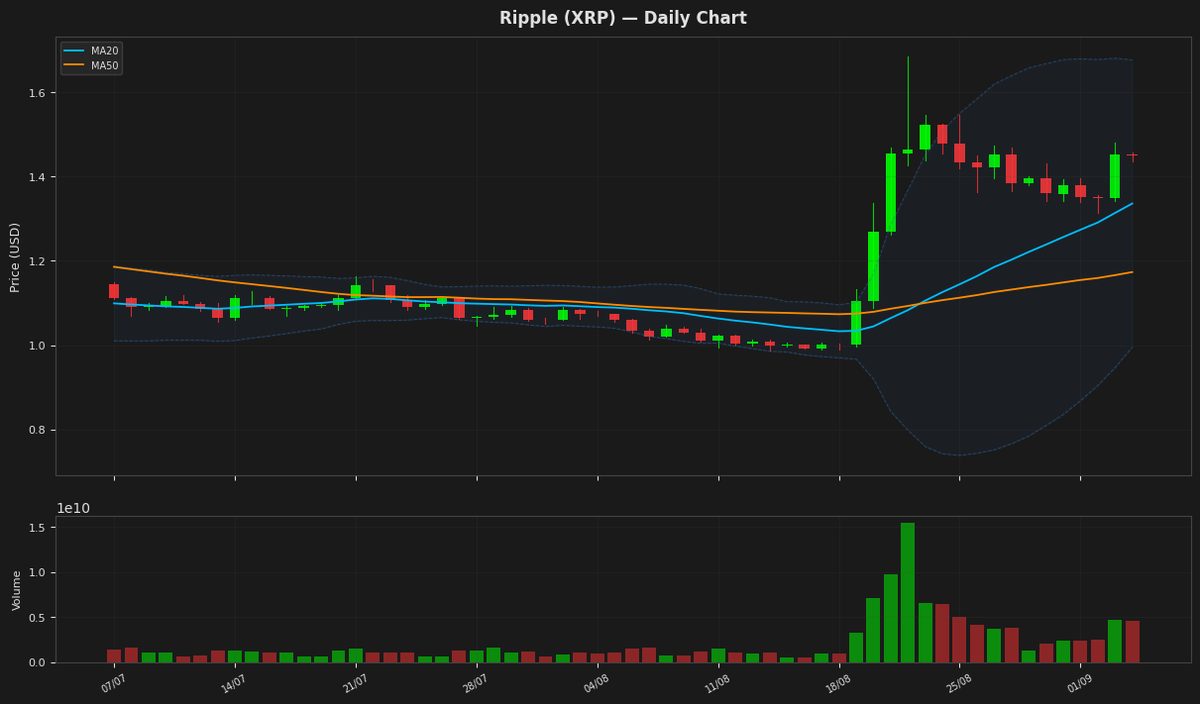
Ripple is currently trading at $1.450100, above its 20-day and 50-day moving averages of 1.33588 and 1.173375, indicating a bullish trend. The Relative Strength Index is at 49.607538, suggesting a neutral momentum. The price is also within the Bollinger Bands, with the upper band at 1.676375 and lower band at 0.995384, indicating moderate volatility. The MACD is slightly below its signal line, hinting at a potential slowdown in the uptrend.
Solana (SOL) — -0.02%
$103.9600 52W: $60.4147 — $148.2160
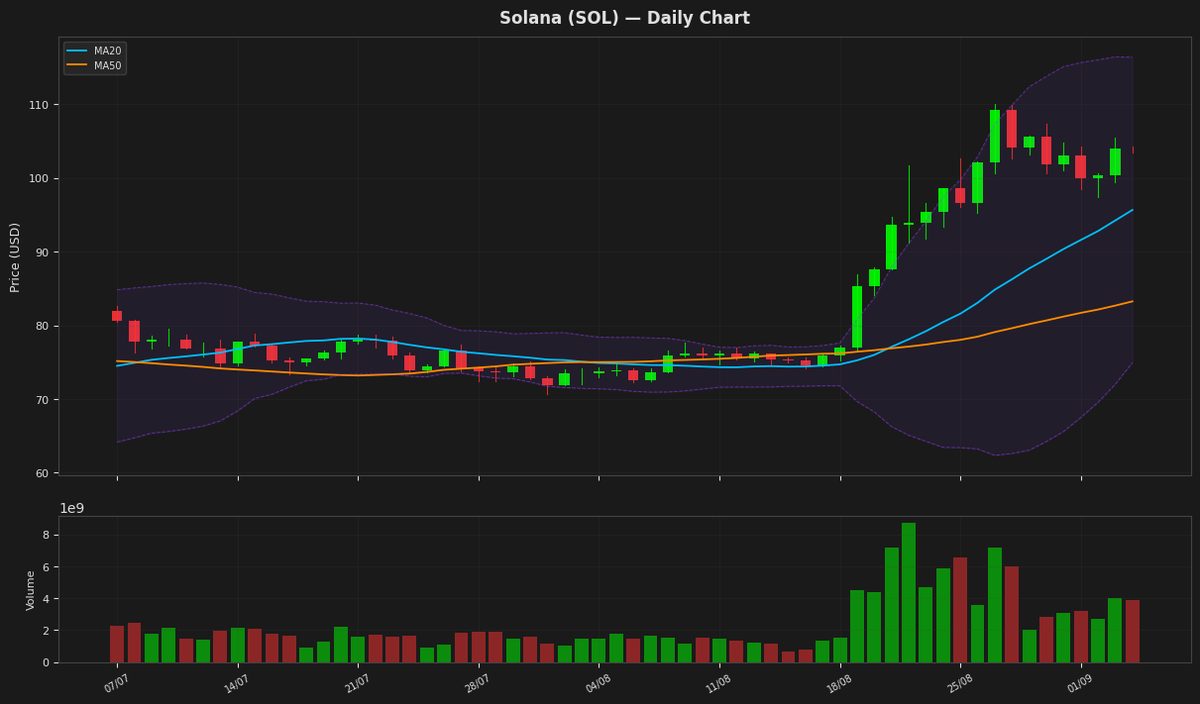
Solana's price is currently at $103.96, showing a minimal daily change. The RSI at 63.56366 indicates a neutral to slightly bullish sentiment, while the MACD being below its signal line suggests a potential short-term reversal. The price is above both MA20 and MA50, indicating an overall uptrend, and is currently between the upper and lower Bollinger Bands, with the upper band at $116.36 and lower band at $74.94.
BNB (BNB) — -0.95%
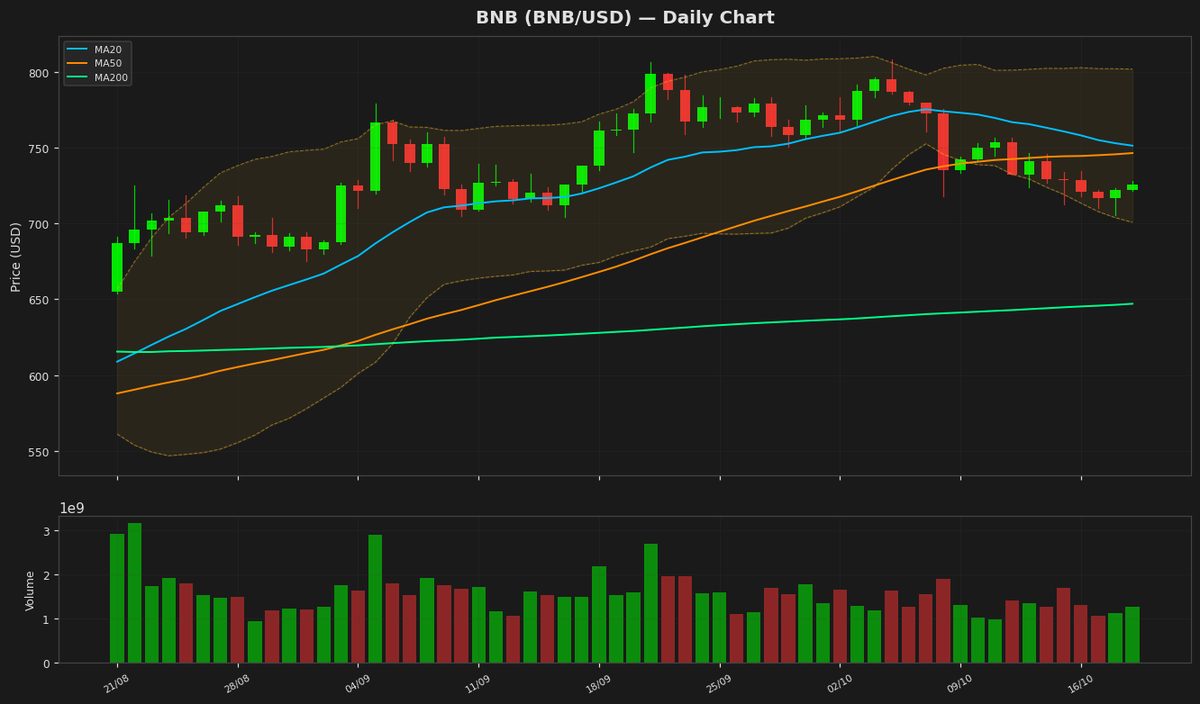
$718.1200 52W: $538.5992 — $954.8583
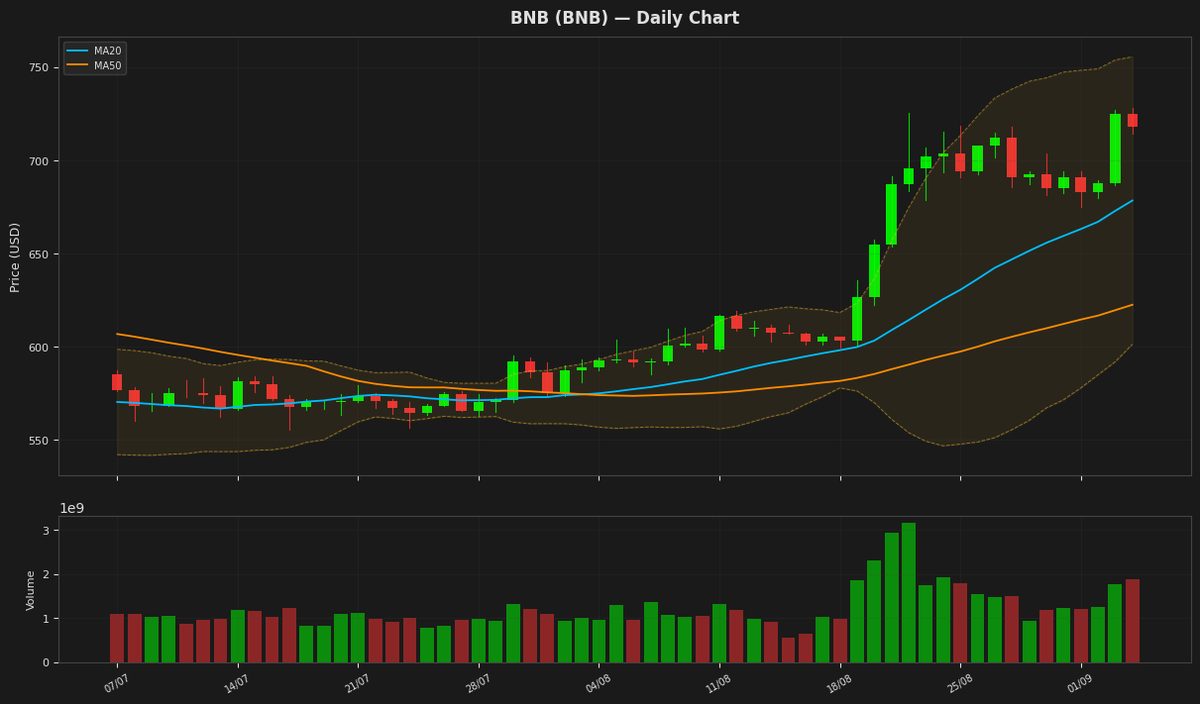
BNB is currently trading at $718.12, with its price hovering near the upper Bollinger Band at $755.48, indicating a potential resistance level. The RSI is at 61.26, suggesting a relatively strong uptrend, while the MACD is slightly below its signal line, indicating a possible slowdown in momentum. The price is above both the MA20 and MA50, confirming the overall bullish trend.
Tron (TRX) — -0.88%
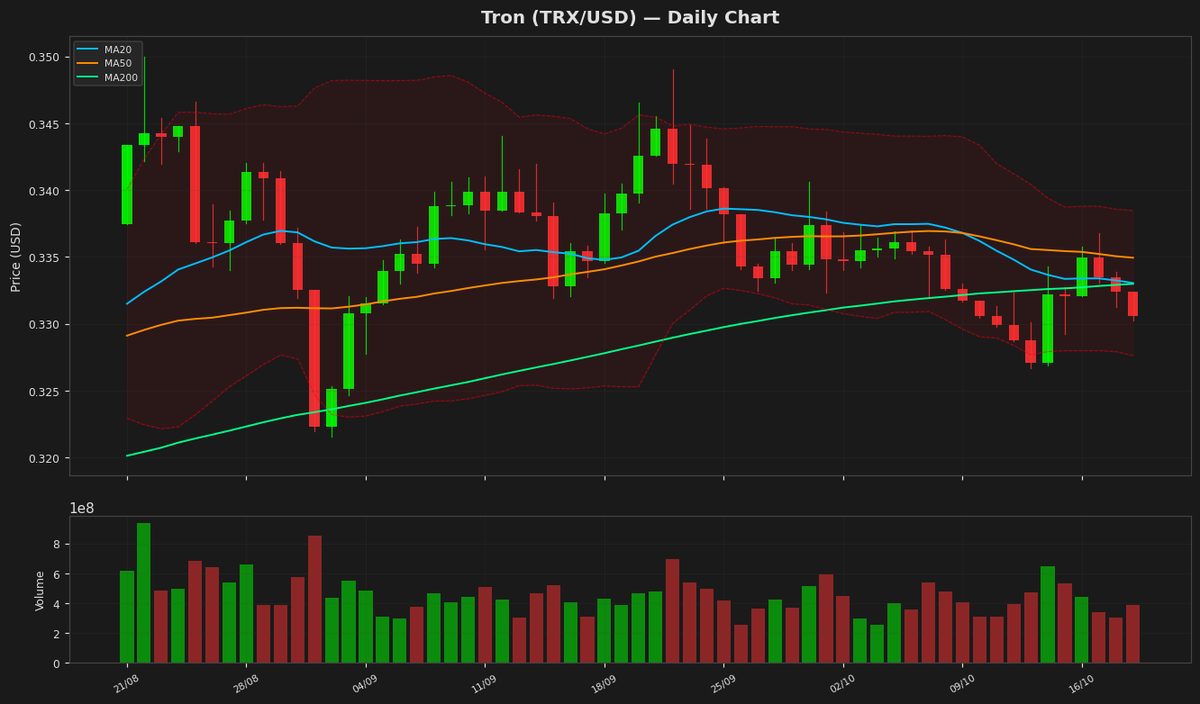
$0.327886 52W: $0.268138 — $0.376332
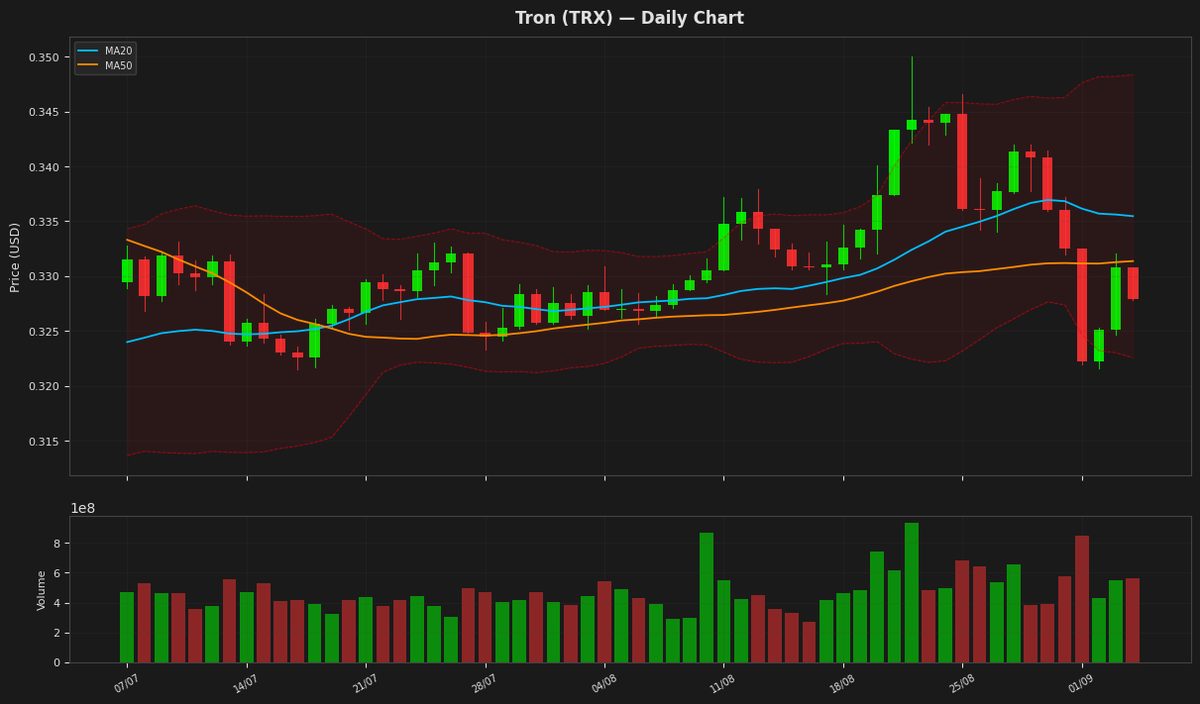
Tron's price is currently at $0.327886, showing a slight decline, and is positioned near the lower Bollinger Band at $0.322551, indicating potential oversold conditions. The RSI(14) value of 33.405059 further supports this, as it is below 40, suggesting the asset may be undervalued. The MACD is negative and below its signal line, indicating a bearish trend. The ATR(14) is relatively low at 0.005509, suggesting low volatility.
Dogecoin (DOGE) — -0.65%
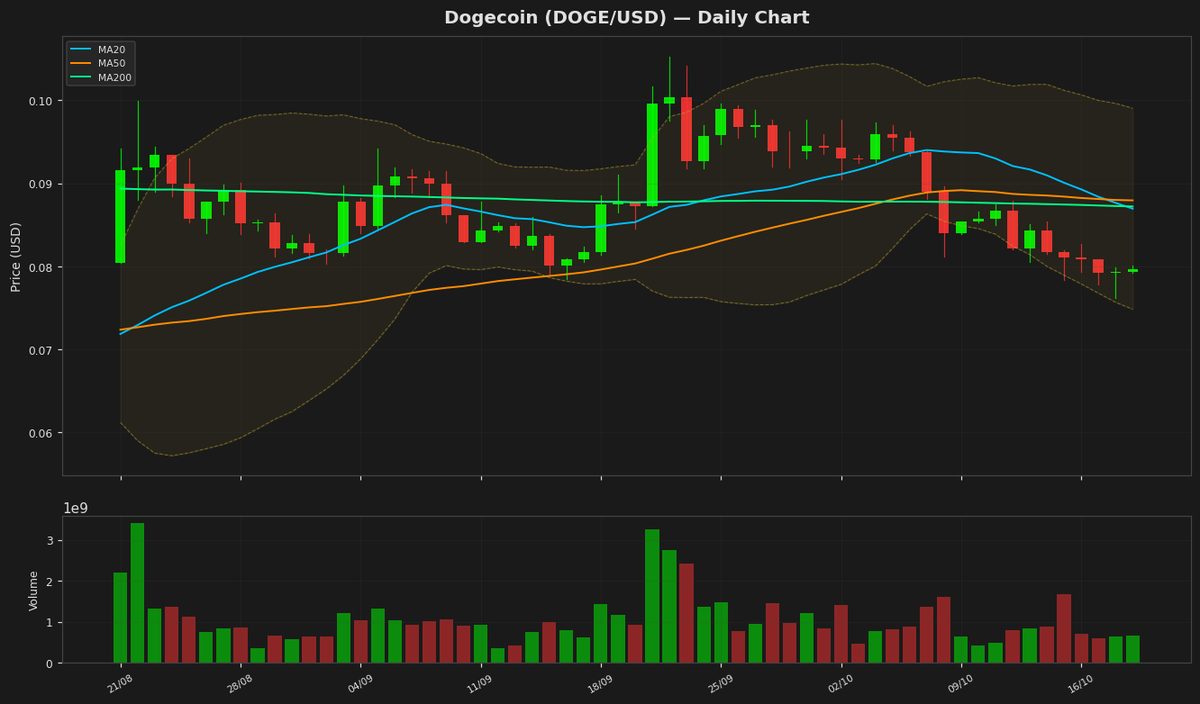
$0.087210 52W: $0.067973 — $0.156091
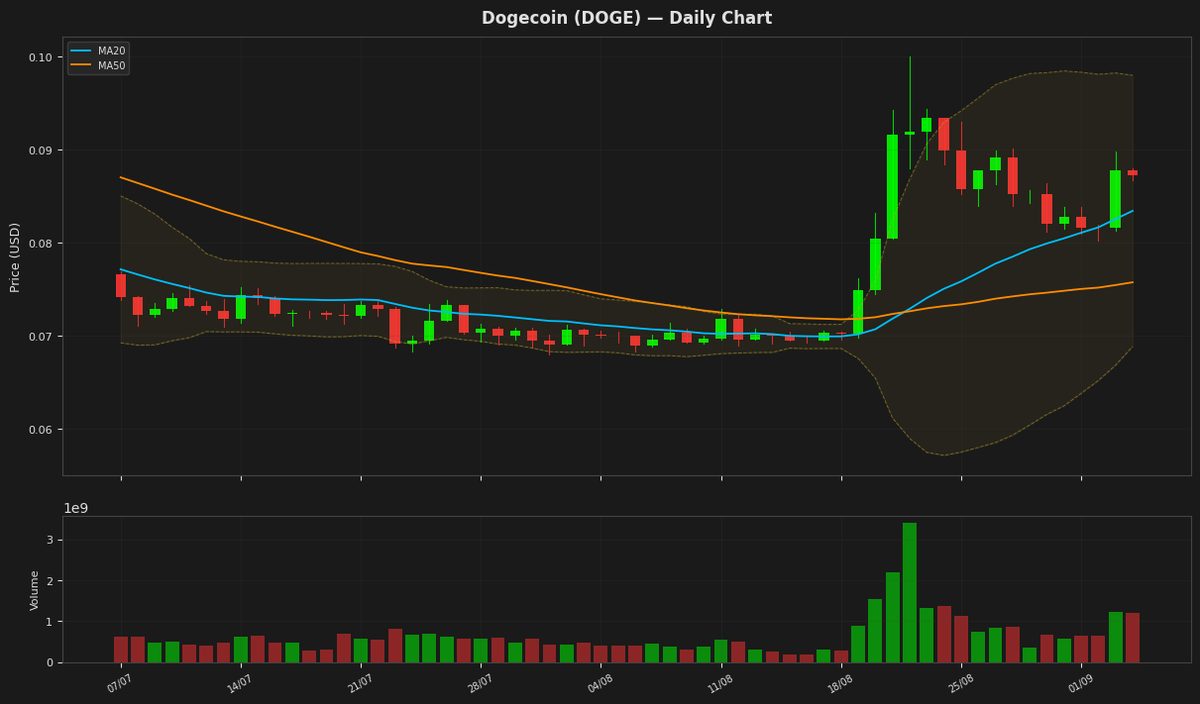
Dogecoin's price is currently at $0.087210, showing a slight decline of 0.65% for the day, and is positioned above its MA20 and MA50, indicating a potential uptrend. The RSI is at 42.30514, suggesting the coin is not oversold and has room to move either way. The MACD is below its signal line, indicating a potential bearish signal. The Bollinger Bands suggest that the current price is near the middle of its recent trading range.
Disclaimer
The content on MarketsFN.com is provided for educational and informational purposes only. It does not constitute financial advice or investment recommendations. All investments involve risk. Past performance does not guarantee future results.