Crypto Market Slumps: BNB, Solana, Dogecoin Lead Top Losers Today.
QuoteReporter
•5 min read
Crypto Market Slumps: BNB, Solana, Dogecoin Lead Top Losers Today.
Crypto Market Report | October 01, 2026
📊 Crypto Market Overview
The cryptocurrency market is currently exhibiting a mixed sentiment, with most major assets experiencing minor declines. Bitcoin is trading at $83,349.5781, down 0.24% on the day, while Ethereum has also seen a slight decrease of 0.20% to $2,678.4199. Other prominent cryptocurrencies such as Ripple, Solana, and BNB are similarly down, with losses ranging from 0.23% to 0.39%. In contrast, Tron has managed to eke out a small gain of 0.03% to $0.3375.
From a technical perspective, several key assets are showing signs of being overbought, with Bitcoin's RSI standing at 73.6 and Ethereum's at 74.8. Solana's RSI is also elevated at 71.4, while Ripple and Dogecoin are slightly less stretched at 68.9 and 65.5, respectively. The MACD indicators for these assets are generally positive, suggesting ongoing upward momentum.
The macroeconomic context remains relevant, with the recent influx of $6.3 billion into Bitcoin ETFs in Q3 drawing attention to the growing institutional interest in cryptocurrency. However, the sector is also facing challenges, including a significant increase in crypto hacks, which totaled over $768 million in September. Regulatory developments, such as the CFTC's efforts to define event contracts as swaps, continue to shape the market landscape.
Notable news stories include MetaMask's exit from Ethereum validators due to a security incident, although the firm has assured users that no funds were at risk. Additionally, Standard Chartered has made a bullish prediction regarding Ethena's USDe stablecoin, forecasting it could reach $40 billion. Overall, the cryptocurrency market is navigating a complex environment, with both positive and negative factors influencing sentiment and price action.
From a technical perspective, several key assets are showing signs of being overbought, with Bitcoin's RSI standing at 73.6 and Ethereum's at 74.8. Solana's RSI is also elevated at 71.4, while Ripple and Dogecoin are slightly less stretched at 68.9 and 65.5, respectively. The MACD indicators for these assets are generally positive, suggesting ongoing upward momentum.
The macroeconomic context remains relevant, with the recent influx of $6.3 billion into Bitcoin ETFs in Q3 drawing attention to the growing institutional interest in cryptocurrency. However, the sector is also facing challenges, including a significant increase in crypto hacks, which totaled over $768 million in September. Regulatory developments, such as the CFTC's efforts to define event contracts as swaps, continue to shape the market landscape.
Notable news stories include MetaMask's exit from Ethereum validators due to a security incident, although the firm has assured users that no funds were at risk. Additionally, Standard Chartered has made a bullish prediction regarding Ethena's USDe stablecoin, forecasting it could reach $40 billion. Overall, the cryptocurrency market is navigating a complex environment, with both positive and negative factors influencing sentiment and price action.
📰 Crypto News
- Bitcoin ETFs draw $6.3B in Q3 as BTC price rises nearly 43%
- Bitcoin think tank questions MSCI’s ‘invisible committee’ over Strategy, Metaplanet rule
- Here’s what happened in crypto today
- Crypto hacks top $768M in September, worst month of 2026
- CFTC seeks to define event contracts as swaps amid prediction market fight
- MetaMask exits Ethereum validators amid undisclosed security incident
- Standard Chartered sees Ethena’s USDe reaching $40B, ENA hitting $2
- MetaMask security incident forces Ethereum staking exits, no funds at risk
- Dogecoin gets DeFi testnet as DogeOS bets miners will eventually secure its apps
- Bitcoin's soft-inflation pop to $85,500 fades as bond yields refuse to fall
- Gemini 4 Is Here, and Google’s Flagship Tops All Other AI Models on Cybersecurity
- Dogecoin Is Getting Apps as DogeOS Opens Its Public Testnet
- FBI Tells Its Employees to Assume Hackers Have Their Personal Data
- Coinbase-Backed Crypto Group Reveals Midterm Endorsements After Clarity Act Collapse
🔍 Technical Analysis
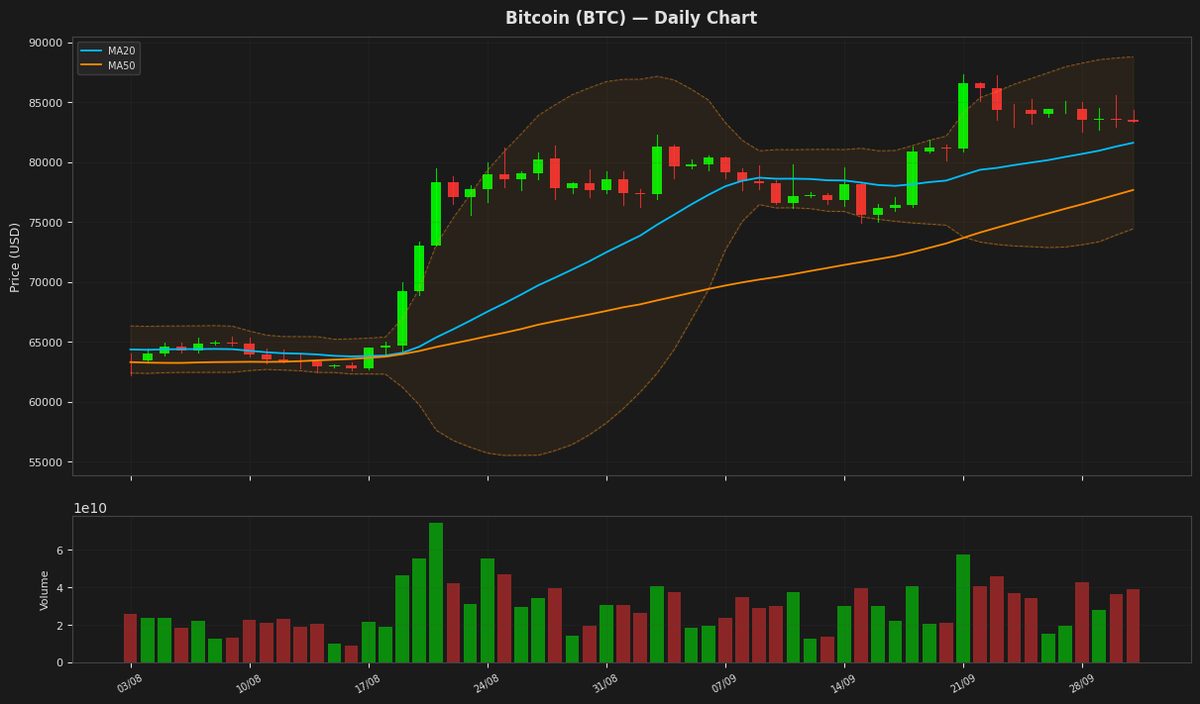
Bitcoin (BTC) — -0.24%
$83,349.58 52W: $57,747.77 — $91,100.25
Bitcoin is currently trading at $83,349.578125, slightly below its 20-day moving average of $81,609.077734, and near the upper Bollinger Band at $88,784.701534, indicating a potential resistance level. The RSI is at 73.592147, suggesting the cryptocurrency is in overbought territory, while the MACD is below its signal line, indicating a potential bearish divergence. The ATR remains relatively high, indicating significant price volatility.
Ethereum (ETH) — -0.20%
$2,678.42 52W: $1,506.51 — $3,040.72
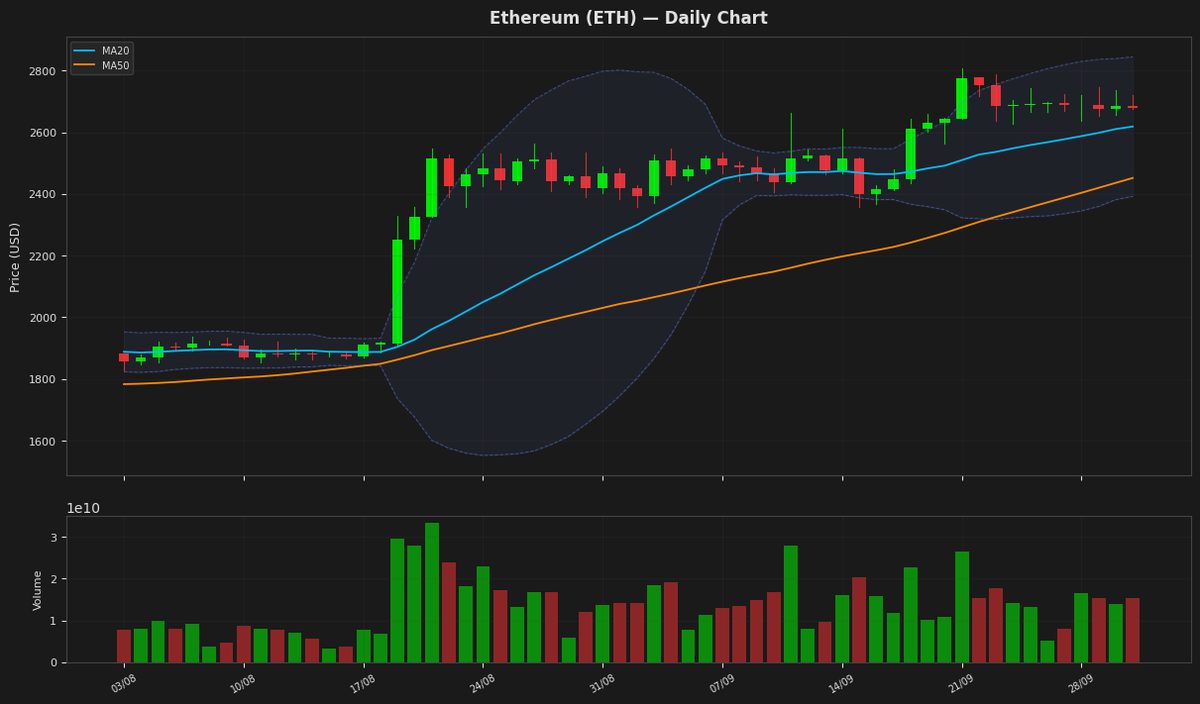
Ethereum's price is currently at $2,678, slightly below its 20-day moving average of $2,618, and is trading near the upper end of the Bollinger Bands, indicating a potentially overbought condition as the RSI is at 74.83. The MACD is below its signal line, suggesting a possible bearish divergence. The Average True Range indicates moderate volatility.
Ripple (XRP) — -0.23%
$1.4850 52W: $0.988422 — $1.9591
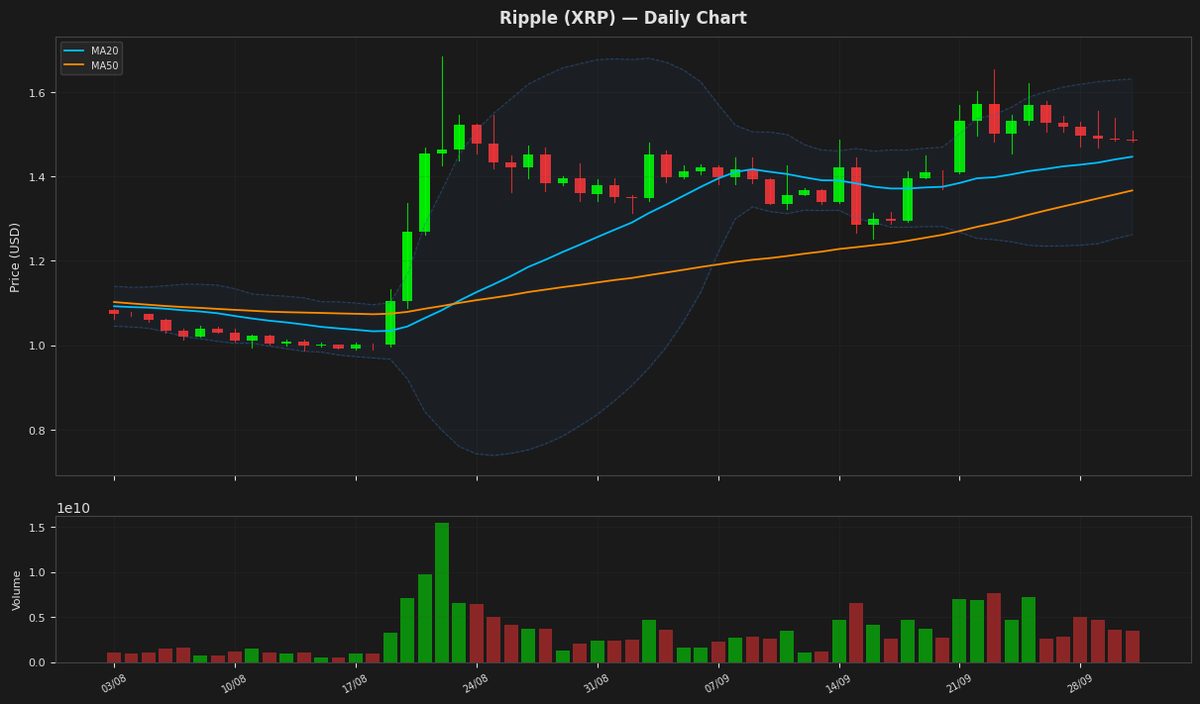
Ripple's price is currently at $1.485, showing a slight decline, and is positioned above both its 20-day and 50-day moving averages, indicating a generally positive trend. The RSI is nearing overbought territory at 68.93, while the MACD is below its signal line, suggesting a potential slowdown in the upward momentum. The price is also below the upper Bollinger Band at $1.631, indicating that it has room to move upwards. The ATR indicates moderate volatility.
Solana (SOL) — -0.38%
$117.5500 52W: $60.4147 — $129.7286
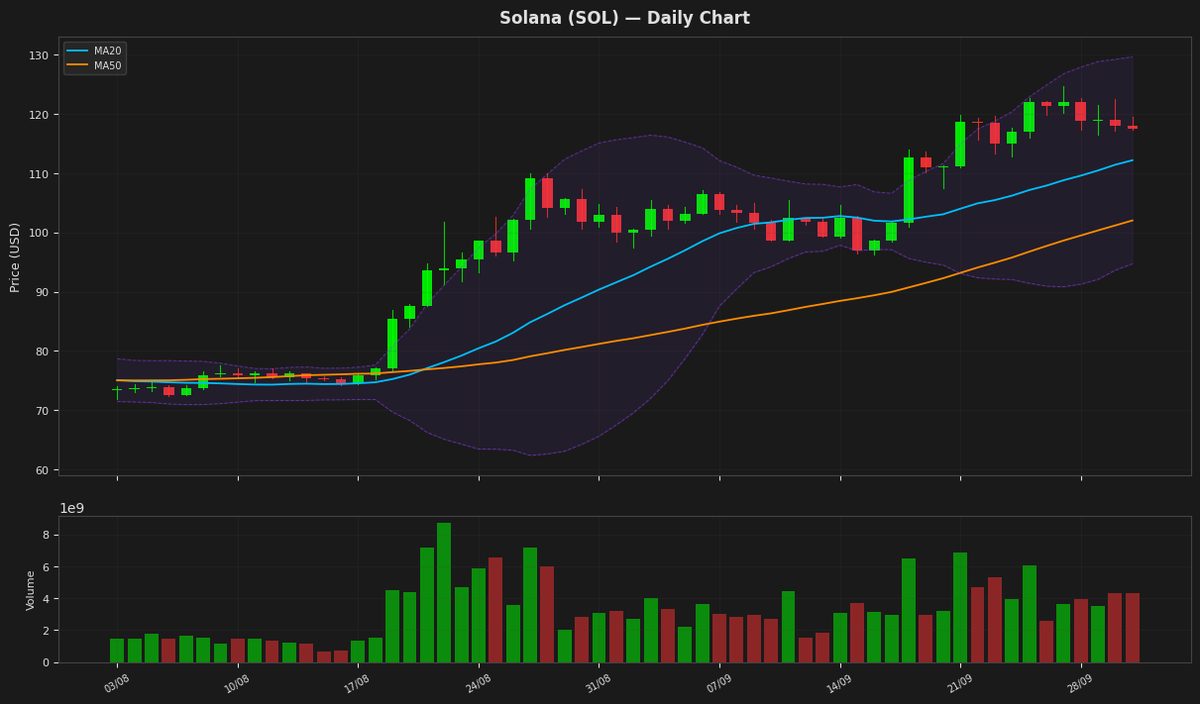
Solana's price is currently at $117.55, showing a minor decline of 0.38% and trading above both its MA20 and MA50, indicating a bullish trend. The RSI is at 71.38, suggesting the asset is nearing overbought territory. The MACD is below its signal line, indicating a potential bearish crossover. The price is also nearing the upper Bollinger Band at $129.64.
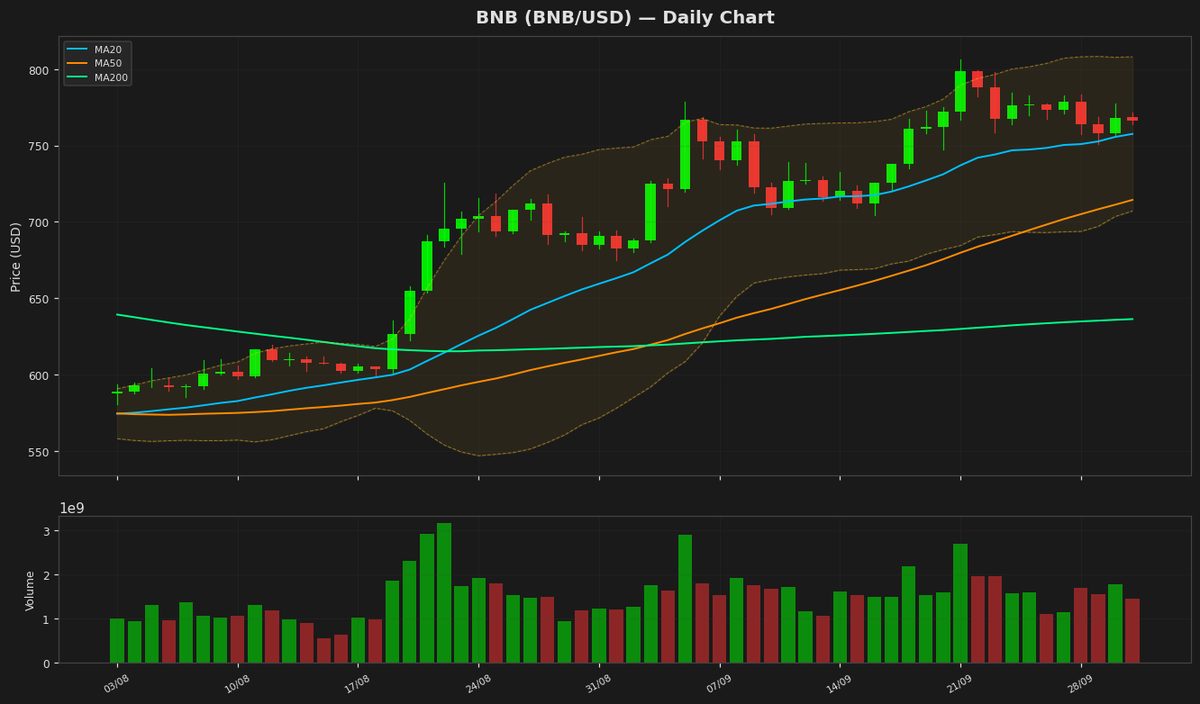
BNB (BNB) — -0.39%
$765.1600 52W: $538.5992 — $907.3658
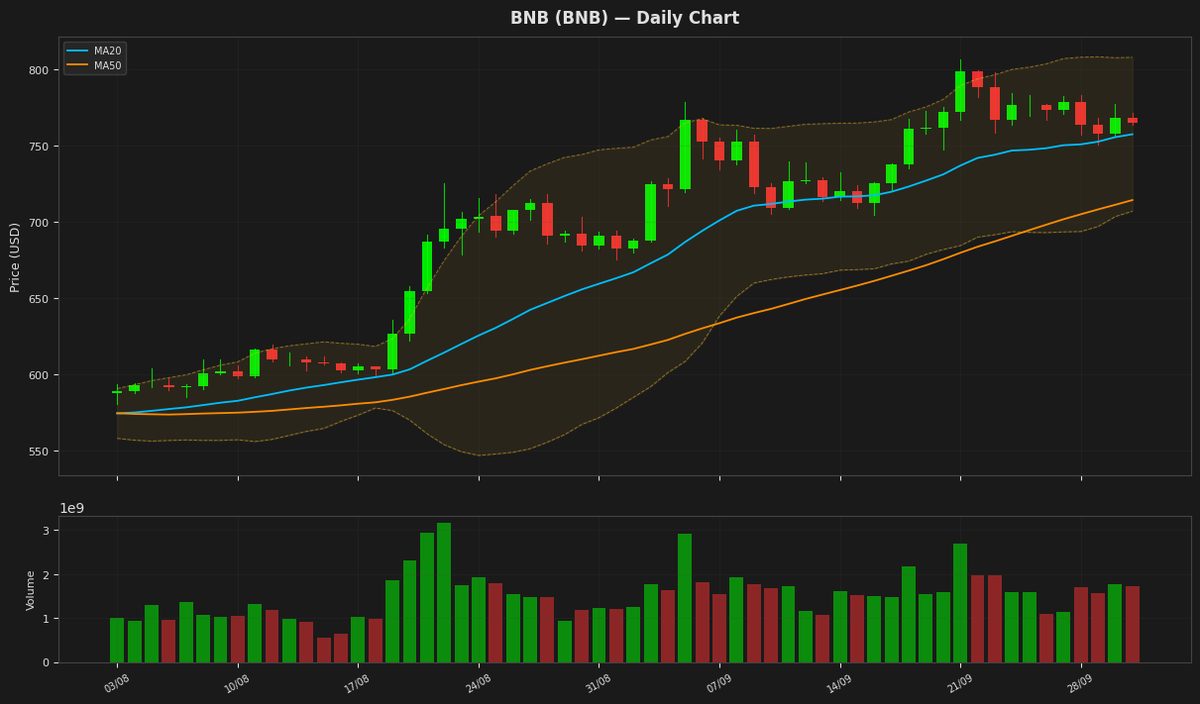
BNB is currently trading at $765.16, slightly above its 20-day moving average of $757.51, indicating a relatively stable short-term trend. The Relative Strength Index (RSI) at 59.35 suggests that the asset is not overbought, leaving room for potential further upside. The MACD line is below the signal line, indicating a potential bearish signal, while the price remains above the lower Bollinger Band, showing that it is still within a relatively stable range.
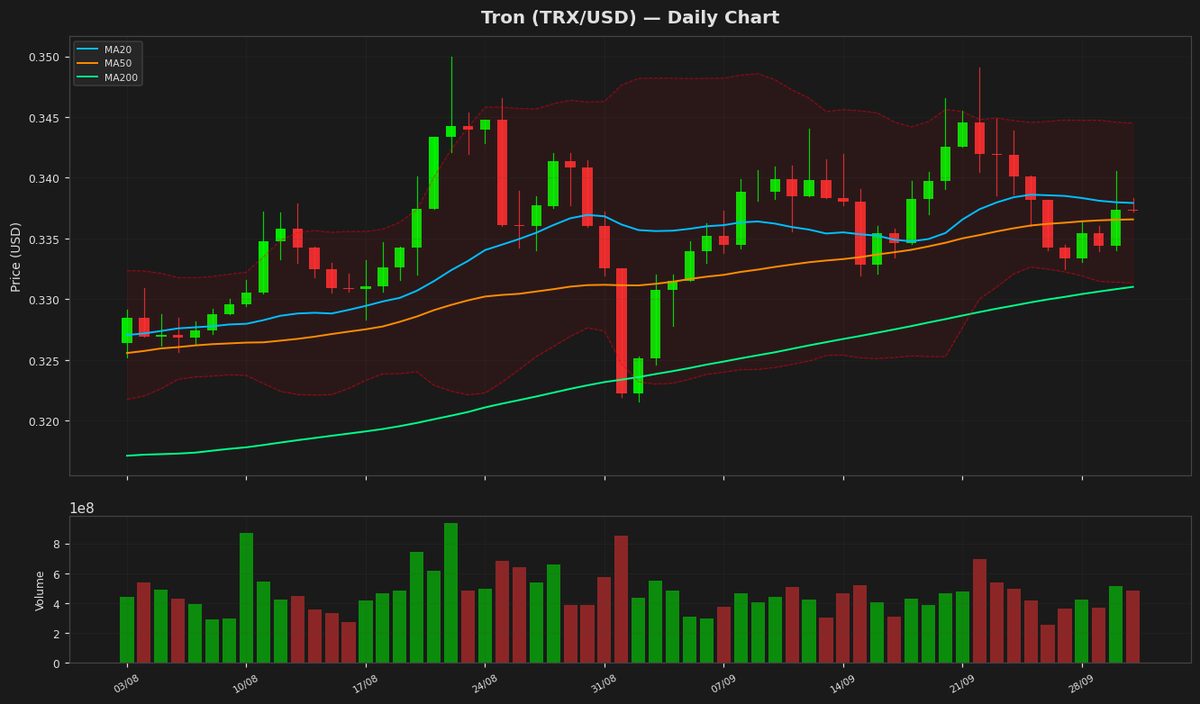
Tron (TRX) — +0.03%
$0.337490 52W: $0.268138 — $0.376332
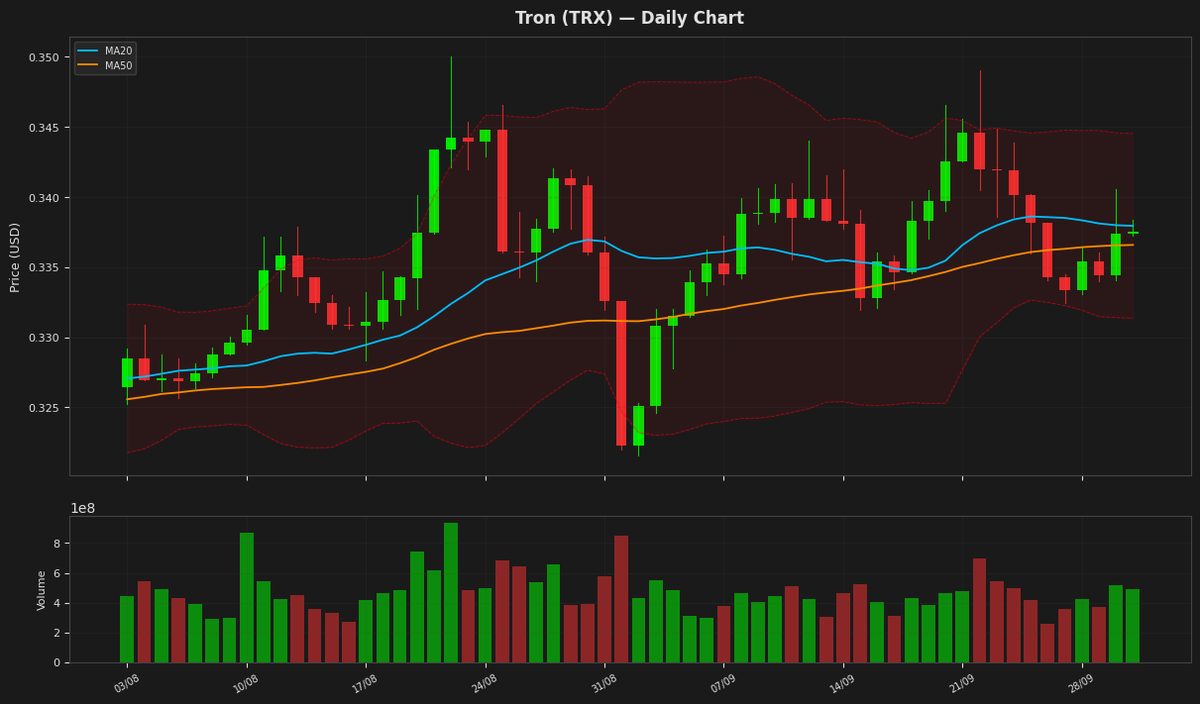
Tron's price is currently at $0.337490, showing a marginal increase of 0.03% and trading near its 20-day and 50-day moving averages, indicating a lack of strong directional momentum. The Relative Strength Index (RSI) at 55.193767 suggests a neutral stance, neither overbought nor oversold. The Bollinger Bands indicate that the price is within the upper and lower bounds, with the upper band at $0.344524 and lower band at $0.331348. The Average True Range (ATR) of 0.004478 implies low volatility.
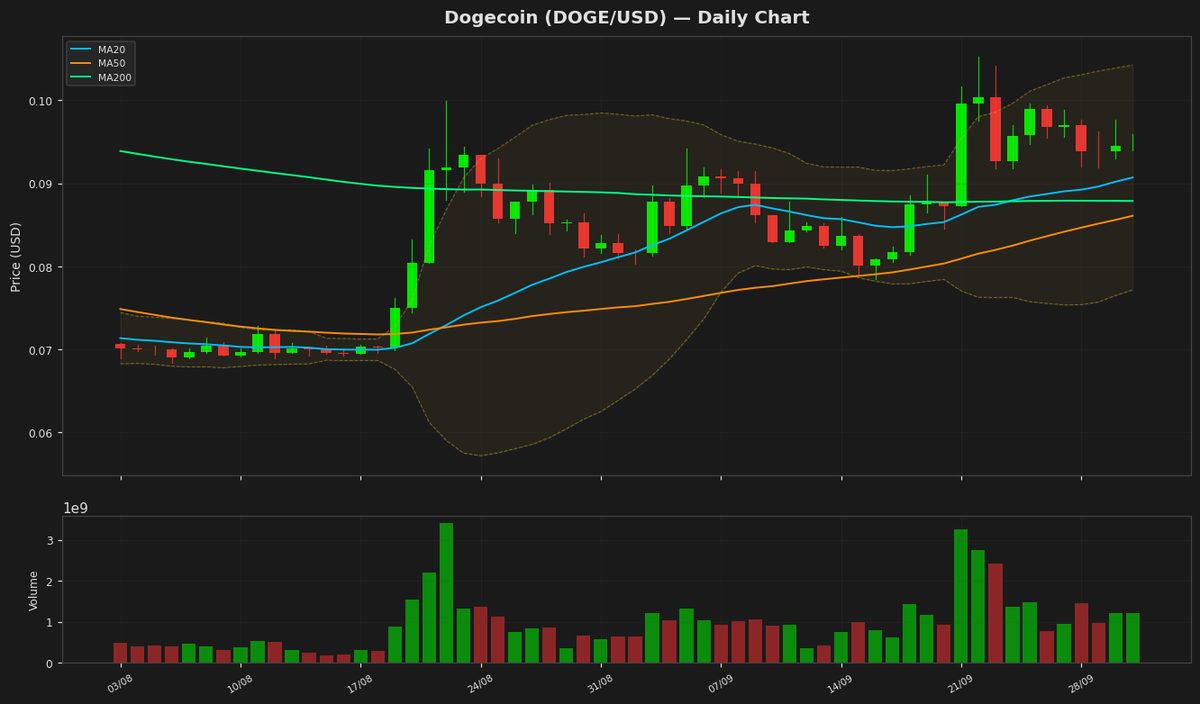
Dogecoin (DOGE) — -0.33%
$0.094160 52W: $0.067973 — $0.127298
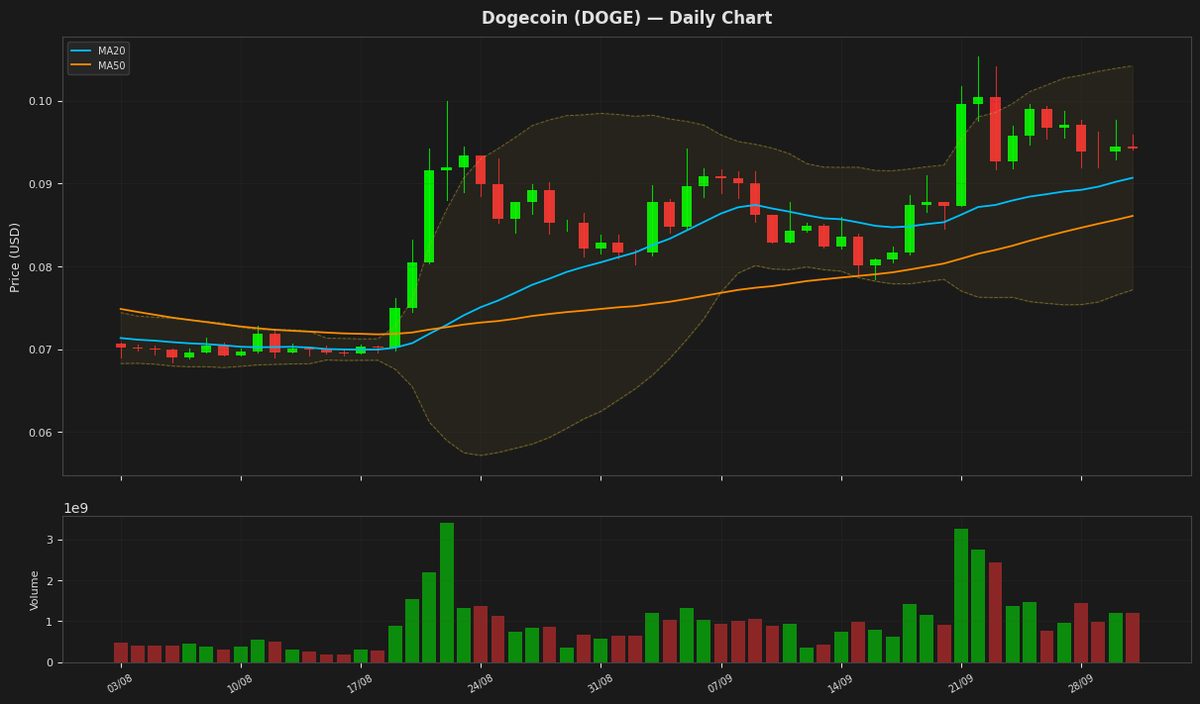
Dogecoin is currently trading at $0.094160, above its 20-day and 50-day moving averages of 0.090676 and 0.086078 respectively, indicating a short-term uptrend. The RSI is at 65.545499, suggesting the cryptocurrency is nearing overbought territory. The Bollinger Bands indicate a potential resistance level at the upper band of 0.104194. The MACD is below its signal line, indicating a potential sell signal.
Disclaimer
The content on MarketsFN.com is provided for educational and informational purposes only. It does not constitute financial advice or investment recommendations. All investments involve risk. Past performance does not guarantee future results.