Tron Holds Steady at $0.3373 as RSI Shows Neutral Momentum
QuoteReporter
•2 min read
Tron Holds Steady at $0.3373 as RSI Shows Neutral Momentum
Tron (TRX/USD) | October 01, 2026 $0.3373 -0.03%
🔍 Technical Analysis
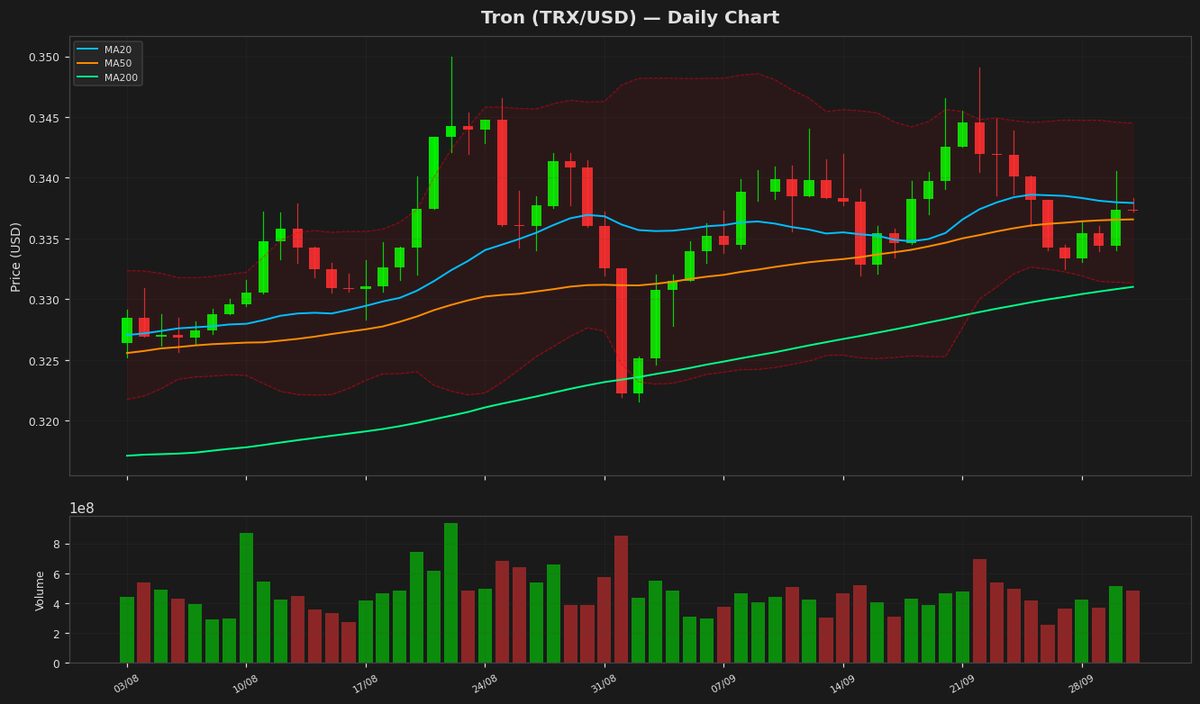
Tron (TRX) is currently trading at $0.337279, showing minimal daily movement with a slight decline of 0.03%. The price is hovering near key moving averages, indicating a neutral short-term trend. The 20-day MA at $0.337926 is slightly above the current price, while the 50-day MA at $0.336574 and the 200-day MA at $0.33102 suggest underlying support. Bollinger Bands reveal a tight range, with the upper band at $0.344517 and the lower band at $0.331334, signaling low volatility and potential consolidation.
The RSI at 54.8 reflects a balanced market, neither overbought nor oversold. The MACD histogram shows a marginal positive value of 4.6e-05, but the signal line at 0.000539 suggests weak bullish momentum. ATR(14) at $0.004478 confirms subdued price volatility.
Key resistance levels to watch are the yearly high at $0.37633 and the upper Bollinger Band. Support lies at the 200-day MA ($0.33102) and the yearly low of $0.26813. A breakout above $0.3445 could signal upward momentum, while a drop below $0.331 may test lower supports. Traders should monitor MACD convergence and RSI for directional cues.
The RSI at 54.8 reflects a balanced market, neither overbought nor oversold. The MACD histogram shows a marginal positive value of 4.6e-05, but the signal line at 0.000539 suggests weak bullish momentum. ATR(14) at $0.004478 confirms subdued price volatility.
Key resistance levels to watch are the yearly high at $0.37633 and the upper Bollinger Band. Support lies at the 200-day MA ($0.33102) and the yearly low of $0.26813. A breakout above $0.3445 could signal upward momentum, while a drop below $0.331 may test lower supports. Traders should monitor MACD convergence and RSI for directional cues.
Technical Metrics
| Metric | Value |
|---|---|
| Current Price | $0.3373 |
| Daily Change | -0.03% |
| MA 20 | $0.3379 |
| % from MA20 | -0.19% |
| MA 50 | $0.3366 |
| % from MA50 | +0.21% |
| MA 200 | $0.3310 |
| % from MA200 | +1.89% |
| BB Upper | $0.3445 |
| % from BB Upper | -2.10% |
| BB Lower | $0.3313 |
| % from BB Lower | +1.79% |
| RSI (14) | 54.81 |
| MACD | 0.000046 |
| MACD Signal | 0.000539 |
| ATR (14) | 0.004478 |
| 3-Day High | $0.3406 |
| 3-Day Low | $0.3340 |
| 52-Week High | $0.3763 |
| % from 52W High | -10.38% |
| 52-Week Low | $0.2681 |
| % from 52W Low | +25.79% |
| YTD High | $0.3763 |
| % from YTD High | -10.38% |
| YTD Low | $0.2681 |
| % from YTD Low | +25.79% |
📊 Market Commentary
Tron (TRX) is trading at $0.3373, showing minimal movement with a slight decline of 0.03% today. The Relative Strength Index (RSI) at 54.8 indicates neutral momentum, neither overbought nor oversold, suggesting balanced market sentiment. Over the past 52 weeks, TRX has fluctuated between $0.2681 and $0.3763, with the current price hovering near the upper end of this range.
Market sentiment for TRX remains cautious yet steady, as traders monitor broader crypto market trends and network activity. The recent stability in price reflects a consolidation phase, with neither strong buying nor selling pressure dominating. Key support levels to watch include $0.3200, a psychological and technical floor, while resistance is noted around $0.3763, the yearly high. A breakout above this level could signal renewed bullish interest, whereas a drop below $0.3200 may indicate weakening momentum.
Traders are also keeping an eye on Tron’s network developments, including transaction volumes and adoption metrics, which could influence price action. Additionally, macroeconomic factors and Bitcoin’s performance continue to play a role in TRX’s price trajectory. For now, the market appears to be in a wait-and-see mode, with the RSI suggesting neither extreme optimism nor pessimism. Volatility may pick up if TRX approaches either end of its 52-week range, prompting traders to adjust positions accordingly.
Market sentiment for TRX remains cautious yet steady, as traders monitor broader crypto market trends and network activity. The recent stability in price reflects a consolidation phase, with neither strong buying nor selling pressure dominating. Key support levels to watch include $0.3200, a psychological and technical floor, while resistance is noted around $0.3763, the yearly high. A breakout above this level could signal renewed bullish interest, whereas a drop below $0.3200 may indicate weakening momentum.
Traders are also keeping an eye on Tron’s network developments, including transaction volumes and adoption metrics, which could influence price action. Additionally, macroeconomic factors and Bitcoin’s performance continue to play a role in TRX’s price trajectory. For now, the market appears to be in a wait-and-see mode, with the RSI suggesting neither extreme optimism nor pessimism. Volatility may pick up if TRX approaches either end of its 52-week range, prompting traders to adjust positions accordingly.
Disclaimer
The content on MarketsFN.com is provided for educational and informational purposes only. It does not constitute financial advice or investment recommendations. All investments involve risk. Cryptocurrency markets are highly volatile. Past performance does not guarantee future results.