Crypto Market Slumps: BNB, Dogecoin, and Ripple Lead Today's Losses
QuoteReporter
•5 min read
Crypto Market Slumps: BNB, Dogecoin, and Ripple Lead Today's Losses
Crypto Market Report | October 06, 2026
📊 Crypto Market Overview
The cryptocurrency market is currently displaying a mixed sentiment, with some assets experiencing minor gains while others are in the red. Bitcoin, the largest cryptocurrency by market capitalization, is trading at $85,825.2031, having risen by 0.05% over the past 24 hours. The Relative Strength Index (RSI) for Bitcoin stands at 47.9, indicating a neutral stance, while the MACD is at 1958.9997, suggesting a potential for bullish momentum.
Other major cryptocurrencies are also showing varied performance. Ethereum is up 0.12% to $2,714.1799, with an RSI of 42.1 and a MACD of 61.2742, indicating a relatively stable position. In contrast, Ripple, Solana, BNB, and Dogecoin are all in negative territory, with losses ranging from 0.22% to 0.67%. The RSI values for these assets are generally below 50, suggesting a bearish bias, although their MACD indicators are mixed.
The macroeconomic context is influencing the crypto market, with recent news highlighting the ongoing debate around cryptocurrency regulation in the United States. The withdrawal of a proposed crypto mixing rule by FinCEN due to concerns over 'legitimate activity' is a notable development. Additionally, the outflow of $90 million from Bitcoin ETFs as the asset remains 32% below its year-old ATH is a significant market event.
From a technical analysis perspective, the RSI and MACD indicators for the major cryptocurrencies are providing mixed signals. While some assets are showing signs of potential bullish momentum, others are indicating a bearish bias. The current market sentiment appears to be cautious, with investors likely waiting for clearer signals before making significant moves. Overall, the cryptocurrency market is characterized by a complex interplay of factors, including regulatory developments, technical signals, and macroeconomic trends.
Other major cryptocurrencies are also showing varied performance. Ethereum is up 0.12% to $2,714.1799, with an RSI of 42.1 and a MACD of 61.2742, indicating a relatively stable position. In contrast, Ripple, Solana, BNB, and Dogecoin are all in negative territory, with losses ranging from 0.22% to 0.67%. The RSI values for these assets are generally below 50, suggesting a bearish bias, although their MACD indicators are mixed.
The macroeconomic context is influencing the crypto market, with recent news highlighting the ongoing debate around cryptocurrency regulation in the United States. The withdrawal of a proposed crypto mixing rule by FinCEN due to concerns over 'legitimate activity' is a notable development. Additionally, the outflow of $90 million from Bitcoin ETFs as the asset remains 32% below its year-old ATH is a significant market event.
From a technical analysis perspective, the RSI and MACD indicators for the major cryptocurrencies are providing mixed signals. While some assets are showing signs of potential bullish momentum, others are indicating a bearish bias. The current market sentiment appears to be cautious, with investors likely waiting for clearer signals before making significant moves. Overall, the cryptocurrency market is characterized by a complex interplay of factors, including regulatory developments, technical signals, and macroeconomic trends.
📰 Crypto News
- Bitcoin ETFs shed $90M as BTC sits 32% below year-old ATH
- EEZ tests atomic L1-to-L2 transaction in push to unify Ethereum
- Here’s what happened in crypto today
- Better Markets says CFTC is ‘wrong agency’ to regulate retail crypto
- Rain seeks US trust bank charter days after OCC sued over crypto charters
- OKX eyes emerging markets with yield-offering stablecoin savings and payments app
- Chinese crime network laundered over $1B for Lazarus: ZachXBT
- Crypto PAC announces support for 32 House candidates in US midterms
- FinCEN withdraws proposed crypto mixing rule over ‘legitimate activity’ concerns
- Why bitcoin is down 'just' 32% a year after its record high of $126,000
- U.S. scraps proposed $10,000 reporting rule for for crypto sent to private wallets
- Ethereum’s Glamsterdam test gets last-minute fix before major capacity jump
- Bitcoin keeps getting rejected at $87,000 as stocks hover near records
- Solana Foundation unveils a program to settle institutional trades in seconds. JPMorgan gave input
- Solana Debuts Institutional Settlement Standard With J.P. Morgan Input
🔍 Technical Analysis
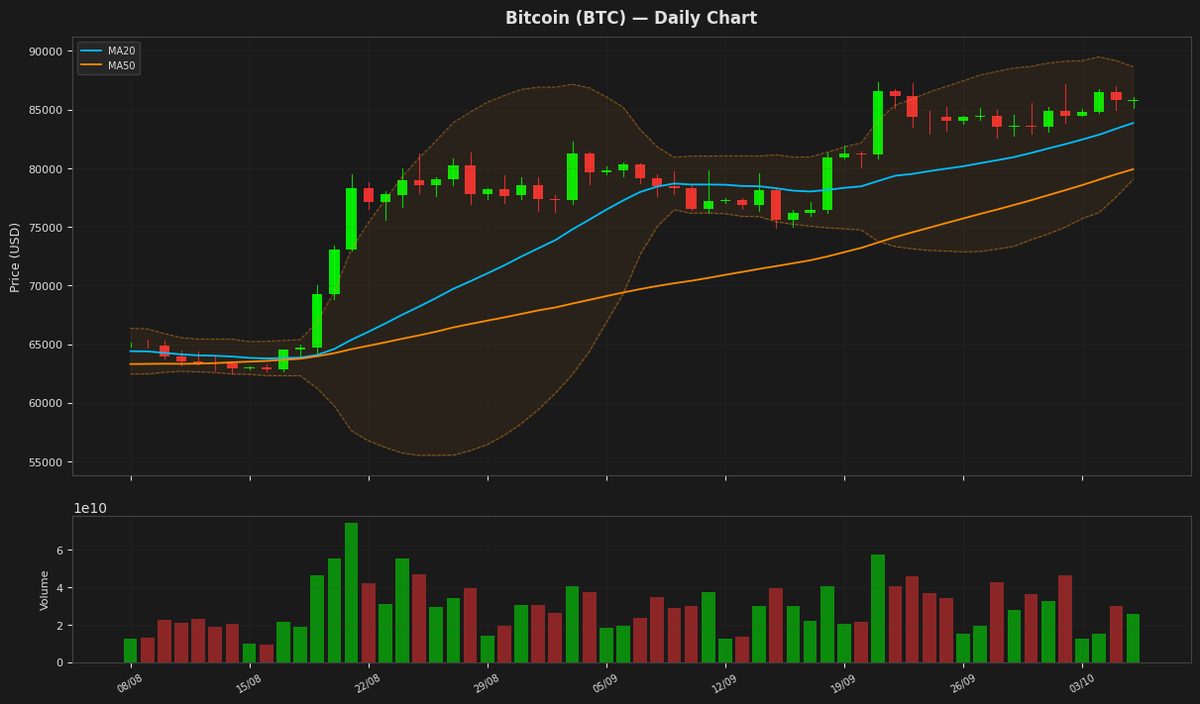
Bitcoin (BTC) — +0.05%
$85,825.20 52W: $57,747.77 — $90,439.29
Bitcoin is currently trading at $85,825 with a minimal daily change, indicating a stable trend. The price is hovering near the MA20 at $83,850 and above the MA50 at $79,913, suggesting a potential uptrend. The RSI at 47.85 indicates a neutral position, neither overbought nor oversold, while the MACD below its signal line suggests a slight bearish divergence. The price is also within the Bollinger Bands, with the upper band at $88,655 and lower band at $79,045.
Ethereum (ETH) — +0.12%
$2,714.18 52W: $1,506.51 — $3,040.72
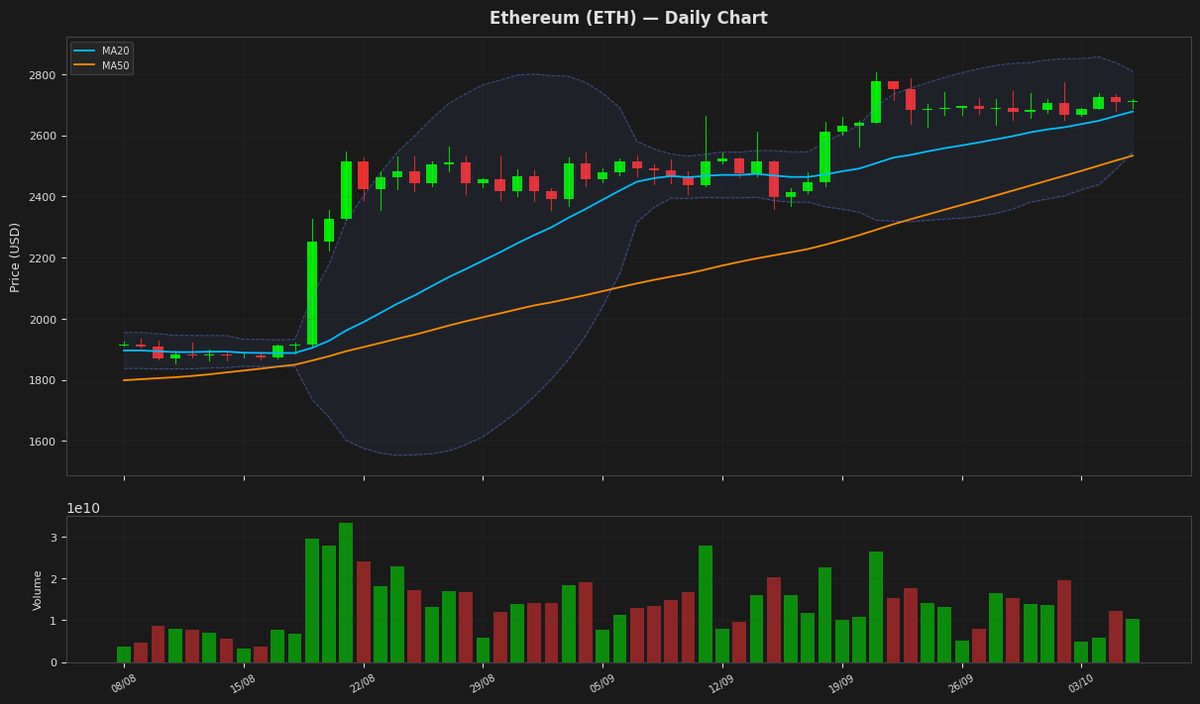
Ethereum's price is currently trading near its 20-day moving average, indicating a lack of clear direction. The RSI is below 50, suggesting a slightly bearish sentiment, while the MACD is below its signal line, indicating a potential short-term downtrend. The Bollinger Bands suggest that the price is still within a relatively stable range, with the upper band at $2810.52 and the lower band at $2546.36. The ATR indicates moderate volatility.
Ripple (XRP) — -0.28%
$1.5032 52W: $0.988422 — $1.9382
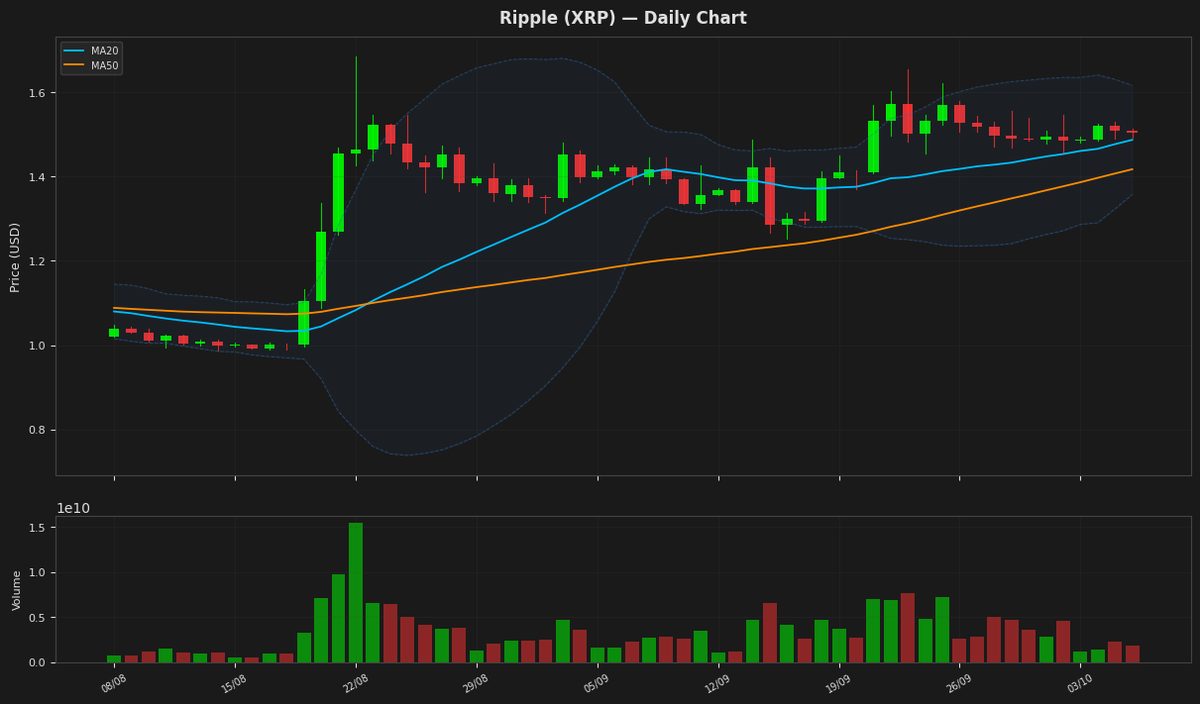
Ripple's price is currently at $1.503200, showing a slight decline, and is positioned between the Bollinger Band upper and lower limits, indicating a relatively stable trend. The RSI is at 38.011982, suggesting that the asset is nearing oversold territory. The MACD is below its signal line, indicating a potential bearish signal. The ATR indicates moderate volatility.
Solana (SOL) — -0.22%
$120.4900 52W: $60.4147 — $127.9663
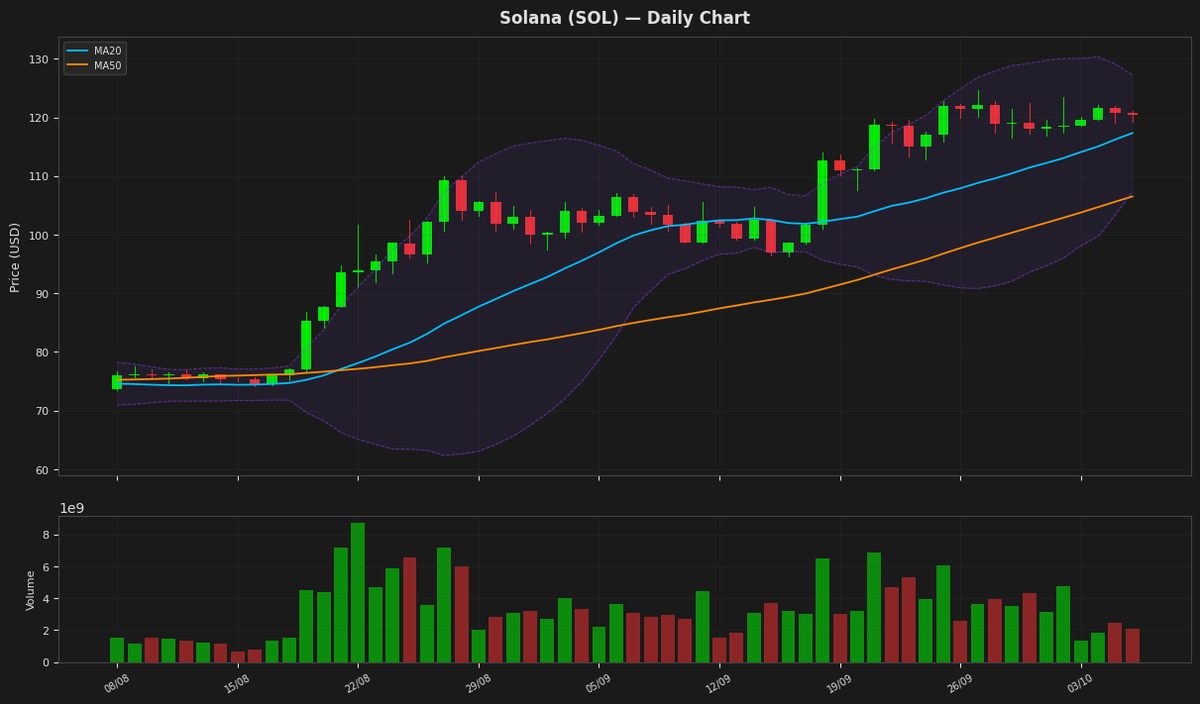
Solana is currently trading at $120.49, maintaining a bullish posture as the price remains above both the 20-day and 50-day moving averages. The asset is trading within its Bollinger Bands with a neutral RSI of 54.75, though the MACD is slightly bearish as it sits below the signal line. With the price approaching the 52-week high of $127.97 and the upper Bollinger Band of $127.28, SOL is facing immediate overhead resistance.
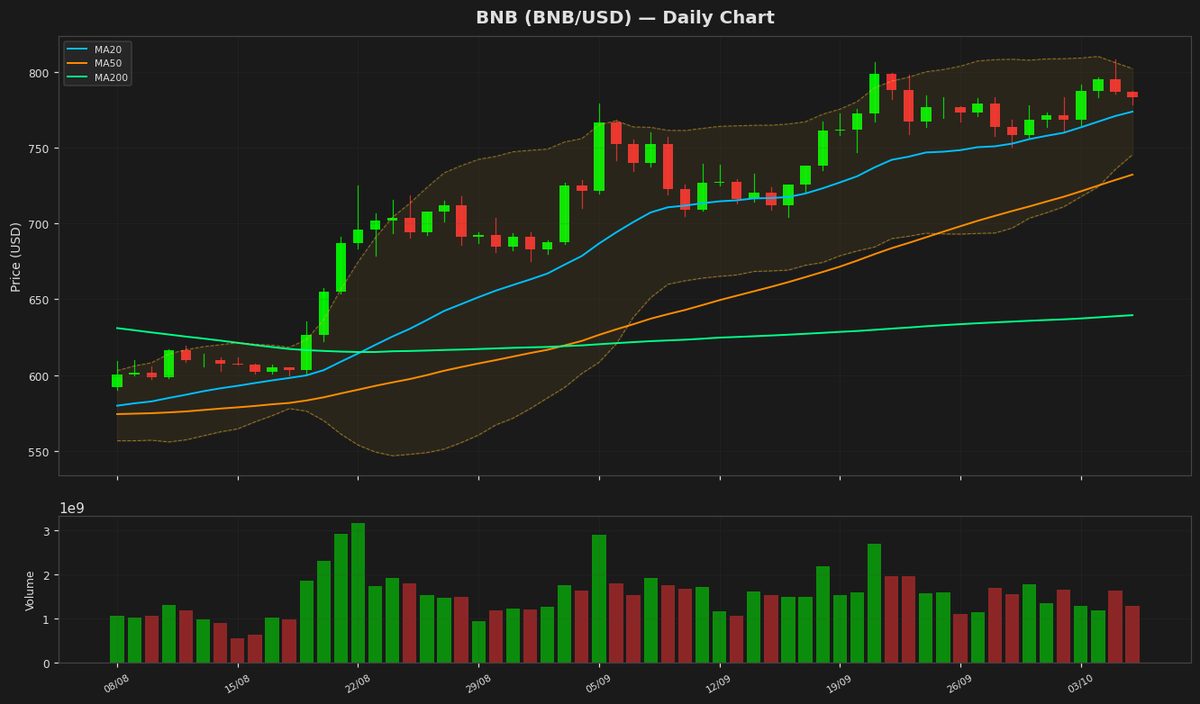
BNB (BNB) — -0.67%
$781.5100 52W: $538.5992 — $907.3658
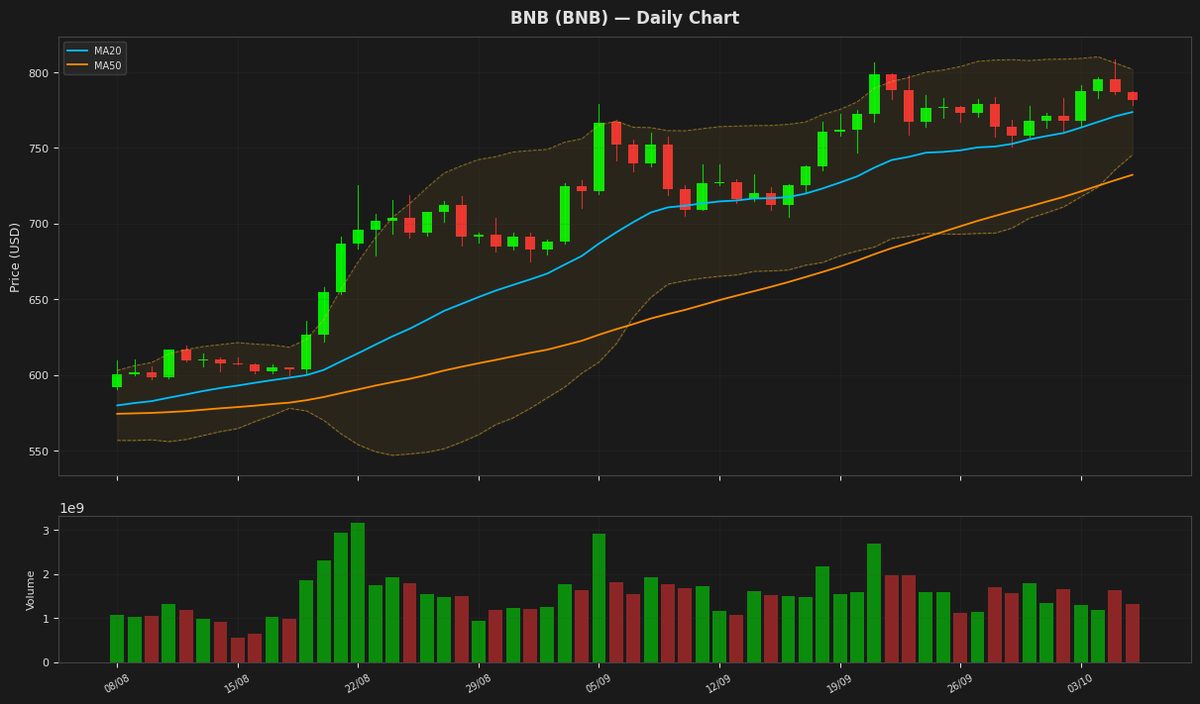
BNB is currently trading at $781.51, slightly above its 20-day moving average of $773.67, indicating a relatively stable short-term trend. The Relative Strength Index (RSI) at 47.17 suggests a neutral market sentiment, while the MACD line being below its signal line may indicate a potential bearish signal. The price is also within the Bollinger Bands, with the upper band at $801.93 and lower band at $745.41.
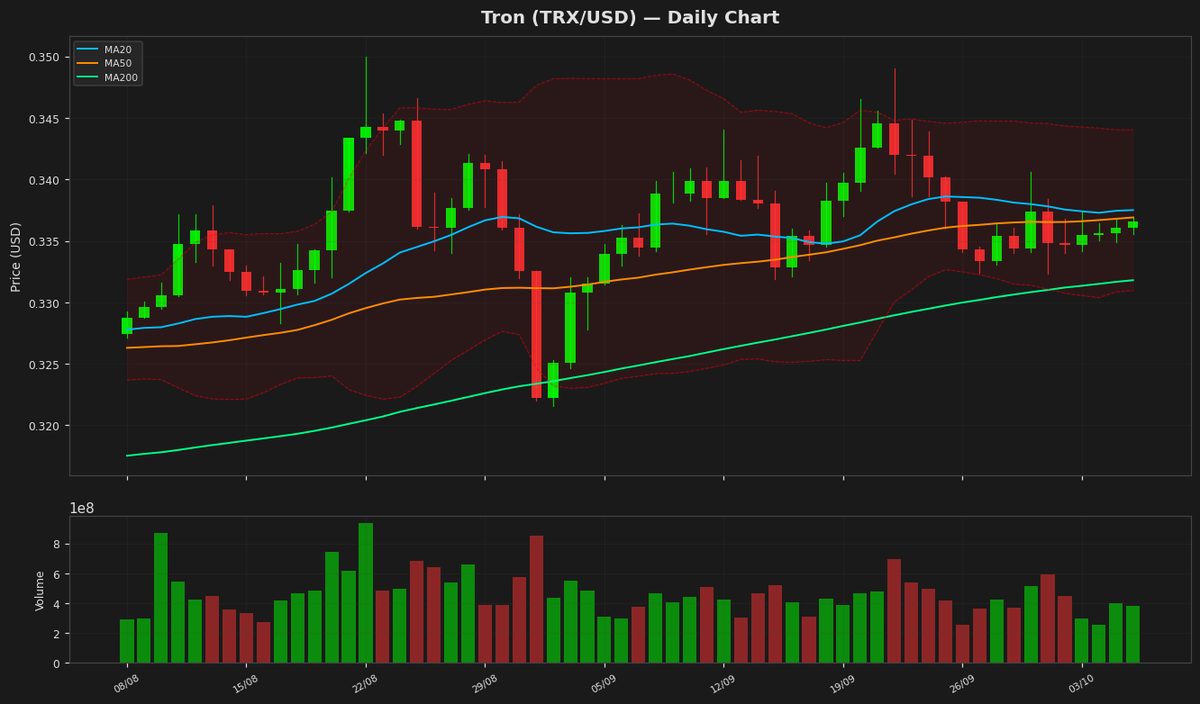
Tron (TRX) — +0.15%
$0.336592 52W: $0.268138 — $0.376332
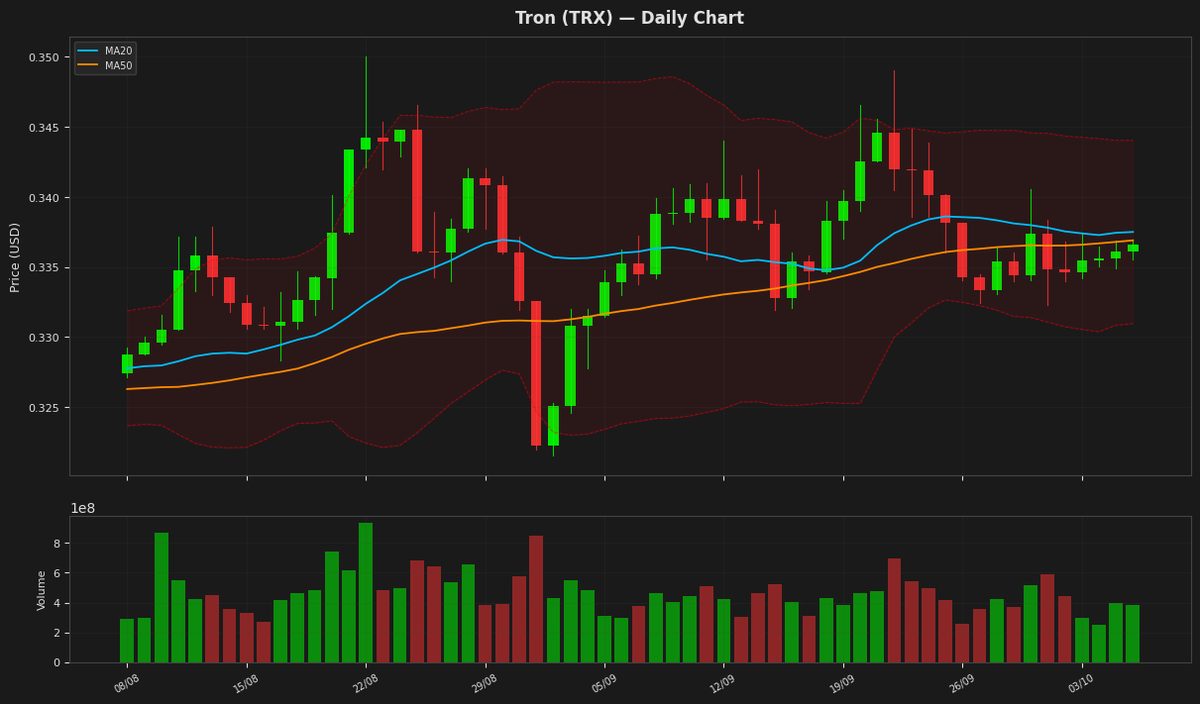
Tron's price is currently at $0.336592, showing a marginal increase of 0.15%. The RSI(14) value of 36.051244 indicates that the asset is nearing oversold territory, while the MACD is negative, suggesting a bearish trend. The Bollinger Bands suggest that the current price is closer to the lower band at $0.330966, indicating potential support.
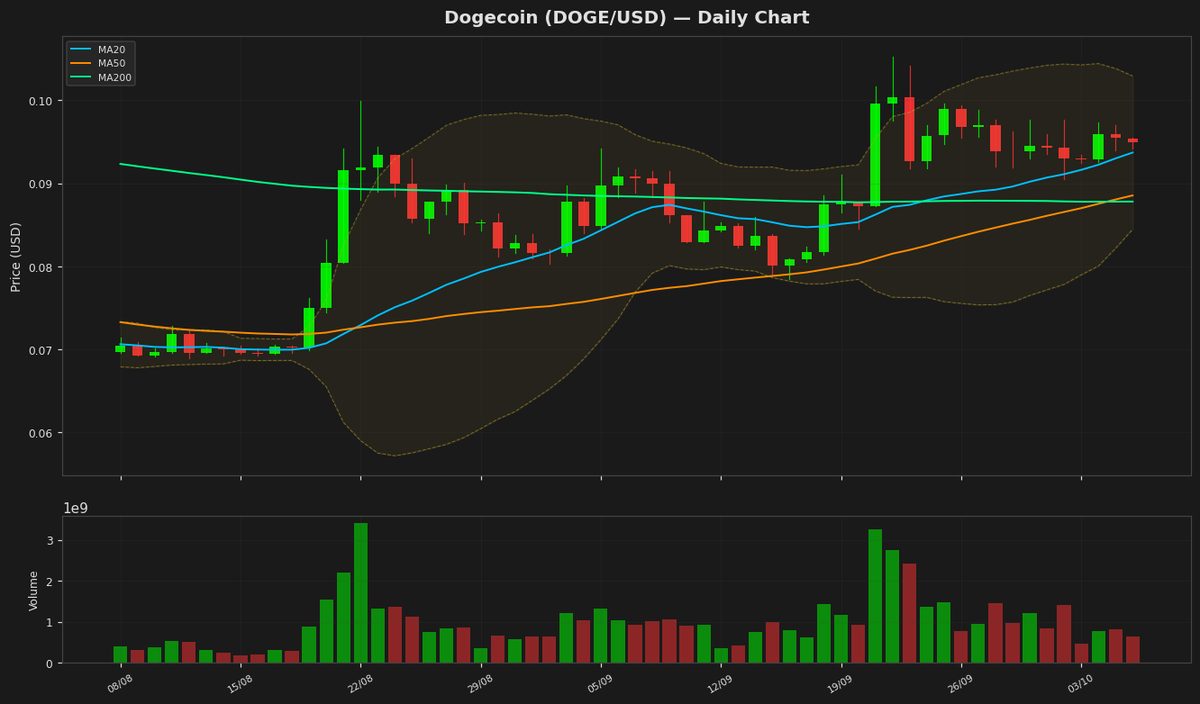
Dogecoin (DOGE) — -0.61%
$0.094850 52W: $0.067973 — $0.127272
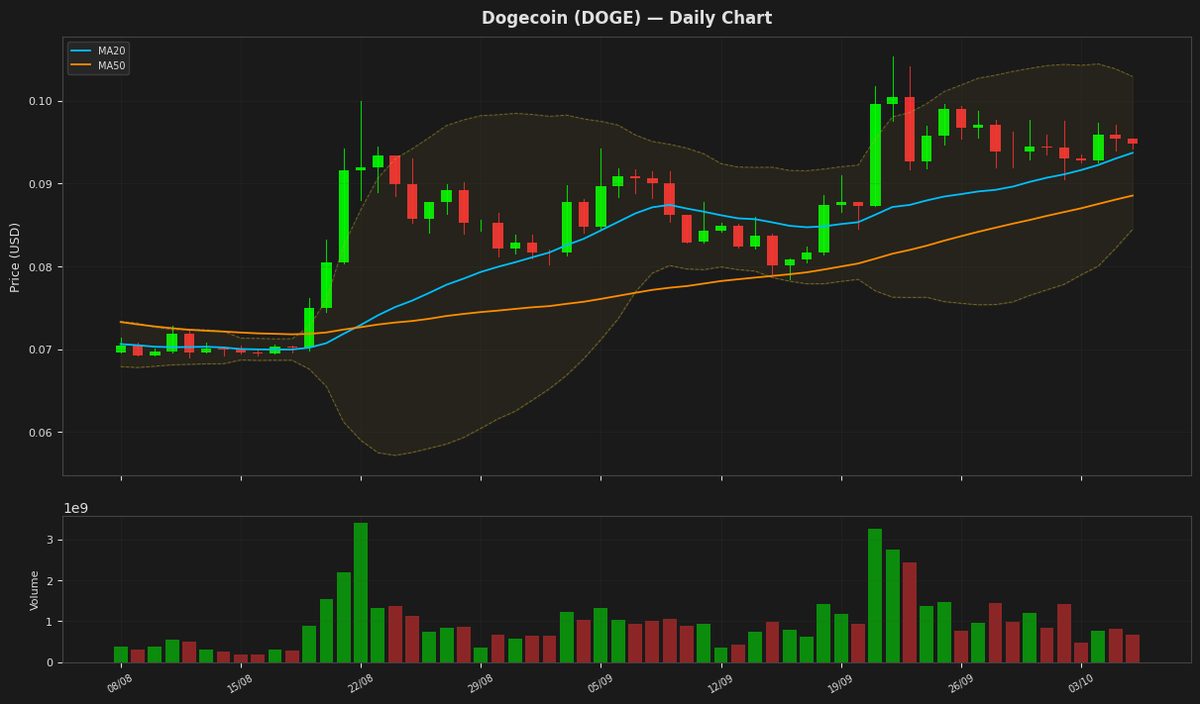
Dogecoin's price is currently at $0.094850, showing a slight decline of 0.61% for the day. The RSI at 39.349013 indicates that the cryptocurrency is nearing oversold territory, while the MACD is below its signal line, suggesting a potential bearish trend. The Bollinger Bands indicate that the price is trading within a range, with the upper band at $0.102914 and lower band at $0.084464. The ATR of 0.00457 suggests relatively low volatility.
Disclaimer
The content on MarketsFN.com is provided for educational and informational purposes only. It does not constitute financial advice or investment recommendations. All investments involve risk. Past performance does not guarantee future results.