Crypto Market Sees Gains: Dogecoin, Solana, and Tron Lead the Charge
QuoteReporter
•5 min read
Crypto Market Report | October 16, 2026
📊 Crypto Market Overview
The cryptocurrency market is currently characterized by a state of cautious consolidation, with major assets exhibiting marginal gains amid a broader backdrop of regulatory developments and institutional financial reporting. Bitcoin remains the dominant anchor, trading at 82,153.15 dollars with a negligible daily change of 0.01 percent. This stability occurs as the macro environment absorbs news of institutional volatility, such as Capital B reporting a 78 million dollar loss for the first half of the year due to Bitcoin impairment charges. Simultaneously, global regulatory frameworks continue to evolve, evidenced by Australia releasing a draft bill to adopt the OECD crypto tax reporting framework.
Among the key movers, Dogecoin leads the growth among top assets with a 1.35 percent increase, followed by Solana at 1.18 percent and Tron at 0.90 percent. Ethereum and Ripple show modest gains of 0.62 percent and 0.57 percent respectively. Despite these slight upticks, technical signals suggest significant bearish pressure or oversold conditions across the board. The Relative Strength Index for Ethereum, Ripple, Solana, and Dogecoin all sit below 35, indicating that these assets have entered oversold territory. Bitcoin maintains a more neutral RSI of 41.7, while Tron stands out with a healthier RSI of 51.1.
The Moving Average Convergence Divergence indicators for most major altcoins, including Ethereum, BNB, and Solana, remain in negative territory, reflecting a lack of strong upward momentum. These technical patterns coincide with a news cycle focused on security breaches and legal disputes, including a judge rejecting a bid to undo a 5 million dollar settlement involving the CFTC and Gemini. Overall, the market is navigating a period of low volatility where technical indicators suggest a struggle to regain bullish momentum despite the current price stability of the primary market leader.
Among the key movers, Dogecoin leads the growth among top assets with a 1.35 percent increase, followed by Solana at 1.18 percent and Tron at 0.90 percent. Ethereum and Ripple show modest gains of 0.62 percent and 0.57 percent respectively. Despite these slight upticks, technical signals suggest significant bearish pressure or oversold conditions across the board. The Relative Strength Index for Ethereum, Ripple, Solana, and Dogecoin all sit below 35, indicating that these assets have entered oversold territory. Bitcoin maintains a more neutral RSI of 41.7, while Tron stands out with a healthier RSI of 51.1.
The Moving Average Convergence Divergence indicators for most major altcoins, including Ethereum, BNB, and Solana, remain in negative territory, reflecting a lack of strong upward momentum. These technical patterns coincide with a news cycle focused on security breaches and legal disputes, including a judge rejecting a bid to undo a 5 million dollar settlement involving the CFTC and Gemini. Overall, the market is navigating a period of low volatility where technical indicators suggest a struggle to regain bullish momentum despite the current price stability of the primary market leader.
📰 Crypto News
- Capital B reports $78M H1 loss driven by Bitcoin impairment charge
- Judge rejects CFTC, Gemini bid to undo $5M settlement
- Here’s what happened in crypto today
- OpenAI model helped itself to testnet crypto, then kept quiet about it
- Balaji’s ‘Singapore of social media’ begins with a wave of bans
- MSCI adopts index exclusion rules that could oust Strategy
- Australia releases draft bill to adopt OECD crypto tax reporting framework
- Scammer loses $4.8M stored on tampered Ledgers: Asia Express
- XRP has failed to make holders rich like bitcoin and ether. Here’s why
- An OpenAI agent ran out of Ethereum funds, and took from a wallet it did not own
- Bitcoin buyers snap up a brief drop below $80,000 as Asian stocks rebound
- Hidden Text, a Fake Mailbox: How Researchers Got Rogue AI Agents to Talk
- Google Says It Just Cracked One of Quantum Computing's Biggest Bottlenecks
- Russia Will Soon Ban Peer-to-Peer Bitcoin Trading, Central Bank Confirms
🔍 Technical Analysis
Bitcoin (BTC) — +0.01%
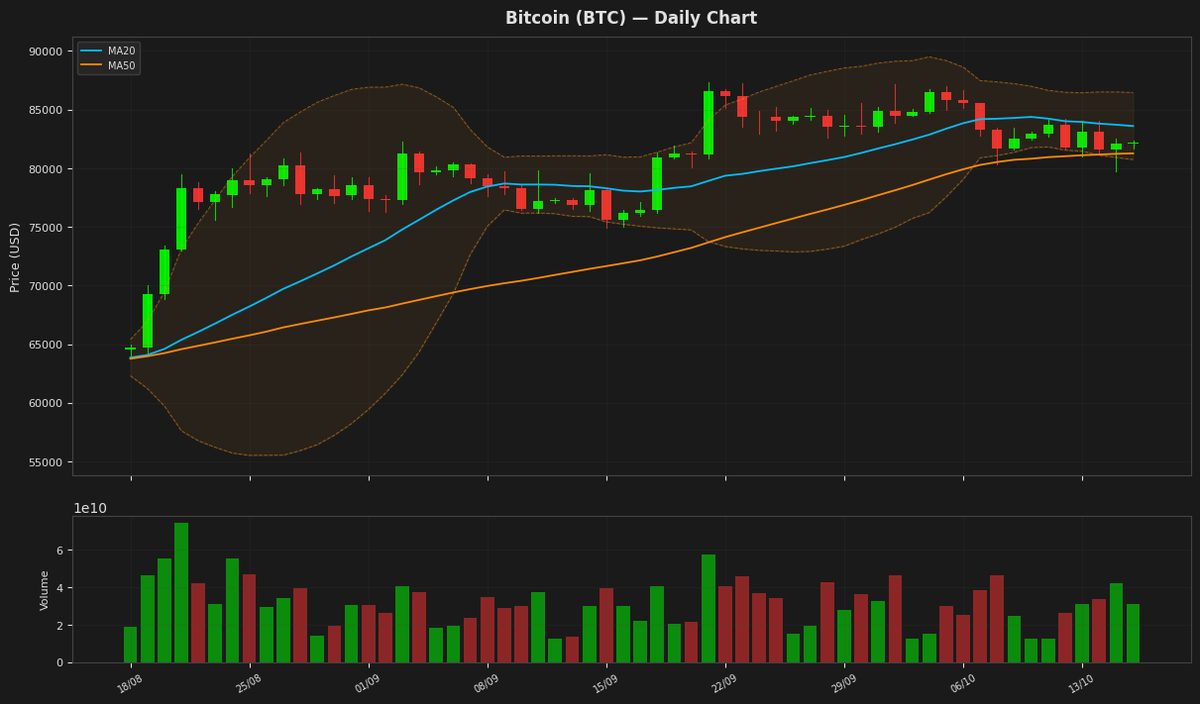
$82,153.16 52W: $57,747.77 — $87,363.76
Bitcoin is currently trading at $82,153.16, remaining within the Bollinger Band range and positioned between the MA20 and MA50. The RSI of 41.72 indicates a neutral to bearish momentum, while the MACD is currently trading below its signal line. With the price sitting below the MA20 of $83,594.02, the asset faces immediate resistance before it can challenge its 52-week high of $87,363.76.
Ethereum (ETH) — +0.62%
$2,455.62 52W: $1,506.51 — $2,805.50
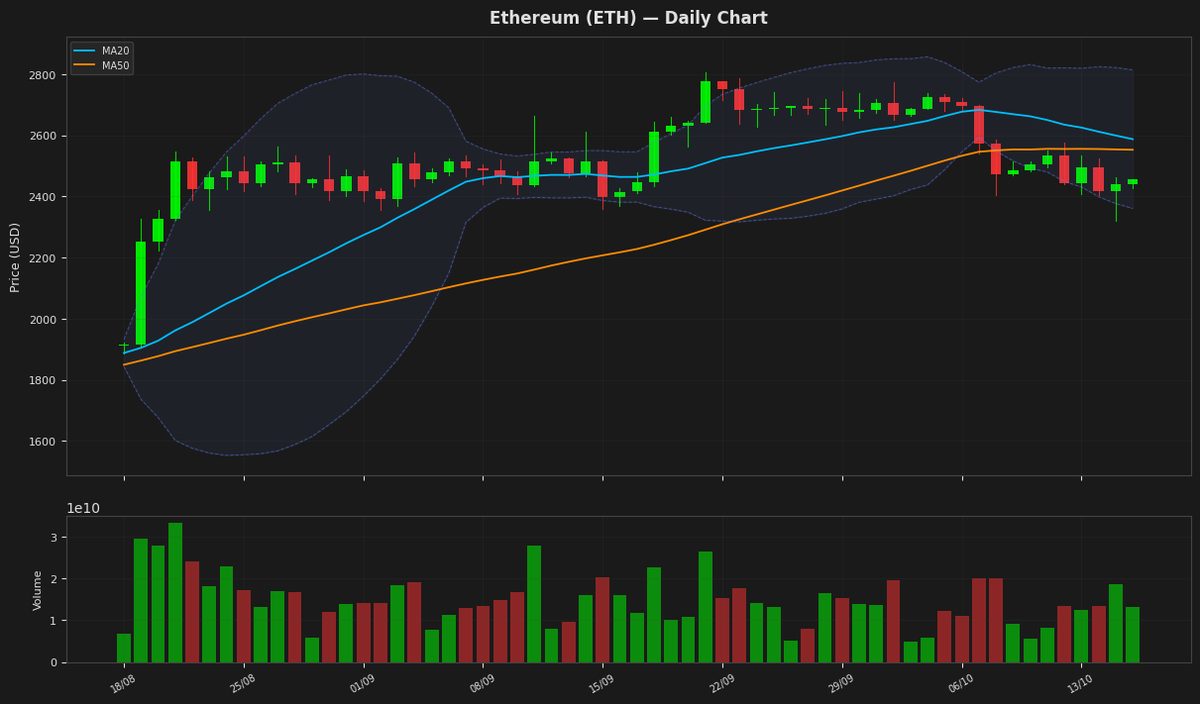
Ethereum is currently trading at $2,455.62, remaining below both its MA20 and MA50, which indicates a prevailing bearish trend. The RSI of 33.24 suggests the asset is approaching oversold territory, while the negative MACD and signal line confirm continued downward momentum. Price action remains contained within the Bollinger Bands, with the lower band at $2,360.96 serving as immediate critical support.
Ripple (XRP) — +0.57%
$1.3408 52W: $0.988422 — $1.6838
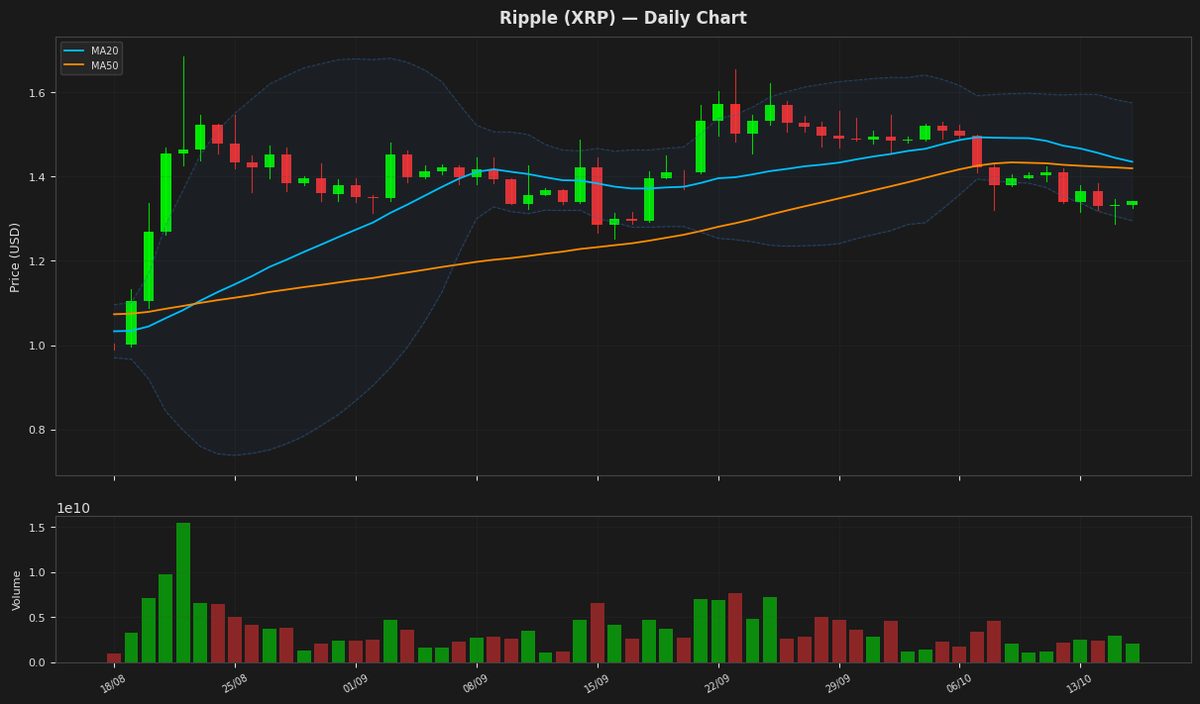
XRP is currently trading at $1.3408, positioned below both its MA20 and MA50, indicating a prevailing bearish trend. The RSI of 29.24 suggests the asset is entering oversold territory, while the MACD remains negative and below the signal line, confirming downward momentum. Price action is currently fluctuating near the lower Bollinger Band of $1.2952, which may serve as immediate critical support.
Solana (SOL) — +1.18%
$106.5700 52W: $60.4147 — $124.6174
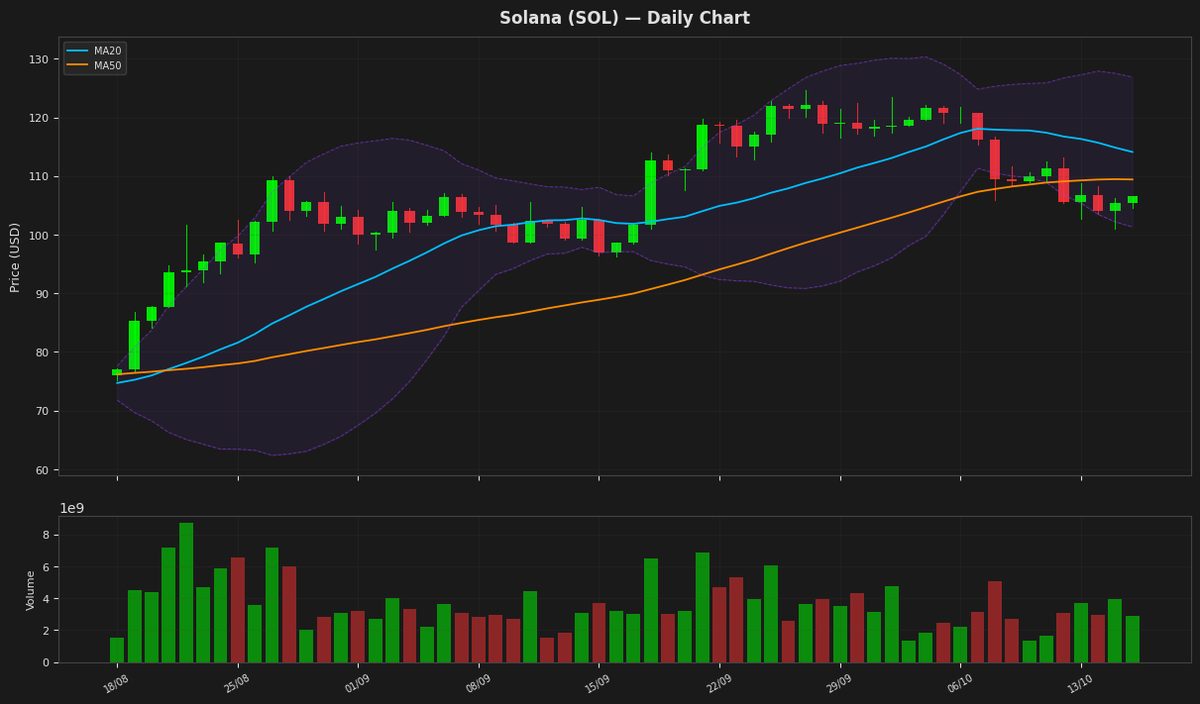
Solana is currently trading at $106.57, remaining below both its MA20 and MA50, which indicates a prevailing short-term bearish trend. The RSI of 29.57 suggests the asset is in oversold territory, while the MACD remains negative and below the signal line, confirming downward momentum. Price action is currently contained within the Bollinger Bands, finding support near the lower band of $101.32.
BNB (BNB) — +0.22%
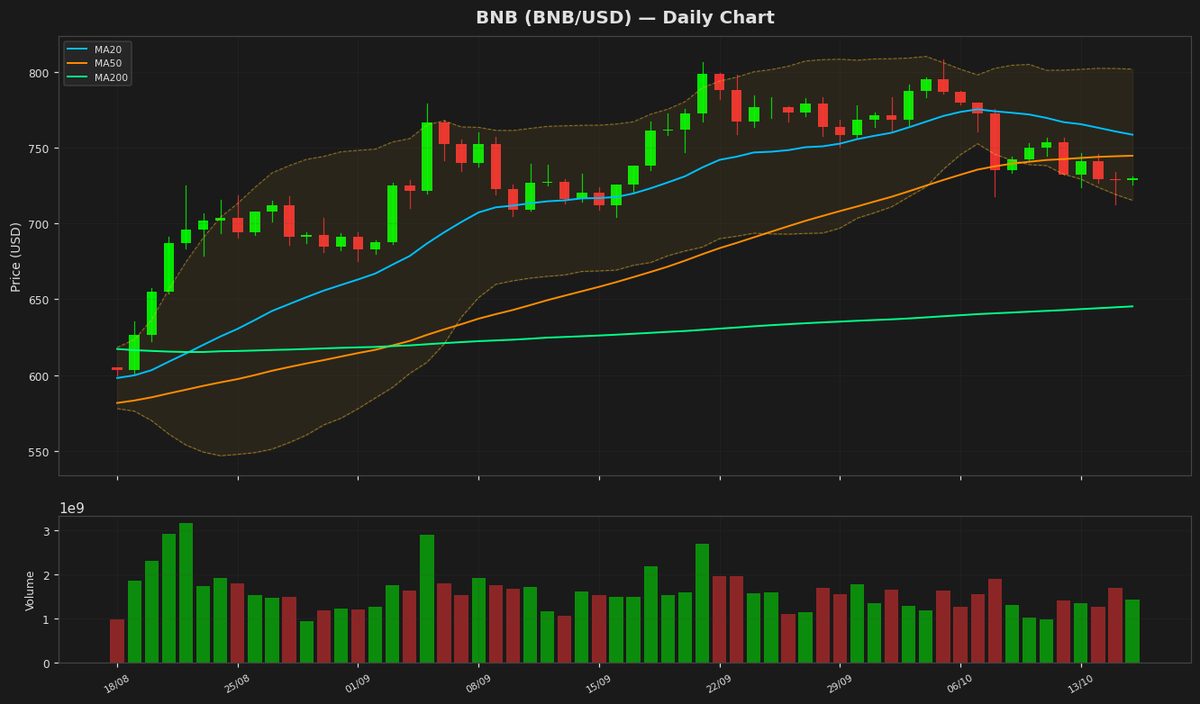
$730.2500 52W: $538.5992 — $808.4329
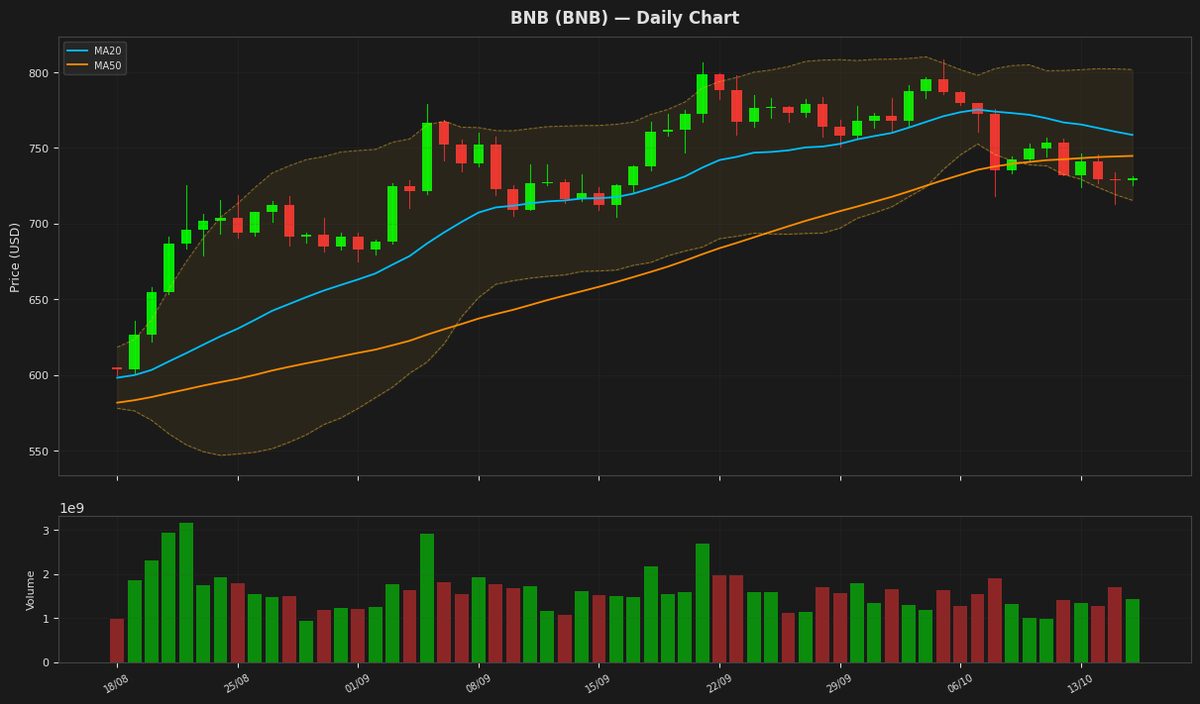
BNB is currently trading at $730.25, positioned below both its 20-day and 50-day moving averages, indicating a short-term bearish trend. The RSI of 37.36 suggests weakening momentum, while a negative MACD and signal line divergence further confirm downward pressure. Price action remains contained within the Bollinger Bands, with the asset trading closer to the lower band of $715.36 than the upper resistance of $801.78.
Tron (TRX) — +0.90%
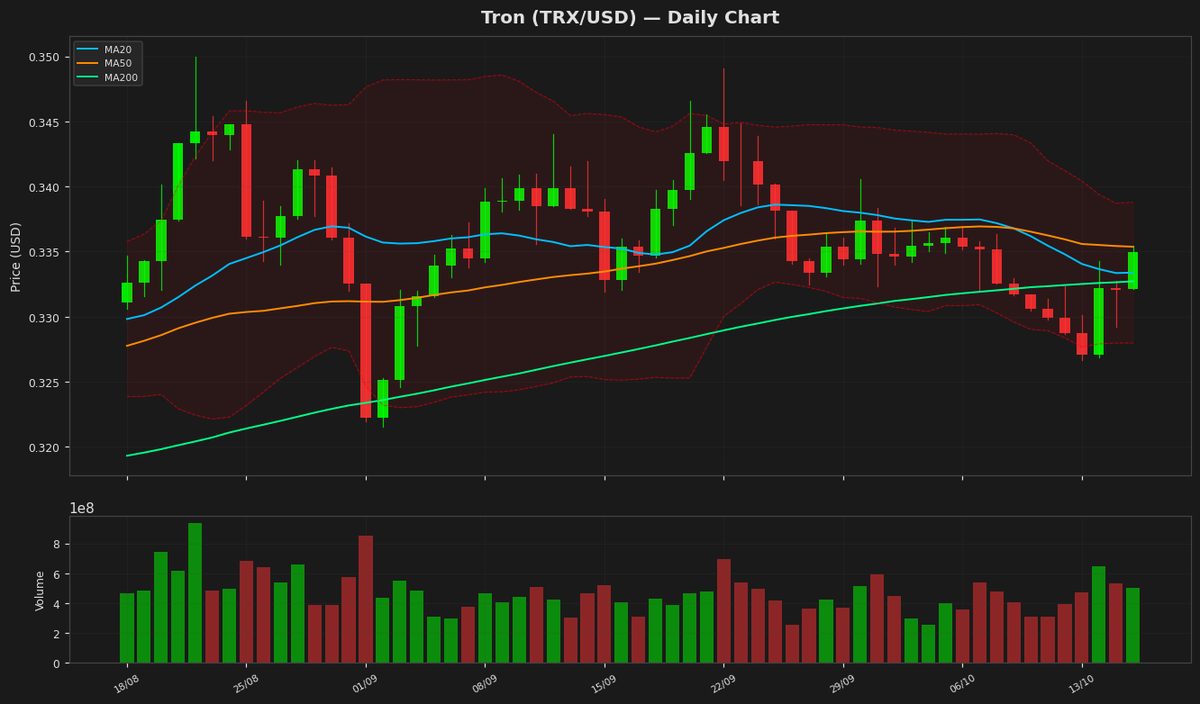
$0.335060 52W: $0.273197 — $0.376332
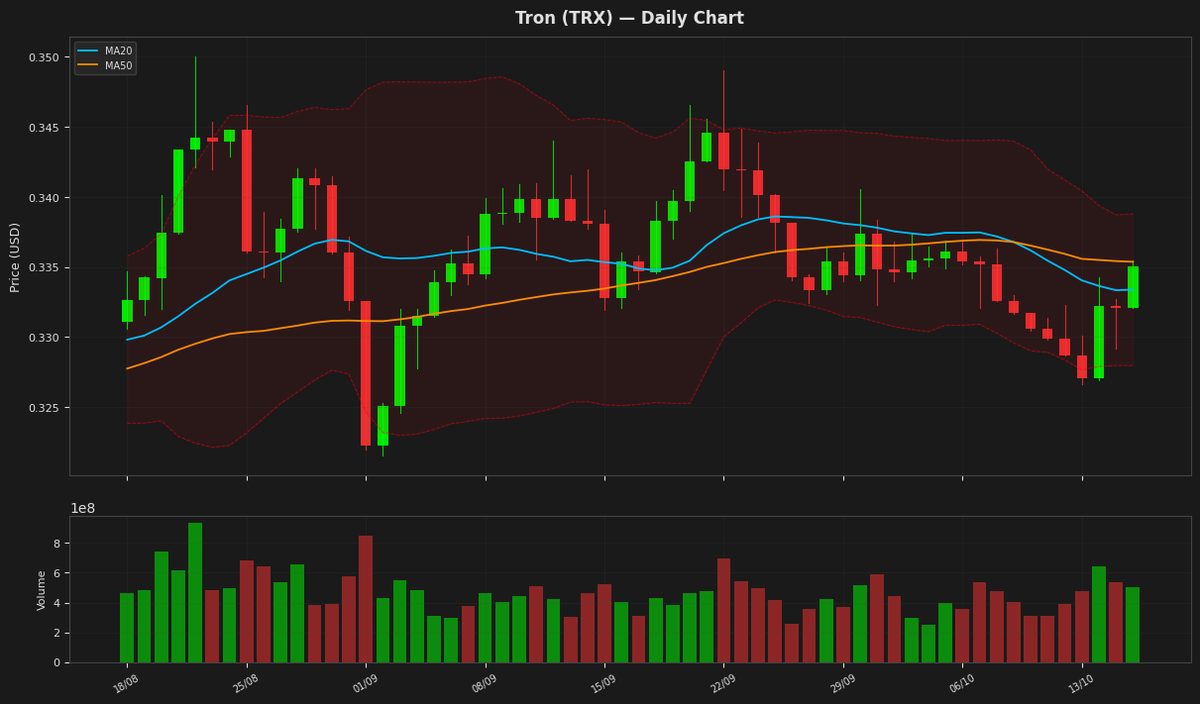
Tron is currently trading at $0.335060, showing a slight daily increase of 0.90% and hovering closely around its MA50 of $0.335373. The RSI of 51.10 indicates a neutral momentum, while the MACD remains slightly negative but is trending above the signal line. Price action is contained within the Bollinger Bands, with a range between $0.327976 and $0.3388, suggesting low volatility as confirmed by the ATR of 0.002957.
Dogecoin (DOGE) — +1.35%
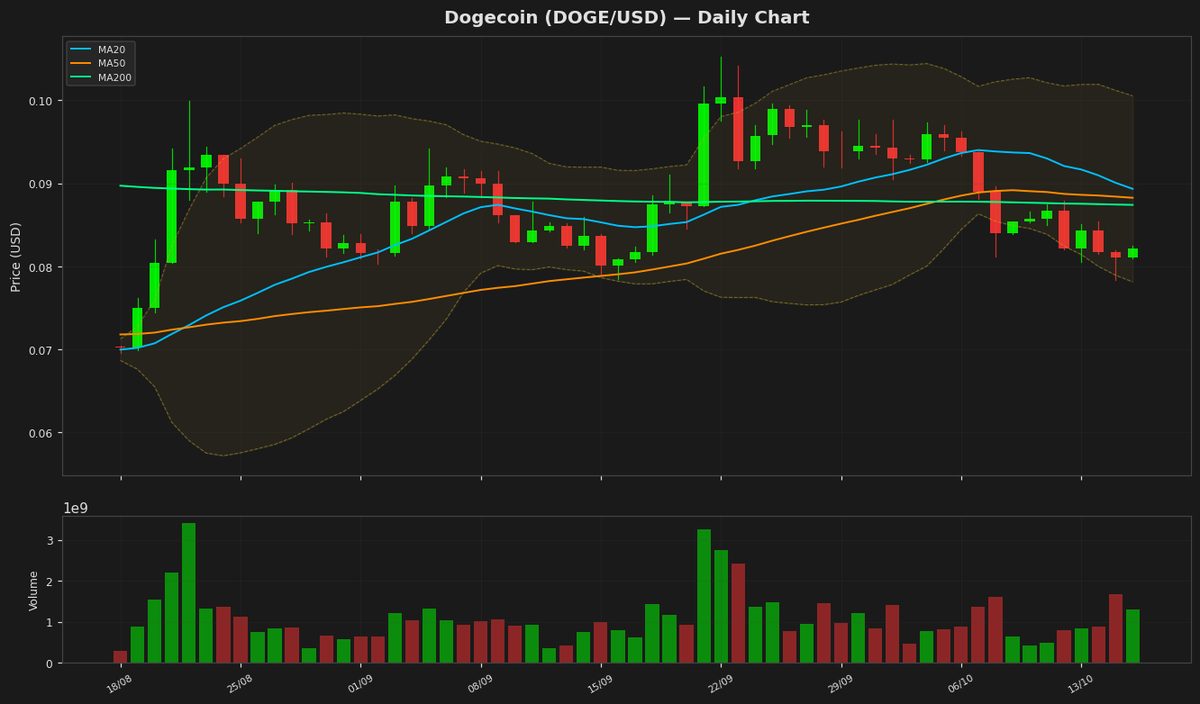
$0.082160 52W: $0.067973 — $0.118255
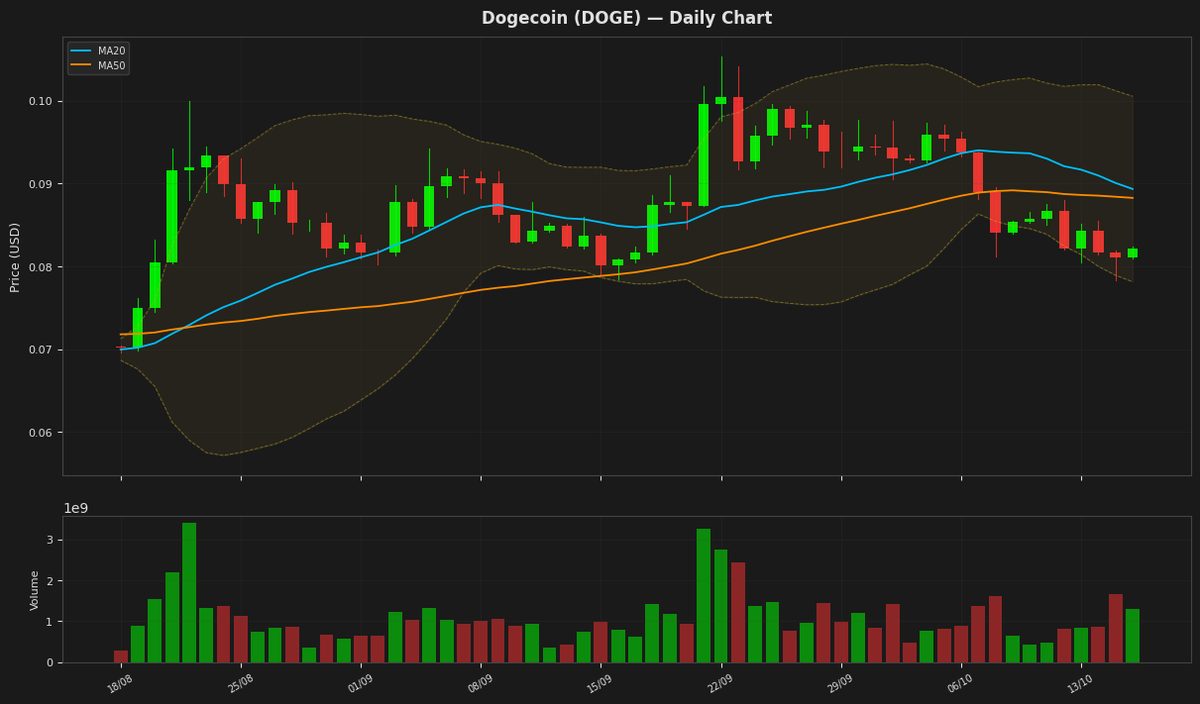
Dogecoin is currently trading at $0.082160, remaining below both the 20-day and 50-day moving averages, which indicates a prevailing bearish trend. The RSI of 31.15 suggests the asset is approaching oversold territory, while the MACD remains negative and below the signal line, confirming downward momentum. Price action is currently contained within the Bollinger Bands, sitting closer to the lower support level of $0.078129.
Disclaimer
The content on MarketsFN.com is provided for educational and informational purposes only. It does not constitute financial advice or investment recommendations. All investments involve risk. Past performance does not guarantee future results.