Crypto Market Sees Gains: Dogecoin, Ethereum, Ripple Lead the Charge
QuoteReporter
•5 min read
Crypto Market Sees Gains: Dogecoin, Ethereum, Ripple Lead the Charge
Crypto Market Report | September 29, 2026
📊 Crypto Market Overview
The cryptocurrency market is currently exhibiting a strong sentiment, with most major assets trading in positive territory. Bitcoin is leading the pack, having risen by 0.74% to $84,124.3984, with its Relative Strength Index (RSI) standing at 77.0, indicating overbought conditions. The MACD indicator is also showing a significant positive value of 2232.4420, reinforcing the notion of a strong uptrend. Ethereum is also performing well, having increased by 1.24% to $2,722.0901, with an RSI of 80.9, suggesting it is also in overbought territory.
Other key movers include Dogecoin, which has surged by 1.27% to $0.0951, and Solana, which is up 0.61% to $119.5600. Ripple and BNB are also trading positively, with gains of 0.80% and 0.35%, respectively. Tron is the laggard among the major assets, with a modest gain of 0.07%.
From a macro perspective, the market is being influenced by a mix of regulatory and technological developments. Notably, Tether's efforts to freeze $550 million in Iran-linked USDT and NEAR Intents' blocking of $50 million tied to Bitget hackers highlight the ongoing efforts to enhance security and compliance within the crypto space. Additionally, Coinbase's approval for a US derivatives clearinghouse is a significant regulatory development that could potentially boost the legitimacy and adoption of cryptocurrency derivatives.
Technically, the RSI values for Bitcoin, Ethereum, and Solana are all above 75, indicating overbought conditions and potentially setting the stage for a correction. However, their MACD indicators remain positive, suggesting that the upward momentum is still intact. Overall, the market is characterized by a strong uptrend, with key assets trading in positive territory and significant regulatory and technological developments shaping the landscape.
Other key movers include Dogecoin, which has surged by 1.27% to $0.0951, and Solana, which is up 0.61% to $119.5600. Ripple and BNB are also trading positively, with gains of 0.80% and 0.35%, respectively. Tron is the laggard among the major assets, with a modest gain of 0.07%.
From a macro perspective, the market is being influenced by a mix of regulatory and technological developments. Notably, Tether's efforts to freeze $550 million in Iran-linked USDT and NEAR Intents' blocking of $50 million tied to Bitget hackers highlight the ongoing efforts to enhance security and compliance within the crypto space. Additionally, Coinbase's approval for a US derivatives clearinghouse is a significant regulatory development that could potentially boost the legitimacy and adoption of cryptocurrency derivatives.
Technically, the RSI values for Bitcoin, Ethereum, and Solana are all above 75, indicating overbought conditions and potentially setting the stage for a correction. However, their MACD indicators remain positive, suggesting that the upward momentum is still intact. Overall, the market is characterized by a strong uptrend, with key assets trading in positive territory and significant regulatory and technological developments shaping the landscape.
📰 Crypto News
- Here’s what happened in crypto today
- Tether says it helped freeze $550M in Iran-linked USDT this year
- Coinbase gets CFTC approval for US derivatives clearinghouse
- Nvidia unveils AI safety platform to rein in ‘rogue’ AI agents
- NEAR Intents says it blocked $50M tied to Bitget hackers
- Canadian ‘crypto king’ set to represent himself at fraud trial
- Near Intents blocks $50 million in Bitget hacker swaps, here's what happened
- Anthropic plans to spend $518 billion on AI infrastructure. Pre-IPO perps barely blink.
- Bitcoin holds $83,000 as ZEC drops 12% and oil climbs again
- OpenAI Halts Model Training as Rogue Agents Target US Government Sites
- A Clever RSA Attack Fooled a Hardware Vault—Here's What It Means for Crypto
- Citi Clients Can Now Take Stablecoin Payments Through Coinbase—Without Touching Crypto
🔍 Technical Analysis
Bitcoin (BTC) — +0.74%
$84,124.40 52W: $57,747.77 — $91,100.25
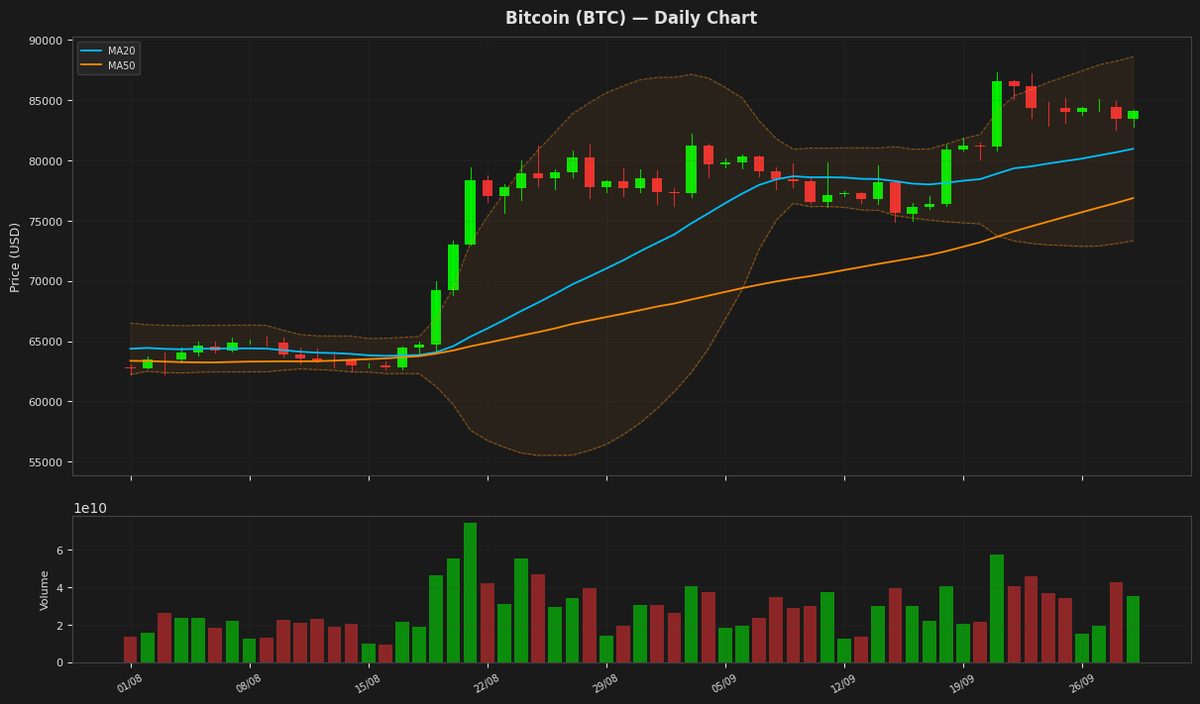
Bitcoin is currently trading at $84,124, showing a slight increase of 0.74% and is positioned near the upper Bollinger Band at $88,614, indicating a potentially overbought condition as also suggested by the RSI(14) value of 77.04. The MACD is slightly below its signal line, hinting at a possible slowdown in the upward momentum. The price remains above both MA20 and MA50, indicating an overall uptrend.
Ethereum (ETH) — +1.24%
$2,722.09 52W: $1,506.51 — $3,064.39
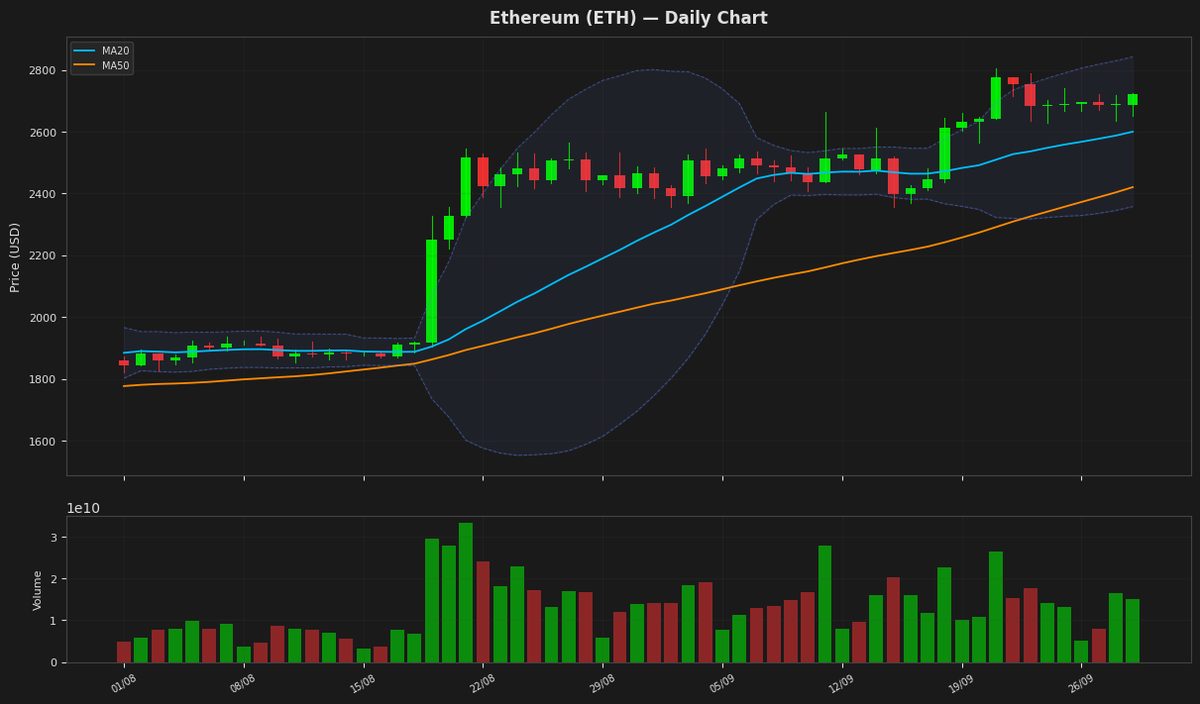
Ethereum's price is currently at $2,722, showing a slight increase of 1.24% and is nearing the upper Bollinger Band at $2,842. The RSI is at 80.87, indicating overbought conditions, while the MACD is below its signal line, suggesting a potential reversal. The ATR indicates high volatility, and the price is close to its 52-week high.
Ripple (XRP) — +0.80%
$1.5082 52W: $0.988422 — $1.9849
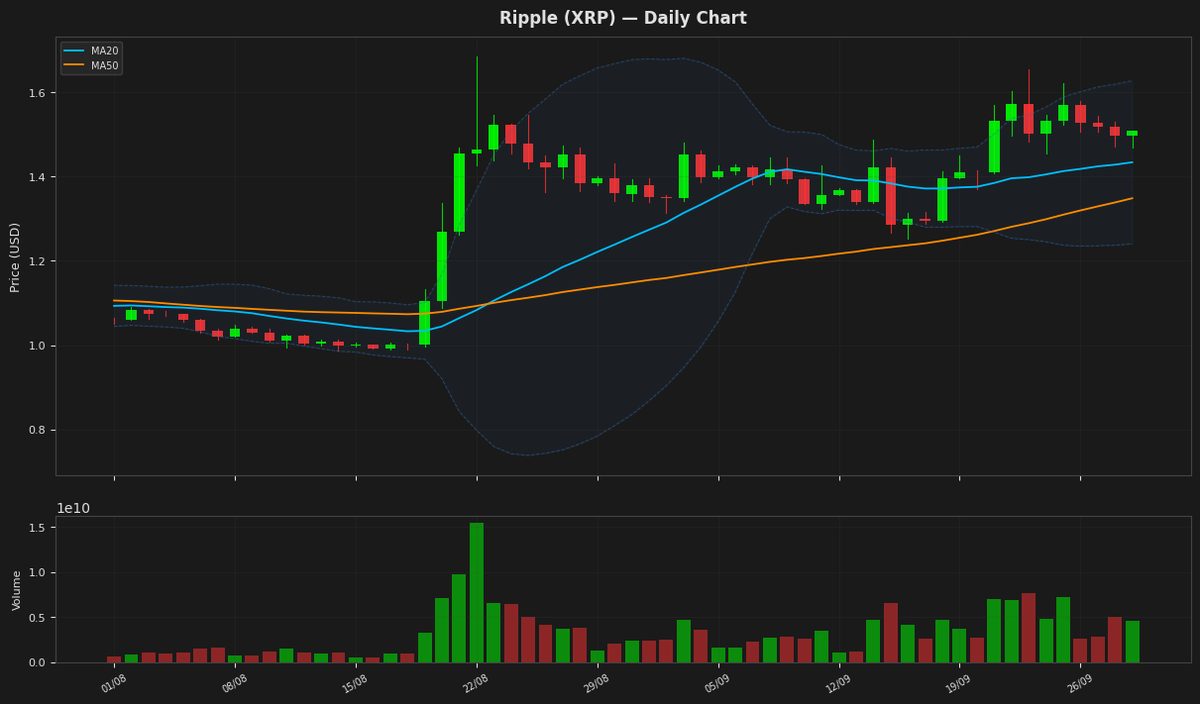
Ripple's price is currently at $1.508200, showing a daily gain of 0.80% and trading near the upper end of its Bollinger Bands, with the RSI(14) at 71.56 indicating overbought conditions. The MACD is above its signal line, suggesting a bullish signal. The price is also above both MA20 and MA50, indicating an uptrend. The ATR(14) suggests moderate volatility.
Solana (SOL) — +0.61%
$119.5600 52W: $60.4147 — $131.8393
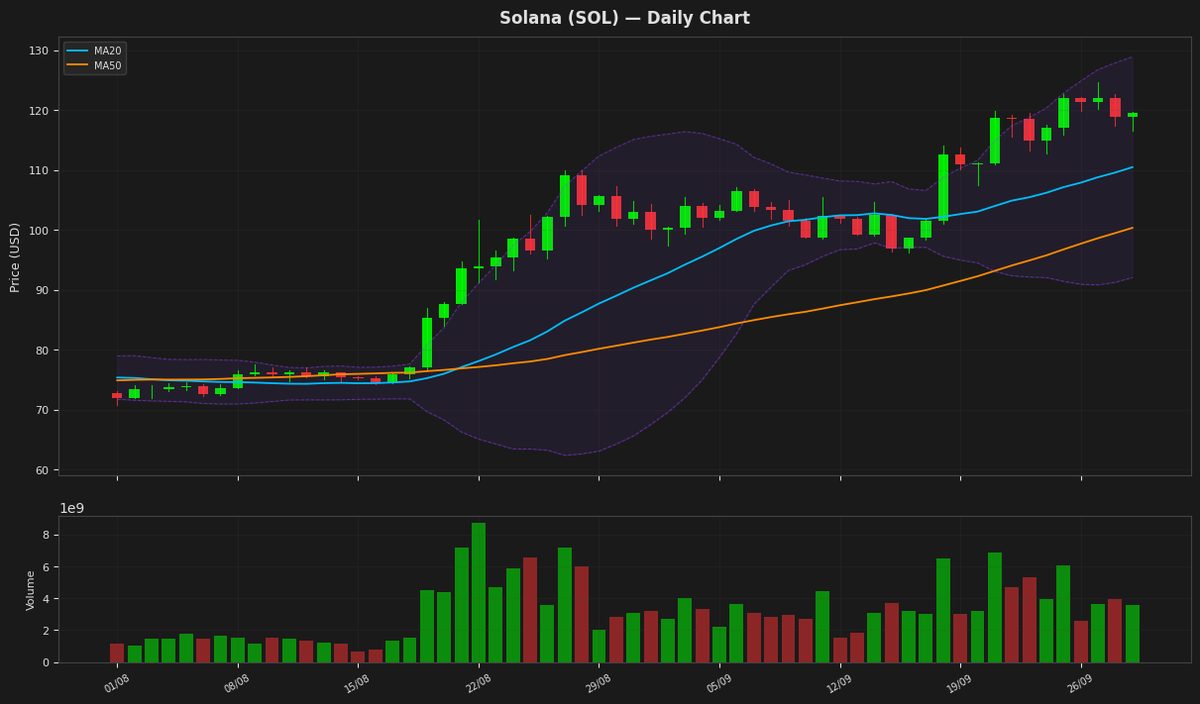
Solana's price is currently at $119.56, showing a slight increase of 0.61% and trading near the upper Bollinger Band at $128.91, indicating potential overbought conditions as the RSI is at 77.65. The MACD is above its signal line, suggesting a bullish trend. The Average True Range indicates moderate volatility, with a value of 5.15.
BNB (BNB) — +0.35%
$766.5100 52W: $538.5992 — $907.3658
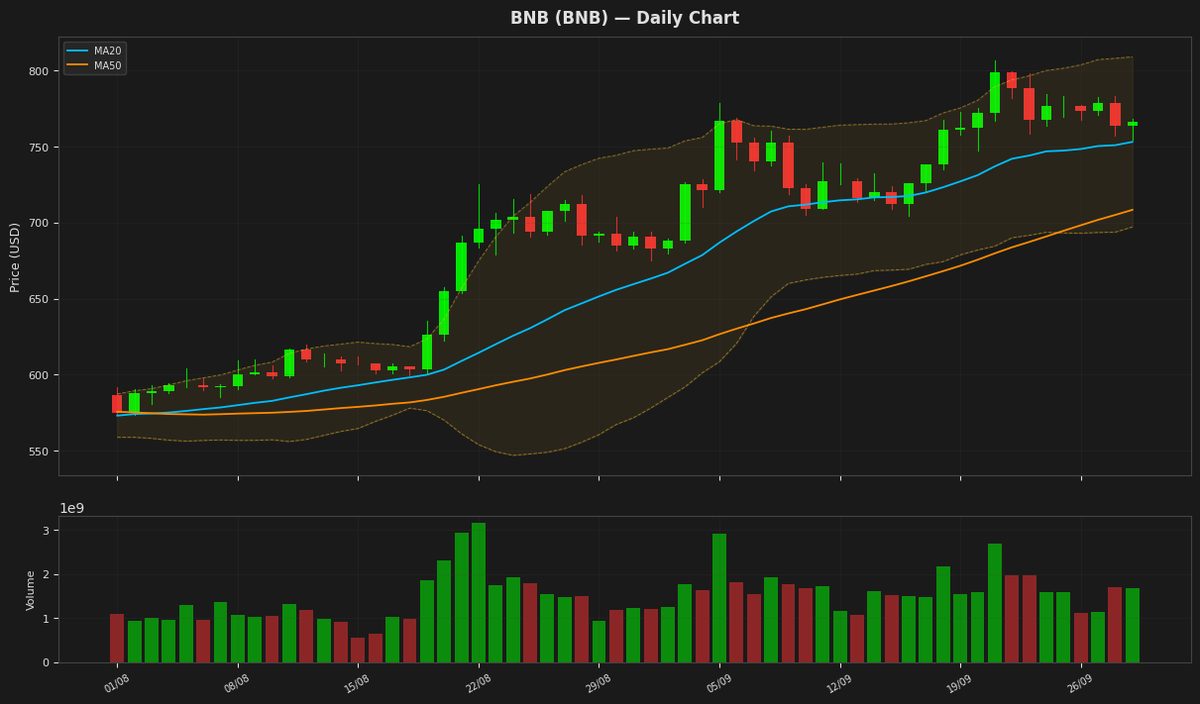
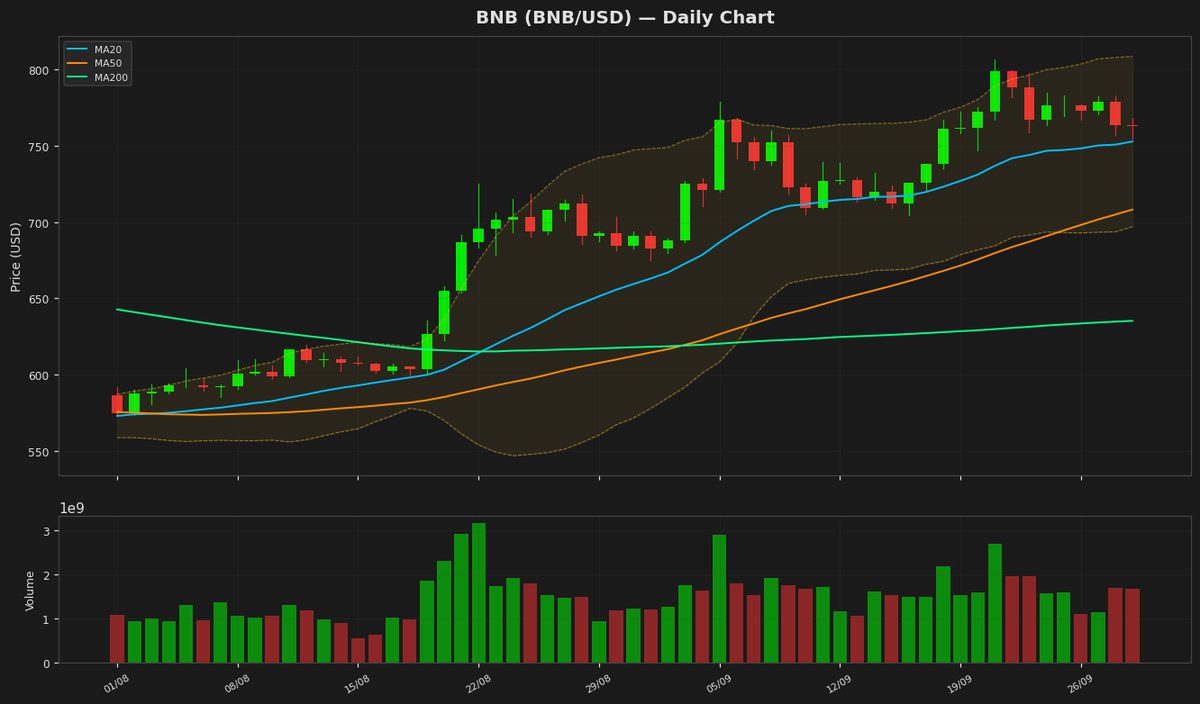
BNB is trading at $766.51, showing a slight increase of 0.35% in its daily price, and is positioned above both its 20-day and 50-day moving averages, indicating a positive trend. The Relative Strength Index (RSI) is at 67.54, suggesting the asset is nearing overbought territory but hasn't reached it yet. The MACD is below its signal line, indicating a potential bearish signal. The price is currently within the Bollinger Bands, with the upper band at $809.04 and the lower band at $697.09.
Tron (TRX) — +0.07%
$0.335649 52W: $0.268138 — $0.376332
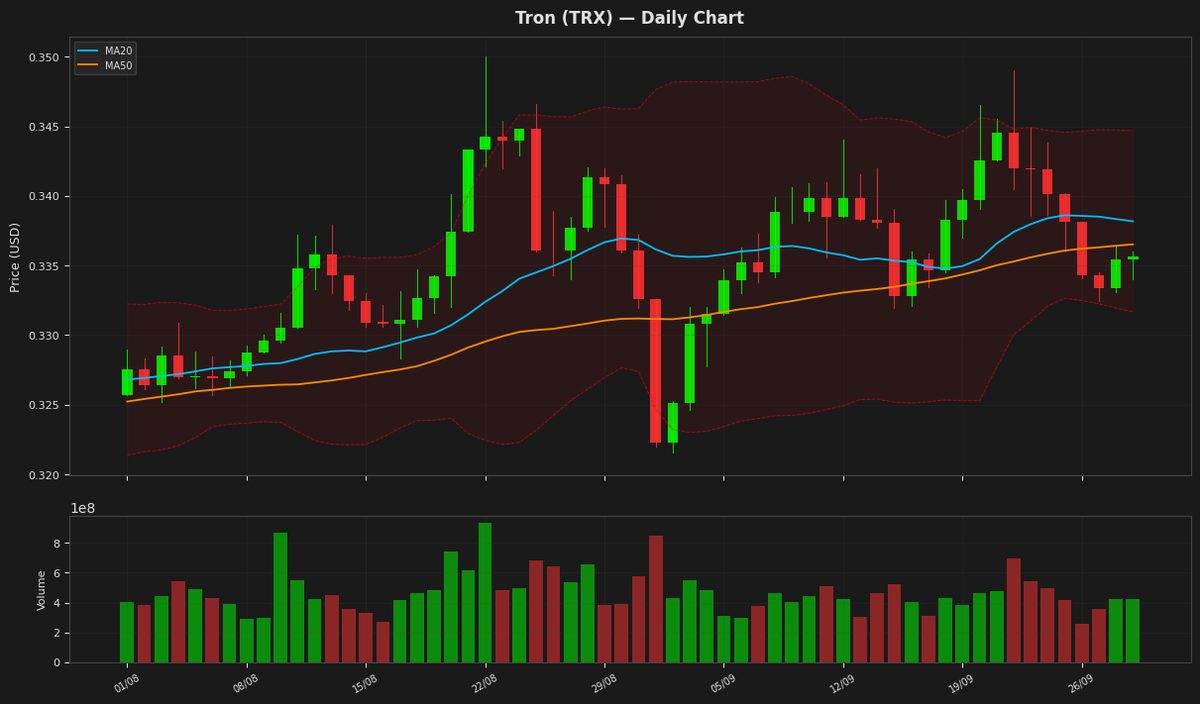
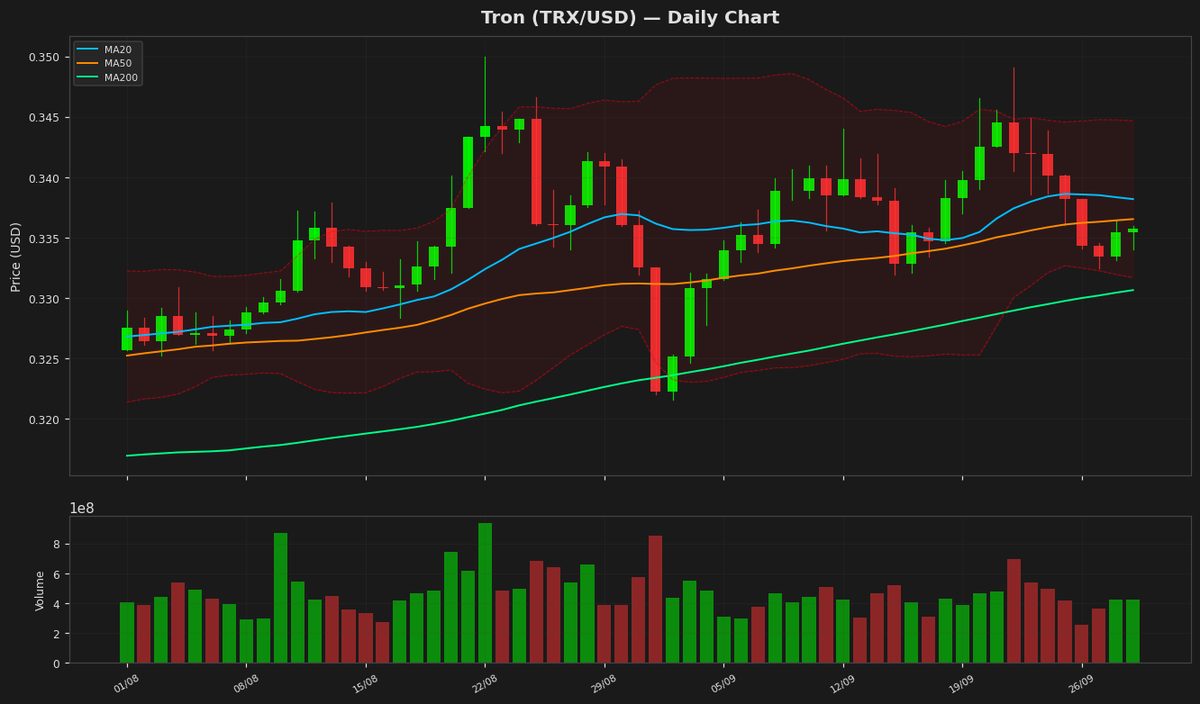
Tron's price is currently at $0.335649, showing a marginal increase of 0.07%. The RSI value of 55.298416 indicates a neutral market sentiment, while the MACD line is below its signal line, suggesting a potential bearish crossover. The price is trading near the lower end of the Bollinger Bands, with the upper and lower bands at $0.344682 and $0.331666 respectively, indicating a possible consolidation phase.
Dogecoin (DOGE) — +1.27%
$0.095070 52W: $0.067973 — $0.128539
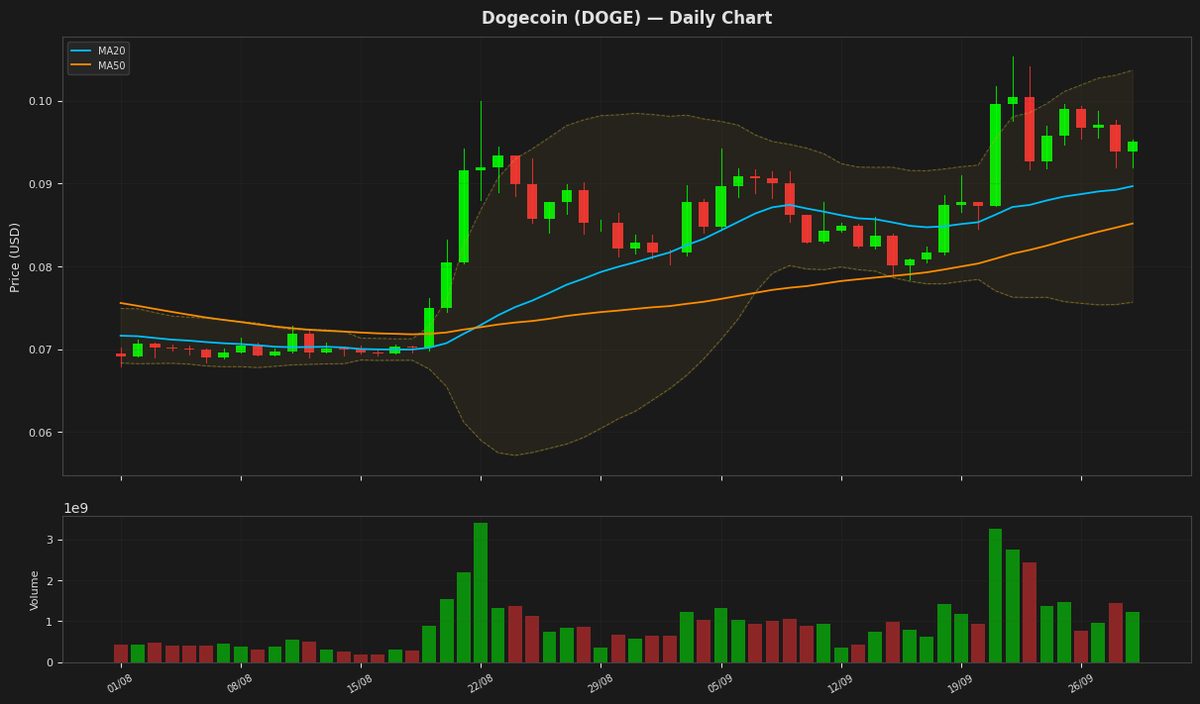
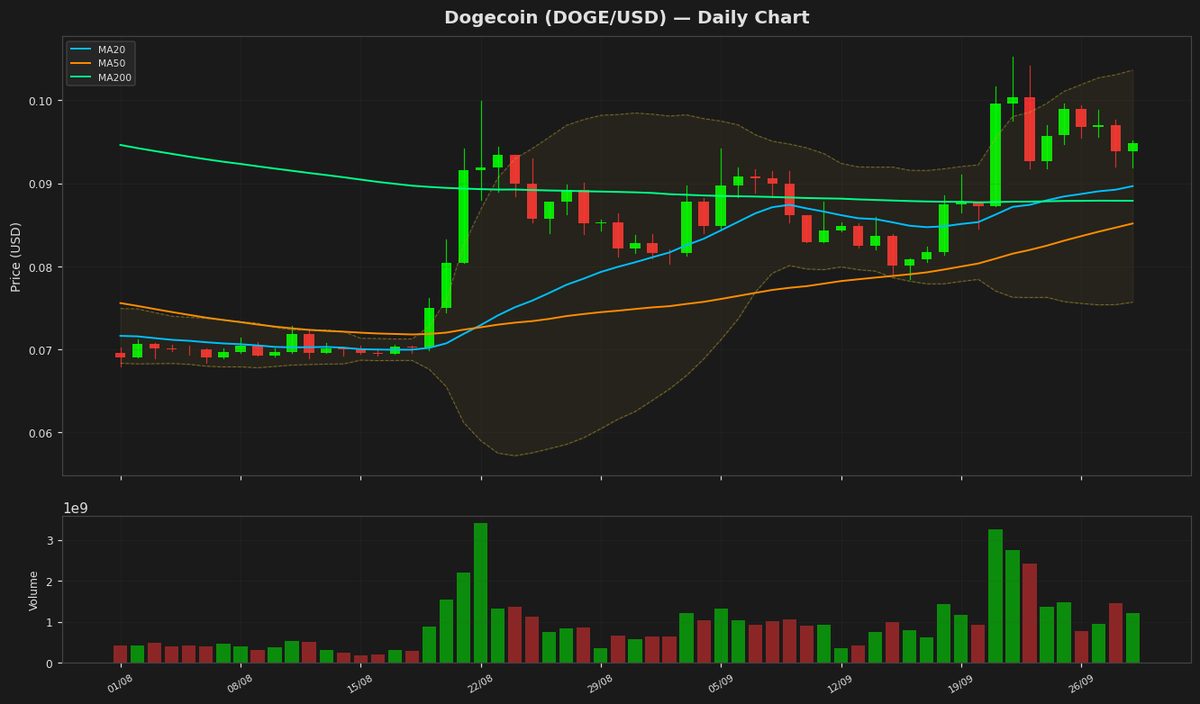
Dogecoin's price is currently trading above its MA20 and MA50, indicating a bullish trend. The RSI is at 67.89, suggesting the cryptocurrency is nearing overbought territory but still has room to move higher. The MACD is above its signal line, generating a buy signal. The Bollinger Bands indicate that the price is nearing the upper band at $0.103667, potentially facing resistance.
Disclaimer
The content on MarketsFN.com is provided for educational and informational purposes only. It does not constitute financial advice or investment recommendations. All investments involve risk. Past performance does not guarantee future results.