Tron Holds Steady at $0.3357 as RSI Signals Balance
QuoteReporter
•2 min read
Tron Holds Steady at $0.3357 as RSI Signals Balance
Tron (TRX/USD) | September 29, 2026 $0.3357 +0.09%
🔍 Technical Analysis
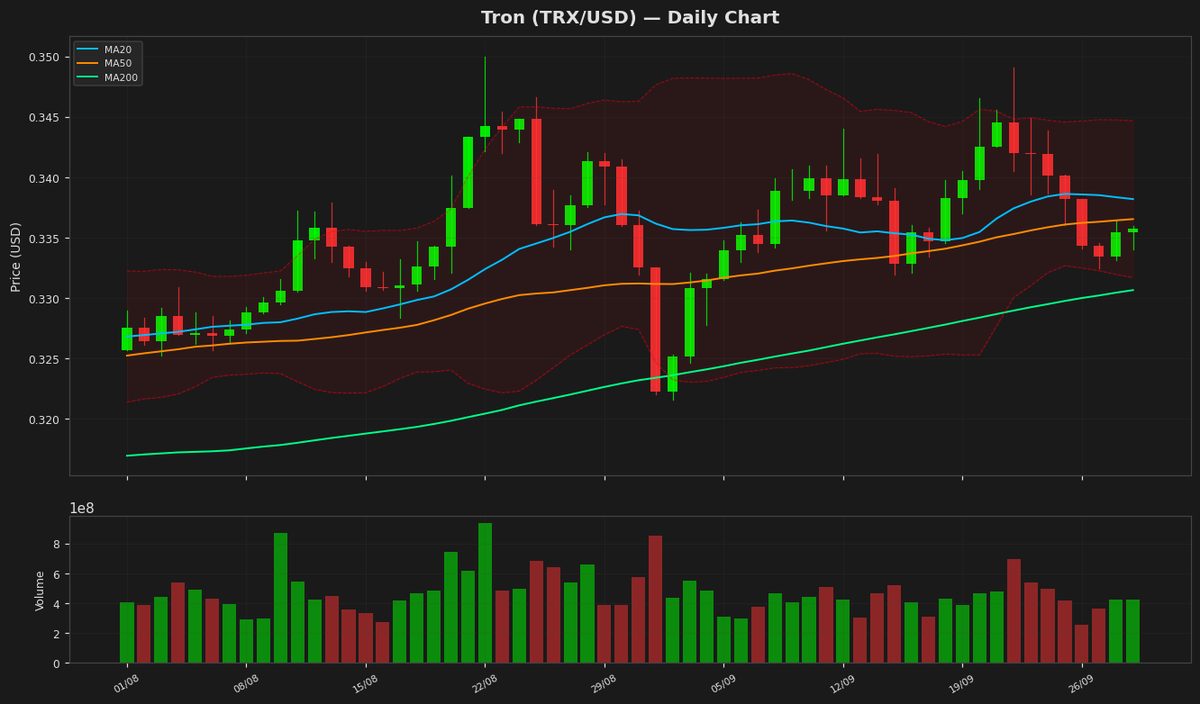
Tron (TRX) is currently trading at $0.335727, showing minimal daily movement with a slight gain of 0.09%. The price is hovering near key moving averages, with the MA20 at $0.338178 and MA50 at $0.33652, indicating a neutral short-term trend. The MA200 at $0.330639 suggests a mild bullish bias in the longer term. Bollinger Bands show a narrowing range, with the upper band at $0.344679 and the lower band at $0.331676, signaling reduced volatility and potential consolidation. The RSI(14) at 55.428107 reflects a balanced momentum, neither overbought nor oversold. The MACD line at 0.000113 remains below the signal line at 0.000841, suggesting weak bullish momentum but no strong bearish divergence. Key support levels are seen near the MA200 ($0.330639) and the lower Bollinger Band ($0.331676), while resistance lies at the upper Bollinger Band ($0.344679) and the 52-week high of $0.37633201. The ATR(14) of $0.004379 indicates low volatility, reinforcing the consolidation phase. A breakout above $0.344679 could signal upward momentum, while a drop below $0.330639 may test lower support near the YTD low of $0.26813799.
Technical Metrics
| Metric | Value |
|---|---|
| Current Price | $0.3357 |
| Daily Change | +0.09% |
| MA 20 | $0.3382 |
| % from MA20 | -0.72% |
| MA 50 | $0.3365 |
| % from MA50 | -0.24% |
| MA 200 | $0.3306 |
| % from MA200 | +1.54% |
| BB Upper | $0.3447 |
| % from BB Upper | -2.60% |
| BB Lower | $0.3317 |
| % from BB Lower | +1.22% |
| RSI (14) | 55.43 |
| MACD | 0.000113 |
| MACD Signal | 0.000841 |
| ATR (14) | 0.004379 |
| 3-Day High | $0.3364 |
| 3-Day Low | $0.3324 |
| 52-Week High | $0.3763 |
| % from 52W High | -10.79% |
| 52-Week Low | $0.2681 |
| % from 52W Low | +25.21% |
| YTD High | $0.3763 |
| % from YTD High | -10.79% |
| YTD Low | $0.2681 |
| % from YTD Low | +25.21% |
📊 Market Commentary
Tron (TRX) is trading at $0.3357, showing modest gains of 0.09% today amid mixed market sentiment. The Relative Strength Index (RSI) at 55.4 indicates neutral momentum, neither overbought nor oversold, suggesting balanced buying and selling pressure. Over the past 52 weeks, TRX has fluctuated between $0.2681 and $0.3763, with the current price hovering near the upper half of this range.
Market sentiment around TRX remains cautiously optimistic, supported by steady network activity and adoption within the decentralized applications (dApps) and stablecoin sectors. Traders are closely monitoring the $0.3400 level as a near-term resistance, which, if broken, could pave the way for a retest of the yearly high near $0.3763. On the downside, support is seen around $0.3200, followed by the psychological $0.3000 level. A drop below $0.3000 could shift sentiment bearishly, potentially testing the 52-week low.
Volume trends have been moderate, reflecting a wait-and-see approach among traders. Key factors influencing TRX include broader crypto market movements, regulatory developments, and network upgrades. The recent focus on Tron’s role in stablecoin transfers and partnerships continues to draw attention. For now, TRX appears to be consolidating within its established range, with traders watching for a decisive breakout or breakdown to gauge the next directional move.
Market sentiment around TRX remains cautiously optimistic, supported by steady network activity and adoption within the decentralized applications (dApps) and stablecoin sectors. Traders are closely monitoring the $0.3400 level as a near-term resistance, which, if broken, could pave the way for a retest of the yearly high near $0.3763. On the downside, support is seen around $0.3200, followed by the psychological $0.3000 level. A drop below $0.3000 could shift sentiment bearishly, potentially testing the 52-week low.
Volume trends have been moderate, reflecting a wait-and-see approach among traders. Key factors influencing TRX include broader crypto market movements, regulatory developments, and network upgrades. The recent focus on Tron’s role in stablecoin transfers and partnerships continues to draw attention. For now, TRX appears to be consolidating within its established range, with traders watching for a decisive breakout or breakdown to gauge the next directional move.
Disclaimer
The content on MarketsFN.com is provided for educational and informational purposes only. It does not constitute financial advice or investment recommendations. All investments involve risk. Cryptocurrency markets are highly volatile. Past performance does not guarantee future results.