Global Commodities — Asian Session: Gold +1.06%, WTI -3.75%, Cotton -4.83%
MarketsFN Commodities Desk

Commodity markets open the Asian session on Wednesday 30 September 2026 with the Shanghai Futures Exchange and Tokyo Commodity Exchange active alongside overnight Globex and CME electronic trading. Top movers: Cotton (-4.83%), Cocoa (-4.20%), WTI Crude Oil (-3.75%). Energies are under selling pressure (avg -1.86%) as regional refiners set intraday procurement bids and any Chinese PMI or oil import data released overnight drives directional momentum in WTI and Brent. Precious metals are range-bound (avg +0.28%) as Shanghai Gold Exchange and Hong Kong premiums vs. London reflect physical demand sentiment.
Chinese demand is the dominant macro theme for this session: copper tracks SHFE inventory levels and NBS manufacturing activity, while iron ore futures (Dalian DCE) set the tone for industrial commodity confidence ahead of the European open. Agricultural futures (avg -1.70%) carry overnight CBOT pricing and react to any Australian Bureau of Meteorology crop forecasts or Vietnamese/Brazilian supply news released in local business hours. Japanese yen moves (via USD/JPY) add an overlay for gold and oil, as JPY-denominated commodity imports shift sensitivity to FX.
All commodities below include pivot levels from the prior session's OHLC, 65-bar candlestick charts with SMA20, SMA50 and Bollinger Bands (20,2), and Asian session forward analysis for Wed 30 Sep 2026.
Today's Economic Calendar
| Time (UTC) | Event | CCY | Previous | Forecast | Actual |
|---|---|---|---|---|---|
| 01:30 | ● RBA Rate Statement | AUD | — | — | — |
| 04:30 | ● RBA Interest Rate Decision (Sep) | AUD | 4.35% | 4.60% | 4.60% |
| 07:00 | ● KOF Leading Indicators (Sep) | CHF | 107.5 | 106.0 | 109.1 |
| 07:00 | ● Spanish CPI (YoY) (Sep) | EUR | 4.3% | 4.6% | 4.9% |
| 07:00 | ● Spanish HICP (YoY) (Sep) | EUR | 4.6% | — | 5.0% |
| 09:30 | ● Italian 10-Year BTP Auction | EUR | 4.10% | — | 4.58% |
| 10:00 | ● German Buba Mauderer Speaks | EUR | — | — | — |
| 10:00 | ● German Buba President Nagel Speaks | EUR | — | — | — |
| 10:00 | ● France Jobseekers Total (Aug) | EUR | 3,143.0K | — | 3,081.7K |
| 11:00 | ● ECB President Lagarde Speaks | EUR | — | — | — |
| 12:00 | ● Unemployment Rate (Aug) | BRL | 5.3% | 5.3% | 5.3% |
| 12:30 | ● GDP (MoM) (Jul) | CAD | 0.3% | 0.0% | 0.0% |
| 12:31 | ● GDP (MoM) (Aug) | CAD | 0.0% | — | 0.2% |
| 13:00 | ● S&P/CS HPI Composite - 20 n.s.a. (YoY) (Jul) | USD | 2.2% | 2.2% | 2.5% |
| 13:00 | ● S&P/CS HPI Composite - 20 n.s.a. (MoM) (Jul) | USD | 0.4% | — | 0.0% |
| 14:00 | ● CB Consumer Confidence (Sep) | USD | 88.6 | 89.2 | 81.9 |
| 14:00 | ● JOLTS Job Openings (Aug) | USD | 7.335M | 7.230M | 7.079M |
| 15:00 | ● BoE MPC Member Mann Speaks | GBP | — | — | — |
| 15:00 | ● FOMC Member Bowman Speaks | USD | — | — | — |
| 16:40 | ● Fed Vice Chair for Supervision Barr Speaks | USD | — | — | — |
| 18:00 | ● FOMC Member Williams Speaks | USD | — | — | — |
| 18:00 | ● ECB's Lane Speaks | EUR | — | — | — |
| 19:00 | ● Fed Waller Speaks | USD | — | — | — |
| 20:30 | ● API Weekly Crude Oil Stock | USD | 1.786M | -1.900M | 1.019M |
| 23:50 | ● Industrial Production (MoM) (Aug) | JPY | -0.2% | 1.4% | — |
Precious Metals
Gold
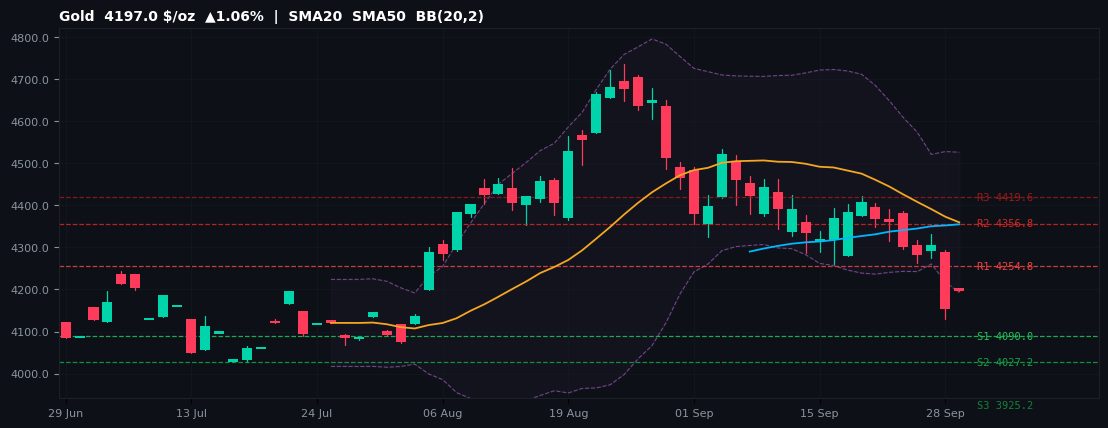
4197.0 $/oz ▲1.06% Session H 4198.1 / L 4197.0 52W 4003.4–5489.4
| R3 | R2 | R1 | PP | S1 | S2 | S3 |
|---|---|---|---|---|---|---|
| 4419.6 | 4356.8 | 4254.8 | 4192.0 | 4090.0 | 4027.2 | 3925.2 |
Gold trades at 4197.0 $/oz (+1.06% vs. prior close) as the Asian session gets underway, at the 13th percentile of its 4003.4–5489.4 $/oz 52-week range. Intraday bias tilts bullish while price holds above the daily pivot at 4192.0 $/oz. The 52-week range of 4003.4–5489.4 places this commodity at the 13th percentile — price remains in the lower half of its annual range, reflecting structural headwinds.
Key drivers for COMEX gold: Federal Reserve policy expectations, real yields, USD strength, and central bank reserve buying. Resistance: R1 4254.8, R2 4356.8, R3 4419.6. Support: S1 4090.0, S2 4027.2, S3 3925.2 $/oz. The R1–S1 corridor (4254.8–4090.0) marks the most probable asian intraday band.
GoldPrecious MetalsBullish
Silver
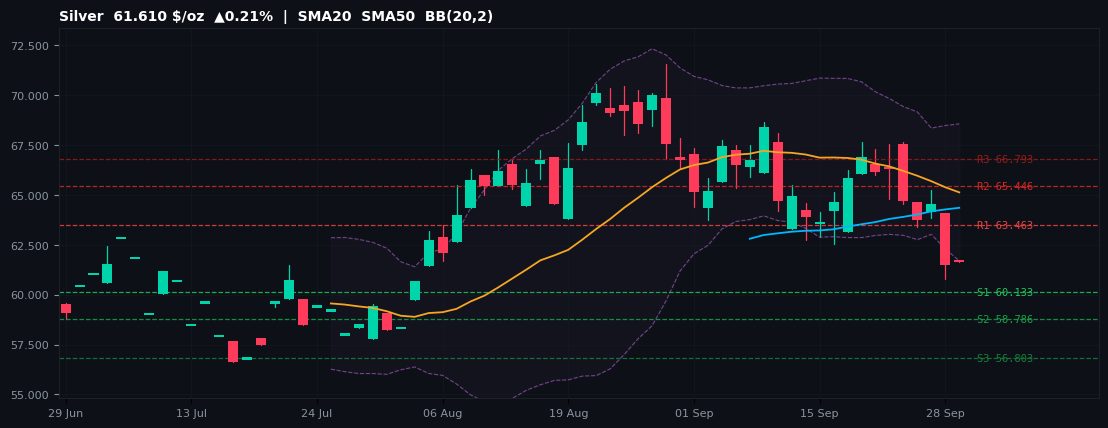
61.610 $/oz ▲0.21% Session H 61.740 / L 61.610 52W 48.301–118.677
| R3 | R2 | R1 | PP | S1 | S2 | S3 |
|---|---|---|---|---|---|---|
| 66.793 | 65.446 | 63.463 | 62.116 | 60.133 | 58.786 | 56.803 |
Silver trades at 61.610 $/oz (+0.21% vs. prior close) as the Asian session gets underway, at the 19th percentile of its 48.301–118.677 $/oz 52-week range. Intraday bias neutral-to-bearish while price holds below the daily pivot at 62.116 $/oz. The 52-week range of 48.301–118.677 places this commodity at the 19th percentile — price remains in the lower half of its annual range, reflecting structural headwinds.
Key drivers for COMEX silver: industrial demand from solar/EV manufacturing, monetary premium vs gold (Gold:Silver Ratio), and mine supply. Resistance: R1 63.463, R2 65.446, R3 66.793. Support: S1 60.133, S2 58.786, S3 56.803 $/oz. The R1–S1 corridor (63.463–60.133) marks the most probable asian intraday band.
SilverPrecious MetalsRangebound
Platinum
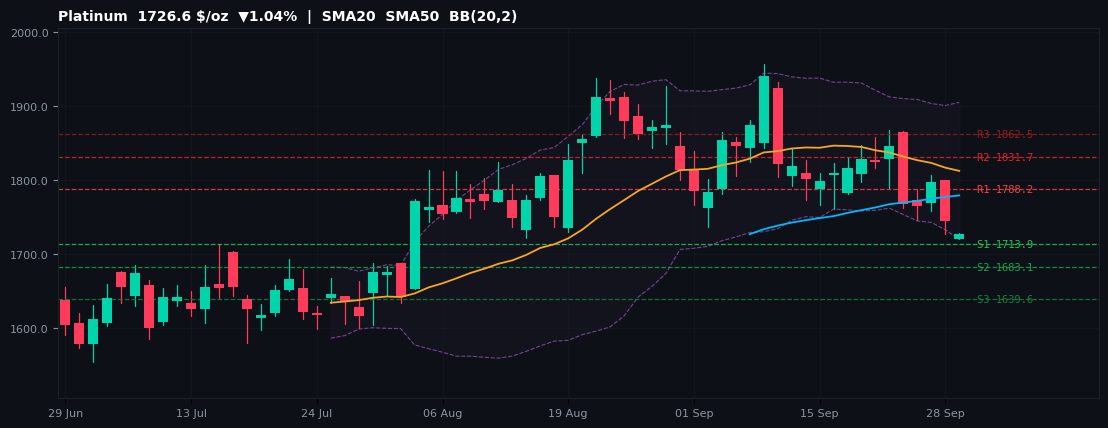
1726.6 $/oz ▼1.04% Session H 1729.2 / L 1720.2 52W 1540.7–2940.0
| R3 | R2 | R1 | PP | S1 | S2 | S3 |
|---|---|---|---|---|---|---|
| 1862.5 | 1831.7 | 1788.2 | 1757.4 | 1713.9 | 1683.1 | 1639.6 |
Platinum trades at 1726.6 $/oz (-1.04% vs. prior close) as the Asian session gets underway, at the 13th percentile of its 1540.7–2940.0 $/oz 52-week range. Intraday bias neutral-to-bearish while price holds below the daily pivot at 1757.4 $/oz. The 52-week range of 1540.7–2940.0 places this commodity at the 13th percentile — price remains in the lower half of its annual range, reflecting structural headwinds.
Key drivers for NYMEX platinum: autocatalytic demand from hydrogen/fuel cells, palladium substitution economics, and South African mine supply. Resistance: R1 1788.2, R2 1831.7, R3 1862.5. Support: S1 1713.9, S2 1683.1, S3 1639.6 $/oz. The R1–S1 corridor (1788.2–1713.9) marks the most probable asian intraday band.
PlatinumPrecious MetalsBearish
Palladium
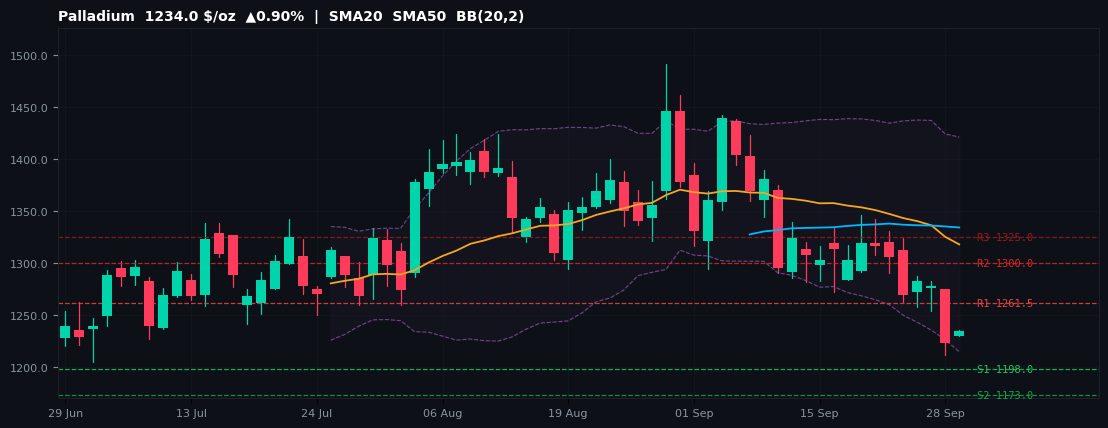
1234.0 $/oz ▲0.90% Session H 1235.0 / L 1230.0 52W 1176.5–2238.7
| R3 | R2 | R1 | PP | S1 | S2 | S3 |
|---|---|---|---|---|---|---|
| 1325.0 | 1300.0 | 1261.5 | 1236.5 | 1198.0 | 1173.0 | 1134.5 |
Palladium trades at 1234.0 $/oz (+0.90% vs. prior close) as the Asian session gets underway, at the 5th percentile of its 1176.5–2238.7 $/oz 52-week range. Intraday bias neutral-to-bearish while price holds below the daily pivot at 1236.5 $/oz. The 52-week range of 1176.5–2238.7 places this commodity at the 5th percentile — price remains in the lower half of its annual range, reflecting structural headwinds.
Key drivers for NYMEX palladium: automotive gasoline catalytic demand, EV transition headwinds, and Russian supply constraints. Resistance: R1 1261.5, R2 1300.0, R3 1325.0. Support: S1 1198.0, S2 1173.0, S3 1134.5 $/oz. The R1–S1 corridor (1261.5–1198.0) marks the most probable asian intraday band.
PalladiumPrecious MetalsBullish
Energies
WTI Crude Oil
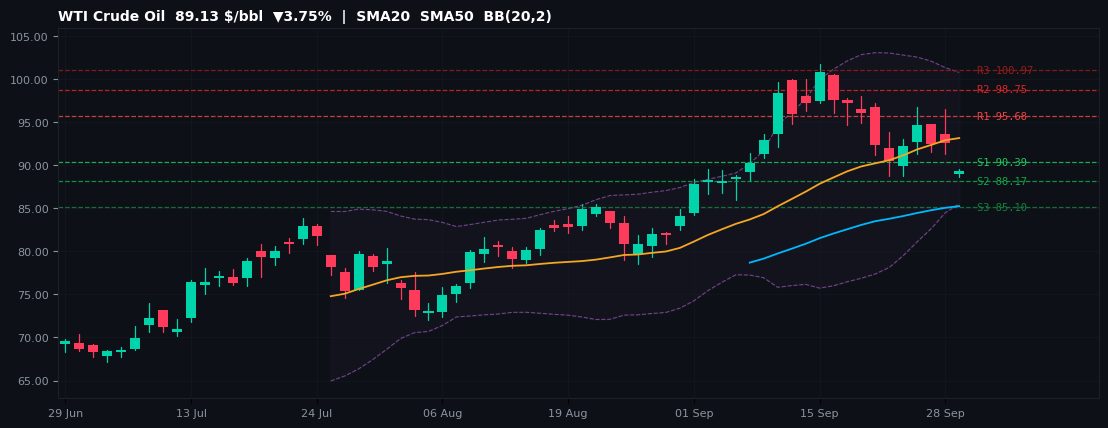
89.13 $/bbl ▼3.75% Session H 89.57 / L 88.58 52W 55.64–101.69
| R3 | R2 | R1 | PP | S1 | S2 | S3 |
|---|---|---|---|---|---|---|
| 100.97 | 98.75 | 95.68 | 93.46 | 90.39 | 88.17 | 85.10 |
WTI Crude Oil trades at 89.13 $/bbl (-3.75% vs. prior close) as the Asian session gets underway, at the 73th percentile of its 55.64–101.69 $/bbl 52-week range. Intraday bias neutral-to-bearish while price holds below the daily pivot at 93.46 $/bbl. The 52-week range of 55.64–101.69 places this commodity at the 73th percentile — momentum is broadly constructive within the annual range.
Key drivers for NYMEX WTI crude: OPEC+ production quotas, US EIA weekly inventory builds/draws, and refinery run rates. Resistance: R1 95.68, R2 98.75, R3 100.97. Support: S1 90.39, S2 88.17, S3 85.10 $/bbl. The R1–S1 corridor (95.68–90.39) marks the most probable asian intraday band.
WTI Crude OilEnergiesBearishBelow S1
Brent Crude Oil
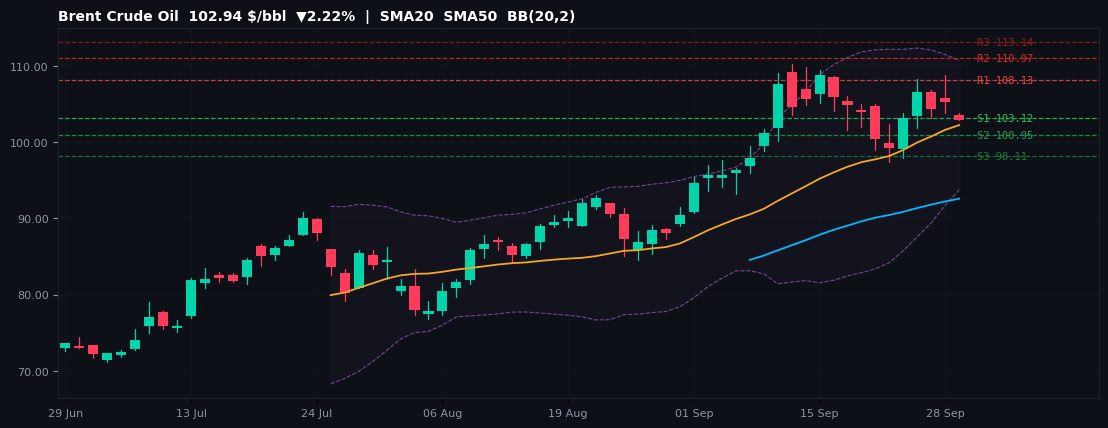
102.94 $/bbl ▼2.22% Session H 103.81 / L 102.94 52W 59.10–110.19
| R3 | R2 | R1 | PP | S1 | S2 | S3 |
|---|---|---|---|---|---|---|
| 113.14 | 110.97 | 108.13 | 105.96 | 103.12 | 100.95 | 98.11 |
Brent Crude Oil trades at 102.94 $/bbl (-2.22% vs. prior close) as the Asian session gets underway, at the 86th percentile of its 59.10–110.19 $/bbl 52-week range. Intraday bias neutral-to-bearish while price holds below the daily pivot at 105.96 $/bbl. The 52-week range of 59.10–110.19 places this commodity at the 86th percentile — momentum is broadly constructive within the annual range.
Key drivers for ICE Brent crude: OPEC+ quota compliance, North Sea loadings, and European and Asian refinery margins. Resistance: R1 108.13, R2 110.97, R3 113.14. Support: S1 103.12, S2 100.95, S3 98.11 $/bbl. The R1–S1 corridor (108.13–103.12) marks the most probable asian intraday band.
Brent Crude OilEnergiesBearishBelow S1
Natural Gas
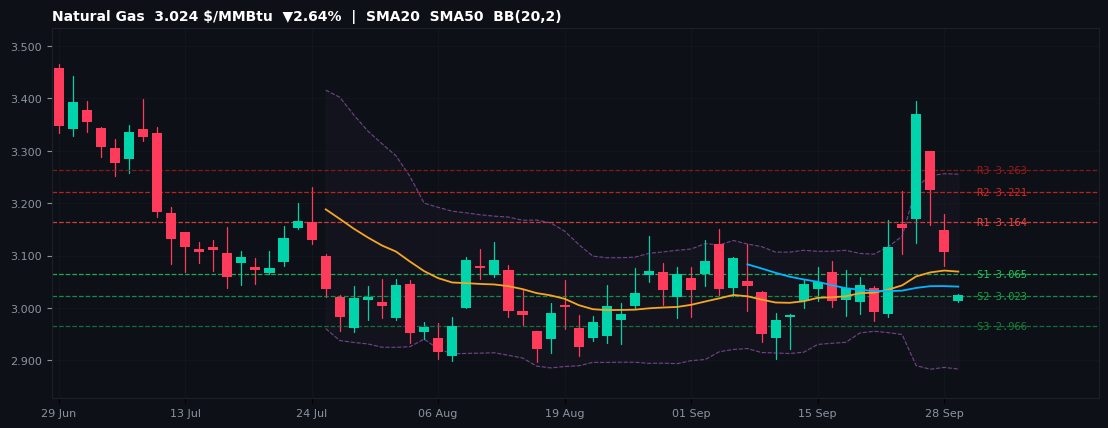
3.024 $/MMBtu ▼2.64% Session H 3.027 / L 3.011 52W 2.896–4.642
| R3 | R2 | R1 | PP | S1 | S2 | S3 |
|---|---|---|---|---|---|---|
| 3.263 | 3.221 | 3.164 | 3.122 | 3.065 | 3.023 | 2.966 |
Natural Gas trades at 3.024 $/MMBtu (-2.64% vs. prior close) as the Asian session gets underway, at the 7th percentile of its 2.896–4.642 $/MMBtu 52-week range. Intraday bias neutral-to-bearish while price holds below the daily pivot at 3.122 $/MMBtu. The 52-week range of 2.896–4.642 places this commodity at the 7th percentile — price remains in the lower half of its annual range, reflecting structural headwinds.
Key drivers for Henry Hub natural gas: US storage draws vs seasonal norms (EIA weekly), weather-driven heating/cooling demand, and LNG export flow. Resistance: R1 3.164, R2 3.221, R3 3.263. Support: S1 3.065, S2 3.023, S3 2.966 $/MMBtu. The R1–S1 corridor (3.164–3.065) marks the most probable asian intraday band.
Natural GasEnergiesBearishBelow S1
RBOB Gasoline
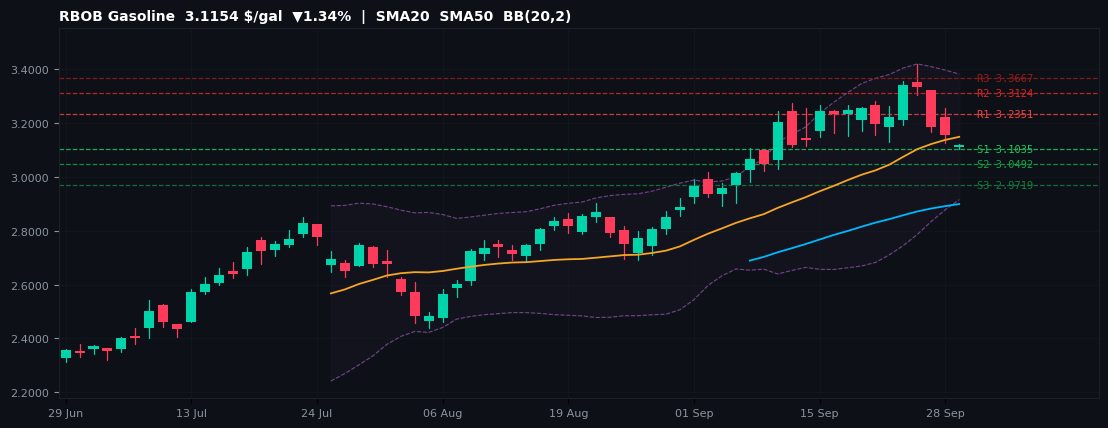
3.1154 $/gal ▼1.34% Session H 3.1222 / L 3.1040 52W 1.6502–3.4193
| R3 | R2 | R1 | PP | S1 | S2 | S3 |
|---|---|---|---|---|---|---|
| 3.3667 | 3.3124 | 3.2351 | 3.1808 | 3.1035 | 3.0492 | 2.9719 |
RBOB Gasoline trades at 3.1154 $/gal (-1.34% vs. prior close) as the Asian session gets underway, at the 83th percentile of its 1.6502–3.4193 $/gal 52-week range. Intraday bias neutral-to-bearish while price holds below the daily pivot at 3.1808 $/gal. The 52-week range of 1.6502–3.4193 places this commodity at the 83th percentile — momentum is broadly constructive within the annual range.
Key drivers for RBOB gasoline: US driving demand, refinery utilisation rates, and crack spread dynamics. Resistance: R1 3.2351, R2 3.3124, R3 3.3667. Support: S1 3.1035, S2 3.0492, S3 2.9719 $/gal. The R1–S1 corridor (3.2351–3.1035) marks the most probable asian intraday band.
RBOB GasolineEnergiesBearish
Heating Oil
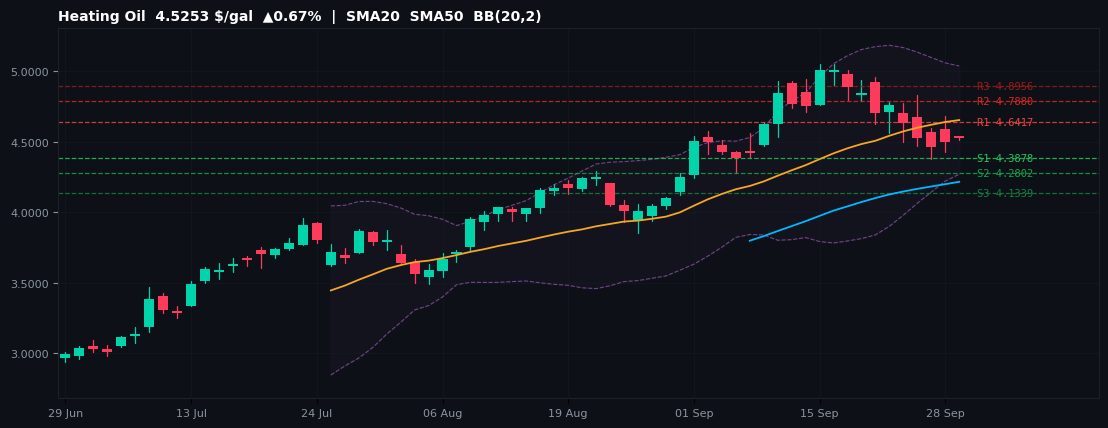
4.5253 $/gal ▲0.67% Session H 4.5348 / L 4.5161 52W 2.0326–5.0499
| R3 | R2 | R1 | PP | S1 | S2 | S3 |
|---|---|---|---|---|---|---|
| 4.8956 | 4.7880 | 4.6417 | 4.5341 | 4.3878 | 4.2802 | 4.1339 |
Heating Oil trades at 4.5253 $/gal (+0.67% vs. prior close) as the Asian session gets underway, at the 83th percentile of its 2.0326–5.0499 $/gal 52-week range. Intraday bias neutral-to-bearish while price holds below the daily pivot at 4.5341 $/gal. The 52-week range of 2.0326–5.0499 places this commodity at the 83th percentile — momentum is broadly constructive within the annual range.
Key drivers for ULSD heating oil: Northern Hemisphere heating demand, distillate inventory levels, and refinery run margins. Resistance: R1 4.6417, R2 4.7880, R3 4.8956. Support: S1 4.3878, S2 4.2802, S3 4.1339 $/gal. The R1–S1 corridor (4.6417–4.3878) marks the most probable asian intraday band.
Heating OilEnergiesBullish
△ OPEC+ Monitoring
OPEC+ Production Quota Update
Track the latest OPEC+ production cuts, quota allocations and compliance data. Monthly output figures, ministerial meeting outcomes and spare capacity estimates — the key drivers behind crude oil prices.
Latest OPEC coverage →Agricultural Commodities
Today's featured selection: Sugar #11, Soybeans, Cocoa, Cotton — comprising the session's top riser, top faller, and two additional picks.
Sugar #11
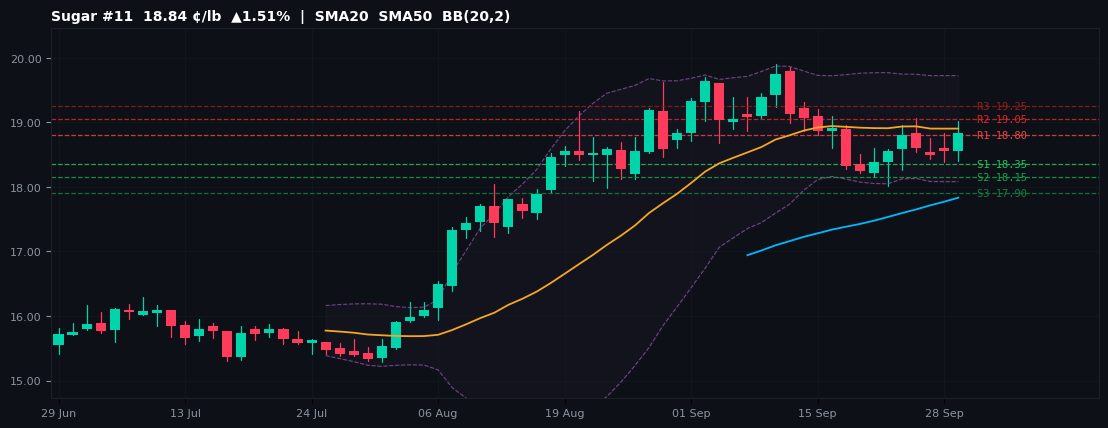
18.84 ¢/lb ▲1.51% Session H 19.02 / L 18.40 52W 14.42–19.90
| R3 | R2 | R1 | PP | S1 | S2 | S3 |
|---|---|---|---|---|---|---|
| 19.25 | 19.05 | 18.80 | 18.60 | 18.35 | 18.15 | 17.90 |
Sugar #11 trades at 18.84 ¢/lb (+1.51% vs. prior close) as the Asian session gets underway, at the 81th percentile of its 14.42–19.90 ¢/lb 52-week range. Intraday bias tilts bullish while price holds above the daily pivot at 18.60 ¢/lb. The 52-week range of 14.42–19.90 places this commodity at the 81th percentile — momentum is broadly constructive within the annual range.
Key drivers for ICE Sugar #11: Brazilian Center-South harvest pace, Indian/Thai export policies, and ethanol economics linkage. Resistance: R1 18.80, R2 19.05, R3 19.25. Support: S1 18.35, S2 18.15, S3 17.90 ¢/lb. The R1–S1 corridor (18.80–18.35) marks the most probable asian intraday band.
Sugar #11AgriculturalBullishAbove R1
Soybeans
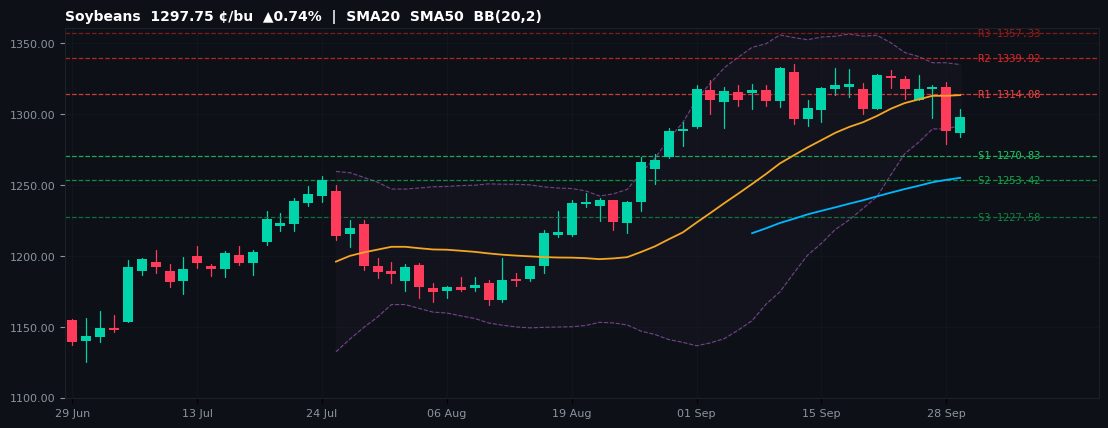
1297.75 ¢/bu ▲0.74% Session H 1304.00 / L 1284.00 52W 1048.25–1335.25
| R3 | R2 | R1 | PP | S1 | S2 | S3 |
|---|---|---|---|---|---|---|
| 1357.33 | 1339.92 | 1314.08 | 1296.67 | 1270.83 | 1253.42 | 1227.58 |
Soybeans trades at 1297.75 ¢/bu (+0.74% vs. prior close) as the Asian session gets underway, at the 87th percentile of its 1048.25–1335.25 ¢/bu 52-week range. Intraday bias tilts bullish while price holds above the daily pivot at 1296.67 ¢/bu. The 52-week range of 1048.25–1335.25 places this commodity at the 87th percentile — momentum is broadly constructive within the annual range.
Key drivers for CBOT soybeans: Chinese crusher demand, South American production competition, and USDA weekly export inspections. Resistance: R1 1314.08, R2 1339.92, R3 1357.33. Support: S1 1270.83, S2 1253.42, S3 1227.58 ¢/bu. The R1–S1 corridor (1314.08–1270.83) marks the most probable asian intraday band.
SoybeansAgriculturalBullish
Cocoa
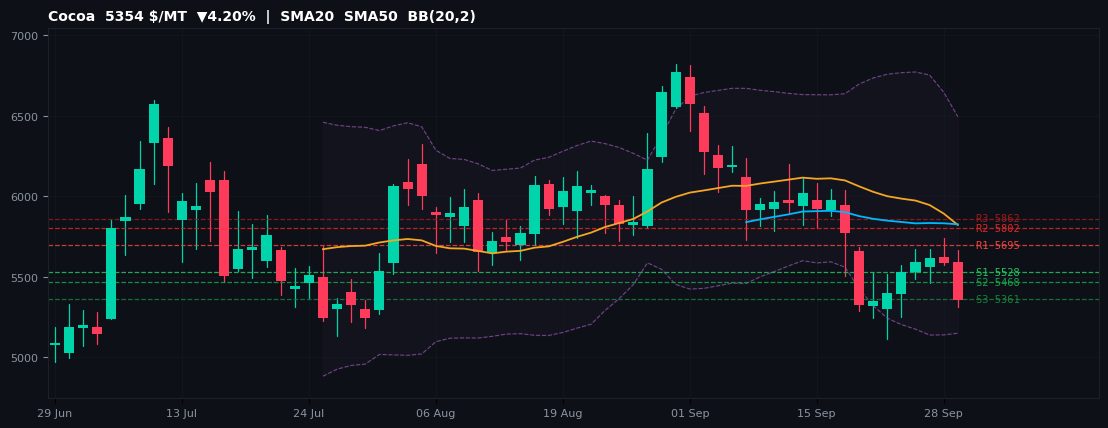
5354 $/MT ▼4.20% Session H 5665 / L 5314 52W 3061–6821
| R3 | R2 | R1 | PP | S1 | S2 | S3 |
|---|---|---|---|---|---|---|
| 5862 | 5802 | 5695 | 5635 | 5528 | 5468 | 5361 |
Cocoa trades at 5354 $/MT (-4.20% vs. prior close) as the Asian session gets underway, at the 61th percentile of its 3061–6821 $/MT 52-week range. Intraday bias neutral-to-bearish while price holds below the daily pivot at 5635 $/MT. The 52-week range of 3061–6821 places this commodity at the 61th percentile — momentum is broadly constructive within the annual range.
Key drivers for ICE cocoa: West African main crop arrivals (Ghana/Ivory Coast), mid-crop estimates, and European grindings data. Resistance: R1 5695, R2 5802, R3 5862. Support: S1 5528, S2 5468, S3 5361 $/MT. The R1–S1 corridor (5695–5528) marks the most probable asian intraday band.
CocoaAgriculturalBearishBelow S1
Cotton
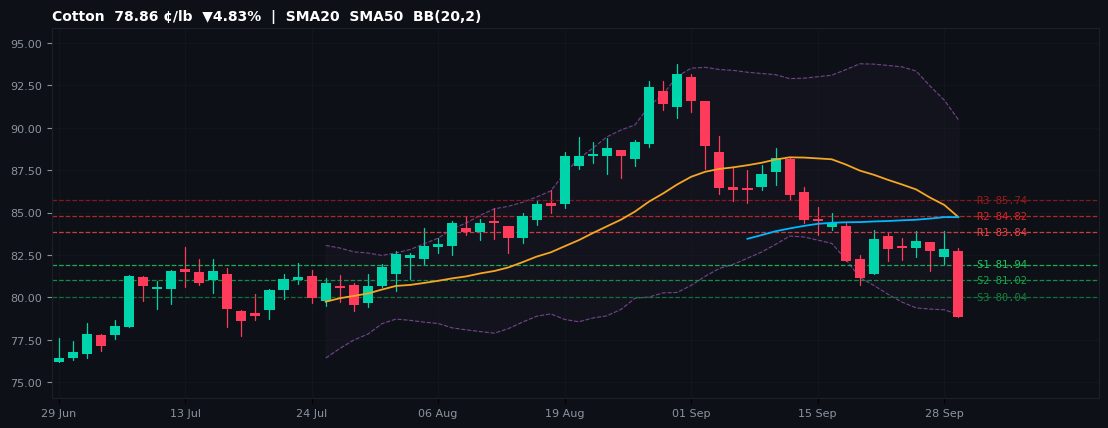
78.86 ¢/lb ▼4.83% Session H 82.91 / L 78.86 52W 66.86–93.74
| R3 | R2 | R1 | PP | S1 | S2 | S3 |
|---|---|---|---|---|---|---|
| 85.74 | 84.82 | 83.84 | 82.92 | 81.94 | 81.02 | 80.04 |
Cotton trades at 78.86 ¢/lb (-4.83% vs. prior close) as the Asian session gets underway, at the 45th percentile of its 66.86–93.74 ¢/lb 52-week range. Intraday bias neutral-to-bearish while price holds below the daily pivot at 82.92 ¢/lb. The 52-week range of 66.86–93.74 places this commodity at the 45th percentile — price remains in the lower half of its annual range, reflecting structural headwinds.
Key drivers for ICE cotton: USDA export sales data, Chinese textile demand, and competing acreage against soybeans. Resistance: R1 83.84, R2 84.82, R3 85.74. Support: S1 81.94, S2 81.02, S3 80.04 ¢/lb. The R1–S1 corridor (83.84–81.94) marks the most probable asian intraday band.
CottonAgriculturalBearishBelow S1
🌿 Agricultural Markets
Understanding WASDE Reports and Grain Markets
The USDA WASDE (World Agricultural Supply and Demand Estimates) is published monthly and is the single most important data release for grain futures. Learn how to read supply/demand tables, ending stocks, and what weather models mean for crop prices.
Explore commodities →For informational purposes only — not investment advice. Pivot levels computed from the previous session's OHLC via the classic floor-pivot formula. Price data sourced from Yahoo Finance (front-month futures) as of the Asian session, Wednesday 30 September 2026. Futures prices are subject to roll effects near contract expiry. Past performance is not indicative of future results.