BNB Hits $700 as RSI Nears Overbought Zone
QuoteReporter
•2 min read
BNB Hits $700 as RSI Nears Overbought Zone
BNB (BNB/USD) | September 03, 2026 $700.9300 +1.88%
🔍 Technical Analysis
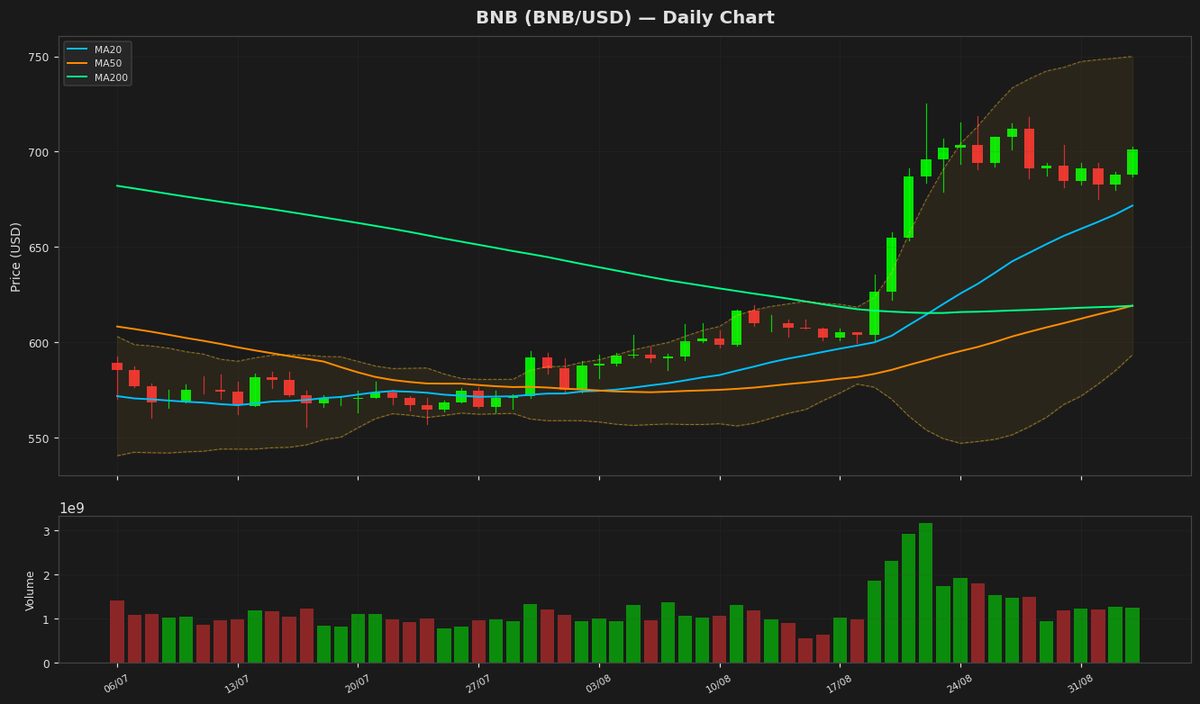
BNB is currently trading at $700.93, showing a daily gain of 1.88%. The price remains above all key moving averages, with the 20-day MA at $671.65, the 50-day MA at $619.10, and the 200-day MA at $619.02, indicating a bullish trend. The Bollinger Bands show the upper band at $749.99 and the lower band at $593.32, suggesting moderate volatility. The current price is closer to the upper band, which may indicate overbought conditions or strong upward momentum. The RSI at 66.50 is approaching overbought territory but has not yet crossed the 70 threshold, leaving room for further upside. The MACD at 22.99 is below the signal line at 25.03, showing a potential bearish crossover, though the histogram remains positive. Key resistance levels to watch are the recent high of $749.99 (upper Bollinger Band) and the 52-week high of $954.86. Support levels include the 20-day MA at $671.65 and the 50-day MA at $619.10. The ATR at 21.61 suggests moderate price movement. A break above $750 could target $800, while a drop below $670 may test $620.
Technical Metrics
| Metric | Value |
|---|---|
| Current Price | $700.9300 |
| Daily Change | +1.88% |
| MA 20 | $671.6546 |
| % from MA20 | +4.36% |
| MA 50 | $619.1002 |
| % from MA50 | +13.22% |
| MA 200 | $619.0182 |
| % from MA200 | +13.23% |
| BB Upper | $749.9907 |
| % from BB Upper | -6.54% |
| BB Lower | $593.3184 |
| % from BB Lower | +18.14% |
| RSI (14) | 66.50 |
| MACD | 22.987302 |
| MACD Signal | 25.029975 |
| ATR (14) | 21.611245 |
| 3-Day High | $702.4756 |
| 3-Day Low | $675.1742 |
| 52-Week High | $954.8583 |
| % from 52W High | -26.59% |
| 52-Week Low | $538.5992 |
| % from 52W Low | +30.14% |
| YTD High | $954.8583 |
| % from YTD High | -26.59% |
| YTD Low | $538.5992 |
| % from YTD Low | +30.14% |
📊 Market Commentary
BNB is trading at $700.93, up 1.88% today, as bullish momentum continues to build. The Relative Strength Index (RSI) at 66.5 suggests the asset is approaching overbought territory but still has room for further upside before hitting extreme levels. Over the past 52 weeks, BNB has fluctuated between $538.60 and $954.86, indicating strong volatility but also resilience, particularly as the current price hovers near the upper half of this range.
Market sentiment appears cautiously optimistic, supported by steady buying pressure and broader strength in the crypto market. Traders are closely monitoring the $700 level, which has turned from resistance to support, reinforcing bullish confidence. The next key resistance lies near the yearly high of $954.86, while a breakdown below $700 could see a retest of the $650 support zone.
Volume trends and institutional interest in Binance-related assets remain focal points, as exchange-based tokens like BNB often reflect broader market activity. Additionally, regulatory developments and Binance’s ecosystem growth could influence price action in the near term. For now, traders are balancing optimism with caution, watching for sustained momentum above $700 or signs of profit-taking that could trigger a pullback. The RSI’s trajectory will be critical in assessing whether the current uptrend can persist without a correction.
Market sentiment appears cautiously optimistic, supported by steady buying pressure and broader strength in the crypto market. Traders are closely monitoring the $700 level, which has turned from resistance to support, reinforcing bullish confidence. The next key resistance lies near the yearly high of $954.86, while a breakdown below $700 could see a retest of the $650 support zone.
Volume trends and institutional interest in Binance-related assets remain focal points, as exchange-based tokens like BNB often reflect broader market activity. Additionally, regulatory developments and Binance’s ecosystem growth could influence price action in the near term. For now, traders are balancing optimism with caution, watching for sustained momentum above $700 or signs of profit-taking that could trigger a pullback. The RSI’s trajectory will be critical in assessing whether the current uptrend can persist without a correction.
Disclaimer
The content on MarketsFN.com is provided for educational and informational purposes only. It does not constitute financial advice or investment recommendations. All investments involve risk. Cryptocurrency markets are highly volatile. Past performance does not guarantee future results.