BNB Eyes $715 as RSI Nears Bullish Zone, Up 0.59% Today
QuoteReporter
•3 min read

BNB Eyes $715 as RSI Nears Bullish Zone, Up 0.59% Today
BNB (BNB/USD) | September 11, 2026 $713.3200 +0.59%
🔍 Technical Analysis
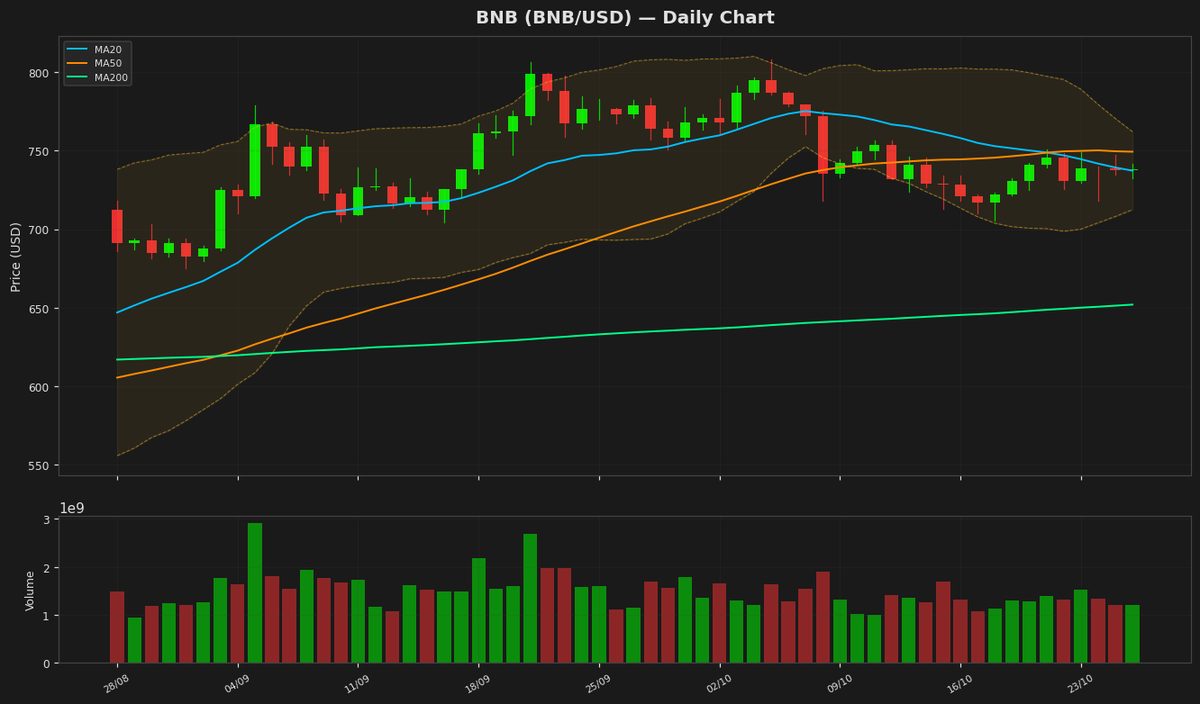
BNB is currently trading at $713.32, up 0.59% on the daily chart, showing mild bullish momentum. The price is hovering just above the 20-day moving average (MA20) at $712.65, indicating a neutral to slightly bullish short-term trend. The 50-day moving average (MA50) at $645.89 and the 200-day moving average (MA200) at $623.94 both suggest a strong long-term uptrend, as the price remains well above these key levels. Bollinger Bands show the upper band at $761.61 and the lower band at $663.69, with the price positioned near the middle band, reflecting a balanced market without extreme volatility. The Relative Strength Index (RSI) at 55.49 is neutral, neither overbought nor oversold, suggesting room for further price movement in either direction. The MACD line at 23.43 is below the signal line at 27.23, indicating potential bearish momentum in the short term, though the histogram shows weakening downward pressure. Key support levels to watch are $663.69 (Bollinger Lower Band) and $645.89 (MA50), while resistance levels include $761.61 (Bollinger Upper Band) and the yearly high at $954.85. The ATR (14) at 23.05 suggests moderate volatility, typical for BNB’s recent trading range. Overall, BNB remains in a bullish trend but may face short-term consolidation or pullback before attempting higher levels.
Technical Metrics
| Metric | Value |
|---|---|
| Current Price | $713.3200 |
| Daily Change | +0.59% |
| MA 20 | $712.6572 |
| % from MA20 | +0.09% |
| MA 50 | $645.8944 |
| % from MA50 | +10.44% |
| MA 200 | $623.9418 |
| % from MA200 | +14.32% |
| BB Upper | $761.6146 |
| % from BB Upper | -6.34% |
| BB Lower | $663.6998 |
| % from BB Lower | +7.48% |
| RSI (14) | 55.49 |
| MACD | 23.431070 |
| MACD Signal | 27.232494 |
| ATR (14) | 23.051736 |
| 3-Day High | $757.1659 |
| 3-Day Low | $704.9750 |
| 52-Week High | $954.8583 |
| % from 52W High | -25.30% |
| 52-Week Low | $538.5992 |
| % from 52W Low | +32.44% |
| YTD High | $954.8583 |
| % from YTD High | -25.30% |
| YTD Low | $538.5992 |
| % from YTD Low | +32.44% |
📊 Market Commentary
BNB is currently trading at $713.32, up 0.59% today, showing modest gains amid mixed market sentiment. The Relative Strength Index (RSI) at 55.5 suggests neutral momentum, neither overbought nor oversold, indicating balanced buying and selling pressure. Over the past 52 weeks, BNB has fluctuated between $538.60 and $954.86, reflecting significant volatility but maintaining a generally bullish trend within a broader consolidation phase.
Market sentiment appears cautiously optimistic as BNB holds above key support near $700, a psychological and technical level that has acted as both resistance and support in recent months. Traders are closely watching the $750-$770 zone, which has previously capped upside moves. A sustained break above this resistance could signal renewed bullish momentum, while failure to hold $700 may invite a retest of lower support near $650.
The broader crypto market's direction, particularly Bitcoin's performance, remains a key influence on BNB's price action. Additionally, developments within the Binance ecosystem, including adoption trends and regulatory updates, are being monitored for potential impact. Trading volume has been steady but not exceptional, suggesting a lack of strong conviction in either direction. For now, BNB remains range-bound, with traders awaiting clearer signals before committing to larger positions.
Market sentiment appears cautiously optimistic as BNB holds above key support near $700, a psychological and technical level that has acted as both resistance and support in recent months. Traders are closely watching the $750-$770 zone, which has previously capped upside moves. A sustained break above this resistance could signal renewed bullish momentum, while failure to hold $700 may invite a retest of lower support near $650.
The broader crypto market's direction, particularly Bitcoin's performance, remains a key influence on BNB's price action. Additionally, developments within the Binance ecosystem, including adoption trends and regulatory updates, are being monitored for potential impact. Trading volume has been steady but not exceptional, suggesting a lack of strong conviction in either direction. For now, BNB remains range-bound, with traders awaiting clearer signals before committing to larger positions.
Disclaimer
The content on MarketsFN.com is provided for educational and informational purposes only. It does not constitute financial advice or investment recommendations. All investments involve risk. Cryptocurrency markets are highly volatile. Past performance does not guarantee future results.